Vol.59: e16160505, January-December 2016 http://dx.doi.org/10.1590/1678-4324-2016160505
ISSN 1678-4324 Online Edition
BRAZILIAN ARCHIVES OF BIOLOGY AND TECHNOLOGY
A N I N T E R N A T I O N A L J O U R N A L
Research on manufacturing text classification based on
improved genetic algorithm
Zhou Kaijun
1*;
Tong Yifei
2.
1School of Mechanical Engineering, Nantong Vocational University,P. R.China; 2School of Mechanical
Engineering, Nanjing University of Science and Technology, P. R.China.
ABSTRACT
According to the features of texts, a text classification model is proposed. Base on this model, an optimized objective function is designed by utilizing the occurrence frequency of each feature in each category. According to the relation matrix oftext resource and features, an improved genetic algorithm is adopted for solution with integral matrix crossover, transposition and recombination of entire population. At last the sample date of manufacturing text information from professional resources database system is taken as an example to illustrate the proposed model and solution for feature dimension reduction and text classification. The crossover and mutation probabilities of algorithm are compared vertically and horizontally to determine a group of better parameters. The experiment results show that the proposed method is fast and effective.
Keywords: Text classification; genetic algorithm; dimension reduction; text classification; manufacturing text;
*
Authors for correspondence: [email protected]
Kaijun, Z et al
Braz. Arch. Biol. Technol. v.59: e16160505, Jan/Dec 2016, Spec Iss 1 2
INTRODUCTION
The total amount of scientific and technological information provided by the internet worldwide exceeds 20TB according to incomplete statistics [1] and increases at a rate higher than 5% every year [2]. What the internet bring about is not only manufacturing resources information but also some problems. On one hand, the manufacturing enterprise has a large demand for manufacturing resources information. On the other hand, the customer has to spend a lot of time to acquire
desired information due to large-scale
accumulation of manufacturing resources
information and sometimes the resource requester
cannot find required resource information
accurately and timely. So how to carry out classification retrieval and management of such large of manufacturing resources information on internet is always a hot area of research [3]. Text classification is normally expressed through the vector space model [4]. But because the number of dimensions is always big after a text is changed to a vector space which can easily result in low efficiency of classification, and also there are many null values in the vector space, the initial features have to be selected to reduce the number of dimensions of features and increase the efficiency of classification[5].
Dong et al.[6]proposed a machinery oriented information text classifier, which adopted the document frequency method to extract first-hand features and then uses the grey relational degree to select second-hand features with reductions of the feature dimensionality and weakened relations between terms, and at last used Bayesian classification algorithm for text classification. Liu et al.[7] proposed a cloud manufacturing text classification method based on Naive Bayes and SVM (support vector machine) under computing environment. In general, the researches on classification of manufacturing text is not common and the applicable methods are limited to traditional text classification algorithms, which can mainly be divided into two categories: one is based on statistics such as Bayesian classification algorithm[8], support vector machine[9], K-nearest neighbor classifier[10] and Rocchio algorithm[11]; and the other is based on rules such as decision trees, rough sets and fuzzy sets[12]. Both have disadvantages of complex computation
and big difficulty to deal with classification for large-scale text set.
Basically, the researches on manufacturing text is not too much and mostly utilize traditional text classification algorithms, which can be divided into two categories: one is based on statistics, such as Bayesian classification algorithm, support vector machine, K- nearest neighbor and Rocchio algorithm; the other is based on rules, such as decision tree rough sets, fuzzy sets and so on. It is difficult for these two categories of algorithms to deal with large scale of texts classification due to big computational complexity, therefore it is necessary to launch corresponding in-depth study. In this paper, text classification based on improved genetic algorithm is studied with column crossover of entire population is adopted for optimization solution.
Model for text classification
Generalized manufacturing text information refers to software and hardware elements necessary for completing all life-cycle production activities, including all elements involved in related
procedures like design, manufacturing,
maintenance and so on. Narrowly-defined
manufacturing resource mainly refers to material elements necessary for producing a part and includes machines, tools, fixture, measuring means and materials. For both kinds of machinery information described as texts, each element can be divided into many subclasses. For example, the machine element can be divided into turning machine, milling machine, boring mill, grinding machine, planer, gear hobbing machine, gear slotting machine, sawing machine, broaching machine, tapping machine, numerical control machine and other machines. Text information classification is to provide the most suitable information as requested by the information users. The text can be expressed with spatial vector according to the vector space model. Providing the text information is divided into t classes (e.g.
}
,
,
,
{
C
1C
2C
tMC
) and each class can beexpressed by
k
ifeatures (e.g.} , , ,
{ 1 2
i
k
i F F F
C ), so the total number of
features of vector space is: k n
t i
i
1.
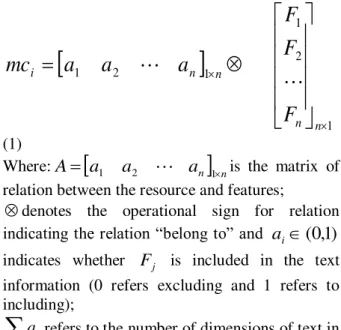
Therefore, the relationship between text
Research on manufacturing text classification
1 2 1
1 2
1
n n n
n i
F
F
F
a
a
a
mc
(1)
Where:
A
a
1a
2
a
n
1nis the matrix of relation between the resource and features;
denotes the operational sign for relationindicating the relation “belong to” and
a
i
(
0
,
1
)
indicates whether Fj is included in the text information (0 refers excluding and 1 refers to including);
i i
a refers to the number of dimensions of text in
vector space. That is, the number of effective features.
Procedures of solutions for classification of text information
Since a lot of classes are involved in each element in text information and a lot of initial features are used to express each class, which results in low computation speed for classification and weak suitability for large-scale computing, the initial features have to be reduced. Due to that only 0 or 1 exists in the matrix of relation between resource and features
A
a
1a
2
a
n
1n, the vector representation of a feature can be easily changed through changing the sequence of columns, and thus the matrix of relation between resource and features is very suitable to genetic coding for genetic algorithm (GA). In addition, compared to traditional method , the genetic algorithm is an adaptive global optimal searching algorithm and has more special and advantageous performance for some large-scale complex non-linear systems [13]. Therefore, the genetic algorithm is selected in this paper for optimization solution and its procedure is shown in Fig. 1.Text inforamtion
Classification
model Coding of GA Test sample Optimize objective
function
Crossover and mutation
Dimension reduction
prediction Relative
accuracy Expected range
of dimension reduction
Figure 1. Procedures of solutions for classification of text information Construction of optimized objective function
Providing the text information is divided into t
classes (e.g.
MC
{
C
1,
C
2,
,
C
t}
) , each classcan be expressed by
k
ifeatures (e.g.} , , ,
{ 1 2
i
k
i F F F
C ), the number of texts in
each class is
s
i and the frequency of occurrence of each feature in each class is expressed viax
i1,x
i2, …, xiki, so the total number of features of vector
space is: k n
t i
i
1and the total number of
manufacturing texts is: s m
t i
i
1.
Then, for any vector
F
{
F
1,
F
2,
,
F
n}
in vector space, the optimized objective function for dimension reduction can be constructed into Formula (2):
ti
k
j
i i i i
i
a
s
x
m
s
p
f
1 1
1
)
(
)
(
Kaijun, Z et al
Braz. Arch. Biol. Technol. v.59: e16160505, Jan/Dec 2016, Spec Iss 1 4
Where p is the number of effective features and
n i i a p 1. Obviously, with the same p, the
bigger the value of
f
(
p
)
is, the higher the frequency of occurrence of an effective feature in corresponding class is and the higher the importance is.Providing T denotes text information to be
classified and the frequencies of occurrence of features in this text information are
y
i1,y
i2, …,i
ik
y (
k
irefers to the number of features in each class), the optimized objective function for text classification and prediction can be expressed as Formula (3):)
(
)
(
1 1max
kij ij i i i i
y
s
x
m
s
T
f
(3)Where,
i
1
,
2
,
,
t
. Obviously, the bigger the value off
(
T
)
is, the higher the relevance between the text to be classified and features in this class is. So the text can be categorized into corresponding class.Solution based on genetic algorithm (1) Coding
Take the matrix of relation
a
a
a
n
nA
1 2
1 between textinforamtion and features as the chromosomal gene code, as shown in Table 1 (resources are divided into t classes, and each class can be expressed by
i
k
features and the total number of features ofvector space is k n
t i i
1 ).Table 1. Chromosomal code
Class1 Class2 ……
Feature1 Feature 2 Feature3 … Feature1 Feature2 Feature3 … … …
0/1 0/1 0/1 0/1 0/1 0/1 0/1 0/1
The value of
a
i is 0 or 1, so the number ofeffective features is
n i i a p 1
e.g. the number of
feature vectors in reduced dimension. Both the initial population and the number of features for dimensionality reduction are randomly generated. To decrease the calculation workload, an approximate reduction range can be partitioned by experienced technical staff according to actual GA operations.
(2) crossover
In order to ensure crossover effects of population, a method with column crossover, transposition and recombination of entire population is adopted. Firstly, utilize the chromosomes of entire population to form a big matrix (the number of
chromosomes is
Popsize
and each chromosomecomprises n columns) and then perform column crossover, transposition and recombination. The detailed crossover process is shown in Fig. 2.
n Popsize a a a a a a a a a a a a a a a a a a a a a a a a a a a a a a a a a a a a a a a a a a a a a a a a a A 77 76 75 74 73 72 71 67 66 65 64 63 62 61 57 56 55 54 53 52 51 47 46 45 44 43 42 41 37 36 35 34 33 32 31 27 26 25 24 23 22 21 17 16 15 14 13 12 11 Interval for crossover n Popsize a a a a b b b a a a a b b b a a a a b b b a a a a b b b a a a a b b b a a a a b b b a a a a b b b A 77 73 72 71 76 75 74 67 63 62 61 66 65 64 57 53 52 51 56 55 54 47 43 42 41 46 45 44 37 33 32 31 36 35 34 27 23 22 21 26 25 24 17 13 12 11 16 15 14 ' Reposition in sequence Reposition in sequence
Randomly select for crossover an interval from the big matrix. For example, select the crossover interval of parent chromosomes and then add the interval to the front column of A and reposition them in sequence to obtain child chromosomes A . The advantages of this method are that all chromosomes are column-crossed over and the number of "1" in each chromosome remains the same so as to ensure the uniformity of final dimension reduction. In addition, it is not necessary to consider the parent chromosomes in this method and the obtained generation has certain variations, which is beneficial to keep the diversity of population.
(3) mutation
Generate a random number from 0 to
n
as the column number of population matrix and anothertwo random numbers from 0 to
Popsize
asposition flags for interchange. Once mutation occurs, the gene value of corresponding position is interchanged. The selection of positions for interchange shall ensure the gene values of chromosomes are different and change the original gene value as far as possible so as to generate new solution advantageously.
(4) GA operations procedure
Step1: Providing the population scale
Popsize
and the number of features for reduced dimension p, randomly generate the initial population
)
(
k
pop
and find out the chromosomei
withbiggest fitness function value. The optimization
function value is expressed as f .
Step2: Calculate the optimization function value
of population
pop
(
k
)
and find out the biggestvalue of this function
f
maxand correspondingchromosome i. If fmax f , let ii,f fmax. Also find out the smallest value of this function
min
f
and corresponding chromosome j , and letthe variable
fit
f
min. Iff
min
f
, let ff i
j , min . Wherein
f
(
i
)
andf
(
j
)
denote the optimization function values of chromosomesi and jrespectively (
i
,
j
pop
(
k
)
).Step3: stop calculation if ending conditions are
met, and then output the optimal chromosome
i
and the optimal solution f . Otherwise, providing
the crossover probability
P
c, crossover)
(
k
newpop
as in Fig.2 to obtain the population)
(
k
crosspop
.Step4: carry out mutation for
crosspop
(
k
)
toobtain
mutpop
(
k
)
.Step5: let
pop
(
k
)
mutpop
(
k
)
andk
k
1
,and then return to Step2.
Case study
In order to validate the proposed algorithm, the sample date are from China Knowledge Resource
Integrated Database (http://www.cnki.net/),
WanFang Data(http://g.wanfangdata.com.cn/),
CHINA SCIENCE AND TECHNOLOGY
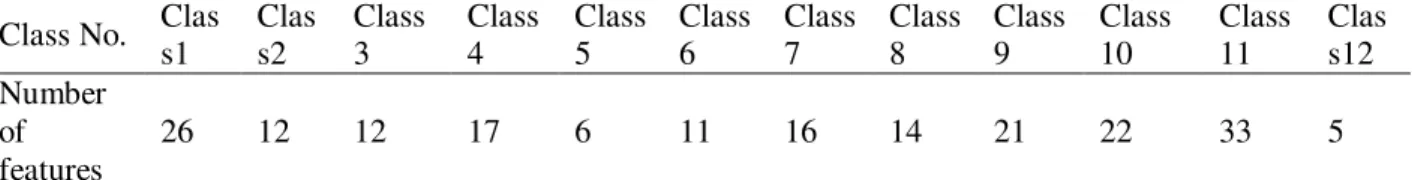
JOURNAL DATABASE and other professional resources database system. The data contains 5681 items for training and 2447 items for prediction. The sample data is divided into 12 classes (i.e. concrete machinery, lifting machinery, motor vehicles industry, crushing equipment, port machinery and so on) and the data not belonging to these 12 classes is considered as "else". In order to increase the test speed, firstly use the document frequency method [14] to initially screen features. 195 alternative features are left and the distribution in each class is shown in Table 2. Then apply VB.net language to compile the algorithm and set the iteration number of generations for ending as 30000.
Table 2. Screening of initial features in each class
Class No. Clas
s1
Clas s2
Class 3
Class 4
Class 5
Class 6
Class 7
Class 8
Class 9
Class 10
Class 11
Clas s12 Number
of features
26 12 12 17 6 11 16 14 21 22 33 5
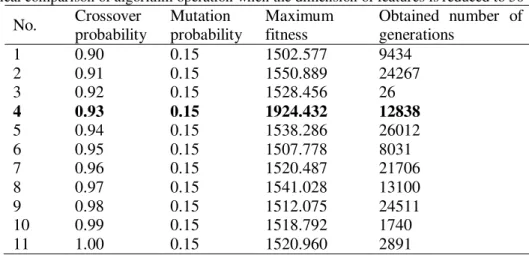
In order to obtain better parameters of crossover probability and mutation probability, firstly initially determine the mutation probability as 0.15 and crossover probability varying from 0.90 to 1
Kaijun, Z et al
Braz. Arch. Biol. Technol. v.59: e16160505, Jan/Dec 2016, Spec Iss 1 6
probability from 0.10 to 0.20. The comparison of the operation results is as shown in Table 4. Finally determine a set of better parameters for genetic algorithm operation: crossover probability as 0.93 and mutation probability as 0.15. The operation results for GA under these parameters is
shown in Fig. 3. It can be seen from Fig. 3 the algorithm steadily converges to optimal result within generations for population iteration, indicating the algorithm has a good engineering application value.
Table 3. Vertical comparison of algorithm operation when the dimension of features is reduced to 50
No. Crossover
probability
Mutation probability
Maximum fitness
Obtained number of generations
1 0.90 0.15 1502.577 9434
2 0.91 0.15 1550.889 24267
3 0.92 0.15 1528.456 26
4 0.93 0.15 1924.432 12838
5 0.94 0.15 1538.286 26012
6 0.95 0.15 1507.778 8031
7 0.96 0.15 1520.487 21706
8 0.97 0.15 1541.028 13100
9 0.98 0.15 1512.075 24511
10 0.99 0.15 1518.792 1740
11 1.00 0.15 1520.960 2891
Table 4. Horizontal comparison of algorithm operation when the dimension of features is reduced to 50
No. Crossover
probability
Mutation
probability Optimal
generation
Mutation
probability Optimal
generation
Mutation
probability Optimal
generation
0.10 0.15 0.20
1 0.91 1532.894 13500 1550.889 24267 1516.328 15322
2 0.93 1537.576 4015 1924.432 12838 1526.815 26758
3 0.94 1521.526 5577 1538.286 26012 1520.569 21080
4 0.97 1506.568 26926 1541.028 13100 1536.144 12507
Number of generations
V
al
ue
of fi
tne
ss
the dimension of features
Figure 3. Algorithm operation when the dimension of features is reduced to 50
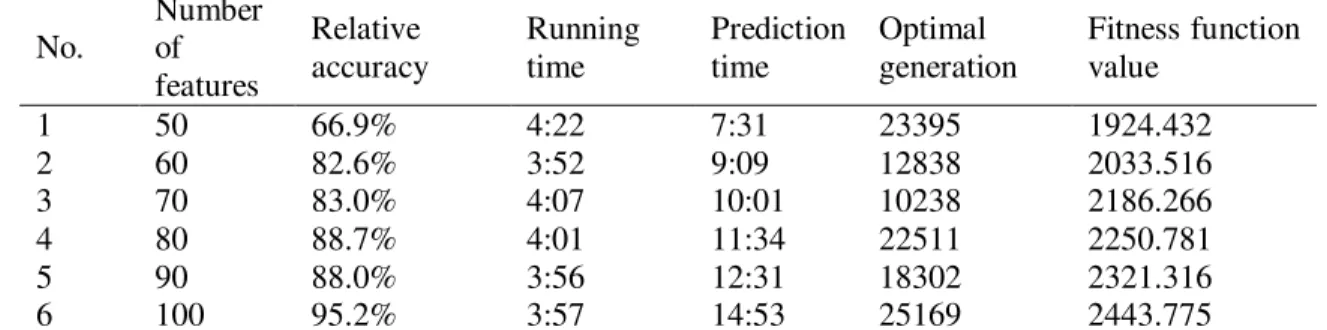
To check the comprehensive performance of the proposed algorithm, use the prediction data to compare in view of running time and prediction accuracy when the dimension of features is
Research on manufacturing text classification
the reduced dimension of features, and the prediction time is related to the reduced dimension
of features: the less the number of features is, the shorter the prediction time costs.
Table 5. Comparison of prediction accuracy
No.
Number of features
Relative accuracy
Running time
Prediction time
Optimal generation
Fitness function value
1 50 66.9% 4:22 7:31 23395 1924.432
2 60 82.6% 3:52 9:09 12838 2033.516
3 70 83.0% 4:07 10:01 10238 2186.266
4 80 88.7% 4:01 11:34 22511 2250.781
5 90 88.0% 3:56 12:31 18302 2321.316
6 100 95.2% 3:57 14:53 25169 2443.775
Remarks: ① Relative accuracy refers to the ratio between the prediction result after and before the dimension of features is reduced;
② Operation system :Microsoft windows XP professional 2002;
③ CPU: Intel Core2 Dou CPU T5750 @2.00GHz with memory 2GB.
CONCLUSION
(1) The dimensionality reduction for features of texts can effectively increase the running speed and reduce the dimensional explosion. However the dimension of features shall be not as little as possible since too little number of features can affect the accuracy of final classification. For example in this case, when the number of features is reduced to less than 60, the relative accuracy decreases a lot. So a proper balance point between the dimension reduction for features and the accuracy shall be selected according to actual situation.
(2) The method with integral matrix crossover,
transposition and recombination of entire
population can make all chromosomes be involved in cross over which is beneficial to generate new solution and keep the diversity of population. Reserving the optimal chromosomes in each
generation of population is beneficial to
inheritance of good genes in population and helpful the algorithm rapidly converge to the optimal solution.
(3) The selection of initial features can greatly affect the accuracy of prediction result, so the initial features screening of each class shall reserve key or exclusive feature attributes of the class. (4) A group of better parameters can be obtained through vertical and horizontal comparison of
algorithm operation performance (only a
parameter is changed every time) based on the good experience of technical staff. The orthogonal or homogeneous experiment can be introduced in
actual operation in order to rapidly decide the better parameter of algorithm.
The manufacturing text information on the internet accumulates massively along with the rapid development of information technology. A model for text information classification is constructed in this paper according to the features of text resource to reveal the mapping relation between text information and features. The genetic algorithm is adopted to solve feature dimension reduction. The case proves that this proposed method is fast and effective.
ACKNOWLEDGMENTS
This paper was supported by the National Natural
Science Foundation of China (Grant
No.61104171) and Qing Lan Project of JiangSu Province of China (Grant No.2014).
Statement
The author(s) declare(s) that there is no conflict of interests regarding the publication of this article.
REFERENCES
[1]Li J, Furuse K, Yamaguchi K. Focused crawling by exploiting anchor text using decision tree.Www Special Interest Tracks & Posters of International
Conference on World Wide Web, 2005:1190-1191.
Kaijun, Z et al
Braz. Arch. Biol. Technol. v.59: e16160505, Jan/Dec 2016, Spec Iss 1 8
[3]Nguyen M H, Torre F D L. Optimal feature selection for support vector machines. Pattern Recognition, 2010, 43(3):584-591.
[4]Liu H, Sun J, Liu L, et al. Feature selection with dynamic mutual information. Pattern Recognition, 2009, 42(7):1330-1339.
[5]Destrero A, Mosci S, Mol C D, et al. Feature selection for high-dimensional data. Computational
Management Science, 2009, 6(1):25-40.
[6]Dong Lili, Wei Shenghui. Design of Mechanical Information Text Classifier.Microelectronics &
Computer, 2012, 29(4):142-145.
[7] Liu Kan,Liu Zhong.An Algorithm of Manufacturing Text ClassificationOriented Cloud Computing Environment. Machine Design and Manufacturing
Engineering, 2013,42(1): 28-31.
[8] Wang S, Jiang L, Li C. Adapting naive Bayes tree for text classification. Knowledge & Information
Systems, 2015, 44(1):77-89.
[9] B. Ramesh, J.G.R. Sathiaseelan. An Advanced Multi Class Instance Selection based Support Vector Machine for Text Classification.Procedia Computer
Science, 2015, 57(1):1124-1130.
[10]Chavan S, Ran F, Nicholls I A. Acute Toxicity-Supported Chronic Toxicity Prediction: A k-Nearest
Neighbor Coupled Read-Across
Strategy.International Journal of Molecular Sciences, 2015, 16:11659-11677.
[11]Whitehead N P, Scherer W T, Smith M C. Use of Natural Language Processing to Discover Evidence of Systems Thinking. IEEE Systems Journal, 2015:1 - 10.
[12]Wang X, Liu X, Pedrycz W, et al. Fuzzy rule based decision trees. Pattern Recognition, 2015, 48(1):50– 59.
[13]Kuldeep Kumar. Genetic Algorithm Review.International Journal of Technical
Research,2013, 2(3):24-29.
[14] Yang K F, Zhang Y K, Yan L I. Feature Selection Method Based on Document Frequency. Computer
Engineering, 2010,36(17):33-36.