FUSION OF HYPERSPECTRAL AND LIDAR DATA BASED ON DIMENSION
REDUCTION AND MAXIMUM LIKELIHOOD
B. Abbasia , H. Arefia, B. Bigdelia, M.Motagha, b, S.Roessnerb
a Department of Geomatics and Surveying Eng., University of Tehran, Tehran, Iran, (abbasi.bahar, hossein.arefi, bigdeli)@ut.ac.ir b GFZ German Research Centre for Geosciences, Section of Remote Sensing, 14473, Potsdam, Germany, (motagh,
Commission VI, WG VI/4
KEY WORDS: Lidar, Hyper-spectral, Fusion, Classification, Maximum Likelihood
ABSTRACT:
Limitations and deficiencies of different remote sensing sensors in extraction of different objects caused fusion of data from different sensors to become more widespread for improving classification results. Using a variety of data which are provided from different sensors, increase the spatial and the spectral accuracy. Lidar (Light Detection and Ranging) data fused together with hyperspectral images (HSI) provide rich data for classification of the surface objects. Lidar data representing high quality geometric information plays a key role for segmentation and classification of elevated features such as buildings and trees. On the other hand, hyperspectral data containing high spectral resolution would support high distinction between the objects having different spectral information such as soil, water, and grass. This paper presents a fusion methodology on Lidar and hyperspectral data for improving classification accuracy in urban areas. In first step, we applied feature extraction strategies on each data separately. In this step, texture features based on GLCM (Grey Level Co-occurrence Matrix) from Lidar data and PCA (Principal Component Analysis) and MNF (Minimum Noise Fraction) based dimension reduction methods for HSI are generated. In second step, a Maximum Likelihood (ML) based classification method is applied on each feature spaces. Finally, a fusion method is applied to fuse the results of classification. A co-registered hyperspectral and Lidar data from University of Houston was utilized to examine the result of the proposed method. This data contains nine classes: Building, Tree, Grass, Soil, Water, Road, Parking, Tennis Court and Running Track. Experimental investigation proves the improvement of classification accuracy to 88%.
1. INTRODUCTION
One of the powerful methods for improving classification performance is data and sensor fusion. In recent years, different remote sensing sensors are provided a wide spectrum of data. For many applications, the information provided by single sensors are incomplete and imprecise, multiple sensors can provide complementary data and fusion of information from different sensors can provide the better information from desired area which is not possible with individual sensors (Simon, 2002. Pohl and Van Genderen, 1998).
Fusion of multiple datasets can be performed at the signal, pixel, feature and decision level (Esteban, 2014, Pohl, 1998). In signal level fusion, signals from multiple sensors are combined together to create new signal with a better signal-to-noise ratio than the input signals. In pixel level fusion, the information from different images on a pixel by pixel are merged to improve detection of objects in some tasks such as segmentation. Feature level fusion consists of merging features extracted from different images. In this level of fusion, features are extracted from different sensors are combined to create a feature vector for classified using a classifiers methods. In decision level fusion, different datasets are combined at a higher level of integration. In this level of fusion, at first the data from each single sensor is classified, then fusion consists of merging the output from the classification (Du et al. 2013, Dong et al. 2009, Yan, 2004).
The aim of our work is fusion of HSI with Lidar data based on a Maximum Likelihood classification algorithm. On the one hand, hyperspectral data are optical images describing spectral characteristics of each pixel with high spectral resolution. On the other hand, Lidar data show the heights of observed areas
and objects on the ground. Objects such as buildings covered with different roofing materials, streets and other open spaces as well as different vegetation types can be detected in HIS, because the spectral characteristics of these materials differ from each other in a significant way (Roessner et al., 2001, Segl et al., 2003, Heiden et al., 2007).
In Lidar data object detection is possible as well as prediction about height of objects. Fusion of these both datasets is expected to increase the classification accuracy.
This paper proposes a classifier fusion system based on ML classifier and dimension reduction methods for fusion of HSI and Lidar data. At first, different features are extracted from both datasets generate features spaces on hyperspectral and Lidar data. Then, classification based on ML was applied on features from hyperspectral and Lidar data. Finally, using a classifier fusion method the outputs of classifiers from hyperspectral and Lidar data are fused.
2. PROPOSED METHOD
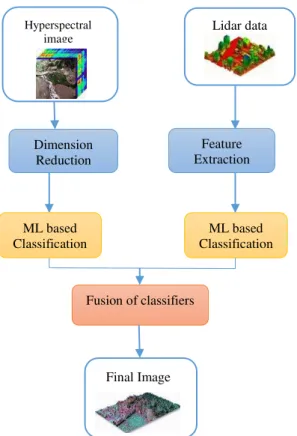
This paper proposes a classification method based on ML and dimension reduction for fusion of HSI and Lidar data. In first section, different feature extraction methods are used for extracting more information from Lidar data. In this step different dimension reduction methods are applied on HIS data. In second section, classification based on ML is applied on features separately. In final section, the classifiers are obtained from two datasets fused together using a fusion method and provided a final image. General diagram for proposed method is shown in figure 1.
Figure 1. Proposed method for Lidar and hyperspectral data fusion
2.1 Feature Extraction
In this step, as shown in the figure 1, different features are extracted from Lidar and hyperspectral data. These features must contain useful information to improve accuracy of classification process.
2.1.1 Dimension Reduction on HSI data
One of the main steps of classification process on HSI is extraction of proper features from dataset. These features must contain useful information to identify different regions of the surface. NDVI (Normalized Difference Vegetation Index) can be used to transform HSI into a single image band representing vegetation distribution. The NDVI values indicate the amount
of green vegetation present in the pixel. Higher NDVI values indicate more green vegetation. This formulation is shown in equation 1.
(1)
Other feature extraction methods are Principal Component Analysis (PCA) and Minimum Noise Fraction (MNF). PCA and MNF have been utilized to reduce the dimension of spectral bands. The number of 30 features containing the most information of the HSIs is considered for both PCA and MNF. Because the variances of bands are high in 30 first bands than other bands.
2.1.2 Feature extraction on Lidar data
Extraction of proper features from Lidar data is one of main steps in classification process. Feature descriptors can be measured based on the grey value relationships between each pixel and its neighbouring pixels in a local window or in the global image. On Lidar data, different GLCM have been used on Lidar data. GLCM can be measured by calculating how often a pixel with grey intensity value i occurs horizontally adjacent to a pixel with the value j. GLCM is one of the fundamental techniques used for texture analysis defined by Haralick and his colleague (1973).
The features on Lidar data are represented in Table 1.
Feature’s Name Formulation
Contrast
j ij
i
p
j
i
, 2)
,
(
|
|
Correlation
ji i j
j
i
p
j
j
i
i
,)
,
(
)
)(
(
Dissimilarity
|
|
(
)
,
j
i
p
j
i
j i
Entropy
j i
j
i
p
j
i
p
,)
,
(
)).
,
(
ln
(
Mean
j i
j
i
p
i
,)
,
(
.
Homogeneity
ji
i
j
j
i
p
,
1
|
|
)
,
(
Second Moment
j ij
i
p
, 2))
,
(
(
Variance
j ii
i
j
i
p
, 2)
(
).
,
(
Table 1. Different features on Lidar data
2.2 ML based classification
Several urban classification methods have been proposed for classification of Lidar and hyperspectral data. Maximum Likelihood (ML) is a supervised classification method derived from the Bayes theorem, the probability which a pixel with feature vector w belongs to class I is given by:
(2) Lidar data Hyperspectral image Dimension Reduction Feature Extraction ML based Classification ML based Classification
Fusion of classifiers
Where P(w|i) is the likelihood function, P(i) is the probability which class I occurs in the area and P(w) is the probability that w is observed.
ML classification often assumes that the statistics for each class in each band are normally distributed. Then the probability of belonging of each pixel to a specific class was calculated. Consequently, each pixel is assigned to the class which has the highest probability (Richards, 1999):
(3) 2.3 Fusion of HSI and Lidar data
In step 1, different features are extracted on HSI and Lidar data. Then, ML classifiers are applied on each feature space separately. After that results of each classifier are fused together. Classifier fusion is applied on various types of data to improve single classifier results. Generally, two types of classifier fusion methods exist: crisp and fuzzy (Kuncheva, 2004). In our proposed method, we applied one of the crisp classifier fusion methods: NB (Naive Bayes) (Kuncheva, 2004). Naïve Bayes is a statistical classifier fusion method which can be used for fusing the outputs of single classifiers. Denote by P( ) the probability that classifier jth labels x in class . L is the number of classifier and c is the number of classes. NB is based on the Bayesian theory (Kuncheva, 2004) which is represented as follows:
(4)
The posterior probability needed to label x equal with:
(5)
The denominator does not depend on and can be ignored, so the support for class can be presented as follows:
(6)
The practical implementation of the NB method on a data set with cardinality N is explained as follows. For each classifier, a c × c confusion matrix is calculated by applying testing data set. The ( k, s) the entry of this matrix, is the number of the elements of data set whose true class label was and are assigned by the classifier to class By we denote the total number of elements of data set from class . Taking as an estimate of the probability , and as an estimate of the prior probability for class . The final equation for class is:
(7)
NB classifier has been found to be surprisingly accurate and efficient in many studies (Kuncheva, 2004).
3. RESULT
3.1 Data set
In this paper, we present a fusion method for improvement of classification results on urban areas. The proposed approach
was applied on two data sets. A HSI and a Lidar derived digital surface model (DSM); both data sets with spatial resolution of 2.5 m which is shown in figure 2. The HSI consists of 144 spectral bands. The data sets have captured over the University of Houston campus and the neighbouring urban area and have been acquired by the National Science Foundation (NSF)-funded Centre for Airborne Laser Mapping (NCALM). The ground truth of this data set which was provided by NCALM have 15 different land cover classes; in our proposed method some of these classes have been merged, Building class has been provided by combining commercial and residential classes, Road class has been provided by merging highway, road and railroad classes, Grass class has been provided by combining grass healthy, grass stressed and grass synthetic and by merging parking lot1 and parking lot2 have been produced Parking class. These classes are shown in table 2.
(a)
(b)
Figure 2.data sets: a) Hyperspectral Image, b) Lidar derived DSM
Class Name Number of
training samples
Grass 580
Tree 188
Soil 186
Water 182
Building 387
Road 565
Parking 376
Tennis court 181
Running track 187
Table 2. Land cover classes and reference number
3.2 Results and Experiment
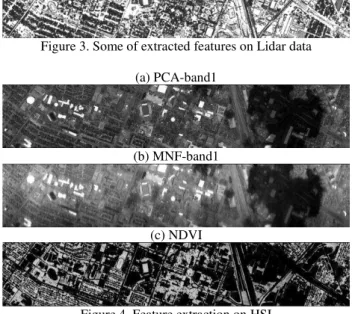
In first step of proposed method, feature spaces on HSI and Lidar data has been produced independently. All of textural features in Table 1 were applied on Lidar data to generate different feature spaces. Some of these feature spaces are illustrated in Figure 3.
Figure 4 also illustrates feature space on HSI. (a) Mean
(b) Variance
(d) Second Moment
Figure 3. Some of extracted features on Lidar data
(a) PCA-band1
(b) MNF-band1
(c) NDVI
Figure 4. Feature extraction on HSI
In next step, classification based on ML is applied on hyperspectral and Lidar data. After classification of hyperspectral and Lidar data, NB is applied as classifier fusion methods on the outputs of classifiers.
Table 3 illustrates the accuracies of classification results on all nine classes of data sets. Finally, Figure 5 demonstrates the classifier fusion strategy on hyperspectral and Lidar data.
Table 3. Accuracies of classification results on all classes
Class Name Producer Accuracy
User Accuracy
Grass 92.96 94.96
Tree 92.80 96
Soil 93.84 93.84
Water 91.60 96
Building 78.90 87.42
Road 89.61 89.28
Parking 81.10 68.07
Tennis court 90.73 96
Running track 92.87 96
Figure 5. Final classification map
4. CONCLUSION
In this paper, the performance of a decision fusion method for fusion of hyperspectral and Lidar data is assessed. In first step, feature spaces have been extracted on hyperspectral and Lidar data. Then ML classifiers were applied independently on both data sets. Finally, a decision fusion method based on Bayesian theory was applied to fuse outputs of classifiers of hyperspectral and Lidar data.
Fusion of hyperspectral and Lidar data in decision level is the important aim of our proposed method. In this level, complexities of hyperspectral and Lidar data are considered. Because HSIs provide a detailed description of the spectral
signatures of objects but no information on the height of ground covers, whereas Lidar data provide detailed information about the height of objects but no information on the spectral signatures. So the elevation information of Lidar data is very effective for the separation of objects with similar spectral signatures. Also the spectral information of hyperspectral data is very effective for discrimination of similar elevation objects but different spectral information. Based on the results of our proposed method, fusion of classifiers on two data sets improves classification accuracy. The overall accuracy (OA) and kappa coefficient of this strategy are shown in Table 4. Based on these results, proposed classifier fusion on hyperspectral and Lidar data improves the classification accuracy.
Table 4. Results of final fusion method
OA 87.95
Kappa 0.8668
ACKNOWLEDGEMENTS
The authors would like to thank the Hyperspectral Image Analysis group and the NSF-funded Centre for Airborne Laser Mapping (NCALM) at the University of Houston for providing the data sets used in this study and the IEEE GRSS Data Fusion Technical Committee for organising the 2013 Data Fusion Contest.
REFERENCES
G.Simone, A.Farina, F.C.Morabito, S.B.Serpico and
L.Bruzzone. “Image Fusion Techniques For Remote Sensing Applications”, Technical Report # DIT-02-0025, Also: appeared on Information Fusion, Vol. 3, No. 2, March 2002
Esteban, J., Starr, A., Willetts, R., Hannah, P. and
Bryanston-Cross, P. (2004), “A review of data fusion models and architectures: Towards engineering guidelines,” Journal of
Neural Computing and application, 14(4), pp. 273-281.
Pohl, C. and Van Jenderen, J.L. (1998), “Review article Multi sensor image fusion in remote sensing: concepts, methods and applications,” International Journal of Remote Sensing, 19(5),
pp. 823-854.
Du, P., Liu, S., Xia, J., Zhao, Y., 2013. “Information fusion techniques for change detection from multi temporal remote sensing images”. Information Fusion, 14(1), 19-27.
Dong, J., Zhuang, D., Huang, Y., Fu, J., 2009. “Advances in Multi-Sensor Data Fusion: Algorithms and Applications.”
Journal of Sensors, 9(10), 7771-7784.
Yun, Z., 2004. Understanding image fusion. Photogrammetry Engineering and Remote Sensing, 6(1), 657–661.
Roessner, S., Segl, K, Heiden, U., Kaufmann, H. (2001):
Automated differentiation of urban surfaces based on airborne hyperspectral imagery. IEEE Transactions on Geosciences and Remote Sensing, Vol. 39, No. 7, 1525-1532.
Segl, K., Roessner, S., Heiden, U., Kaufmann, H. (2003):
Heiden, U., Segl, K., Roessner, S., and Kaufmann, H. (2007).
Determination of robust spectral features for identification of urban surface materials in hyperspectral remote sensing data. Remote Sensing of Environment, Elsevier, 111, 537-552.
Simental, E., Ragsdale, D. J., Bosch, E., Dodge, R., Jr., and Pazak, R., “Hyperspectral dimension reduction and elevation data for supervised image classification,” in Proc. 14th ASPRS
Conf., Anchorage, AK, May 3-9, 2003.
Lemp, D. and Weidner, U., “Improvements of roof surface classification using hyperspectral and laser scanning data,” in
Proc. ISPRS Joint Conf.: 3rd Int. Symp. Remote Sens. Data Fusion Over Urban Areas (URBAN), 5th Int. Symp. Remote Sens. Urban Areas (URS), Tempe, AZ, Mar. 14–16, 2005.
Dalponte, M., Bruzzone, M., Gianelle, D., “Fusion of Hyperspectral and LIDAR Remote Sensing Data for Classification of Complex Forest Areas,” IEEE Trans. Geosci.
Remote Sens., vol. 46, no. 5, pp. 1416–1427, May 2008.
Zhao, B., Zhong, Y., Zhao, J. and Zhang L. (2013), Outcome of
the “Best Classification Challenge” of the 2013 IEEE GRSS
Data Fusion Contest.
Haralick, R., Shanmugam, K., Dinstein, I. (1973). “Textural Features for Image Classification”, IEEE Trans. on Systems,
Man and Cybernetics, SMC–3(6), pp.610–621.
J.A. Richards, “Remote sensing digital image analysis: An
introduction.” Springer-Verlag, Berlin, Germany, 1999.
Bigdeli, B., Samadzadegan, F.,Reinartz, P. (2013). “A Multiple SVM System for Classification of Hyperspectral Remote Sensing Data.” Journal of Indian Society of Remote Sensing. Vol. 41, No.4, PP: 763-776.
Bigdeli, B., Samadzadegan, F., Reinartz, P. (2014). “A feature
grouping based multiple fuzzy classifier system for fusion of
hyperspectral and LIDAR data,” Journal of Applied Remote