FUNDAÇÃO GETULIO VARGAS
ESCOLA BRASILEIRA DE ADMINISTRAÇÃO PÚBLICA E DE EMPRESAS MESTRADO EXECUTIVO EM GESTÃO EMPRESARIAL
A MEDIA AND ENTERTAINMENT COLOSSUS
-THE ACQUISITION OF 21
STCENTURY FOX BY THE WALT DISNEY
COMPANY
DISSERTAÇÃO APRESENTADA À ESCOLA BRASILEIRA DE ADMINISTRAÇÃO PÚBLICA E DE
EMPRESAS PARA OBTENÇÃO DO GRAU DE MESTRE
MARIUS PETER KRAFCZYK
MARIUS PETER KRAFCZYK
DR. PATRICK GOTTFRIED BEHR
Rio de Janeiro
2019
Master’s thesis presented to Católica-Lisbon-FGV
EBAPE Double Degree Program, Escola Brasileira de
Administração Pública e de Empresea, Fundação Getulio
Vargas, as a requirement for obtaining the title of
Executive Master’s in Business Adminstration
A MEDIA AND ENTERTAINMENT COLOSSUS
-THE ACQUISITION OF 21
STCENTURY FOX BY THE
Ficha catalográfica elaborada pelo Sistema de Bibliotecas/FGV
Krafczyk, Marius Peter
A media and entertainment colossus : the acquisition of 21st Century Fox by by The Walt Disney Company / Marius Peter Krafczyk. – 2019.
96 f.
Dissertação (mestrado) - Escola Brasileira de Administração Pública e de Empresas, Centro de Formação Acadêmica e Pesquisa.
Orientador: Patrick Gottfried Behr. Inclui bibliografia.
1. Empresas – Fusão e incorporação – Estudo de casos. 2. Tecnologia Streaming (Telecomunicação). 3. Comportamento do consumidor. 4. Wall Disney Company. I. Behr, Patrick Gottfried. II. Escola Brasileira de Adminis- tração Pública e de Empresas. Centro de Formação Acadêmica e Pesquisa. III. Título.
CDD – 658.16
Acknowledgement
I dedicate this work to my dear friend Tony for giving me strengths in all the stressful times and reminding me that life is only a breath away.
Additional, to my former best friend JBT who taught me that self-reflection is a mental ability towards reincarnation.
Abstract
Purpose – The purpose of this thesis is to investigate the acquisition of 21st Century Fox by The Walt Disney Company. The focus lies on the rationale behind Disney’s motivation to acquire its competitor. In order to answer the question, the thesis aims to answer three preliminary questions: (1) What are the strategic drivers behind the acquisition? (2) What are the financial drivers behind the acquisition? (3) What are the impacts on the media & entertainment industry by the transaction?
Design/methodology – The design of the dissertation is a case study, as the paper aims to determine
the exploration and description of an event. The primary source of information is secondary and it consists of qualitative and quantitative research. For the qualitative research an expert interview was conducted and a content analysis of data, gathered from secondary research. For the quantitative analysis, annual reports and database were examined in order to conduct a financial valuation using the discounted cash flow method and the relative valuation method.
Findings – It was found that the rising strength of over-the-top content service providers like
Netflix are threatening the traditional business of media companies like Disney. Disney tries to mitigate the threat of transforming streamers by entering the direct-to-consumer market with its own service, Disney+. It then wants to leverage Fox’s brands to build brand affinity and cross-monetize them. In addition, Disney’s market power in the traditional business enhances, due to the consolidated market share and Disney was valuing Fox higher than the market. Therefore, the transaction supports Disney’s entry into a new market and strengthens the current market position.
Practical implications – The dissertation closes a knowledge gap, since no study was released
regarding the selected topic. It now serves as a teaching material for lectures that cover mergers and acquisitions, as well as identifies the lack of intellectual property valuation in financial analyses. Lastly, it serves as an information paper for investors who consider to invest in Disney shares.
Keywords: over-the-top, direct-to-consumer, monetization, market power, company valuation Paper Category: Case study, Master’s thesis
Resumo
Objetivo - O objetivo desta tese é investigar a aquisição da 21st Century Fox pela The Walt Disney
Company. O foco está na lógica por trás da motivação da Disney para adquirir seu concorrente. Para responder à pergunta, a tese visa responder a três questões preliminares: (1) Quais são os fatores estratégicos por trás da aquisição? (2) Quais são os fatores financeiros por trás da aquisição? (3) Quais são os impactos no setor de mídia e entretenimento pela transação?
Metodologia - O design da dissertação é um estudo de caso, pois o trabalho visa determinar a
exploração e descrição de um evento. A fonte primária de informação é secundária e consiste em pesquisa qualitativa e quantitativa. Para a pesquisa qualitativa, foi realizada uma entrevista com especialistas e uma análise de conteúdo dos dados, coletada em pesquisas secundárias. Para a análise quantitativa, foram examinados relatórios anuais e banco de dados, a fim de realizar uma avaliação financeira utilizando o método de fluxo de caixa descontado e o método de avaliação relativa.
Resultados - Verificou-se que a crescente força de provedores de serviços de conteúdo exagerados,
como a Netflix, está ameaçando os negócios tradicionais de empresas de mídia como a Disney. A Disney tenta mitigar a ameaça de transformar serpentinas entrando no mercado direto ao consumidor com seu próprio serviço, Disney +. Em seguida, deseja aproveitar as marcas da Fox para criar afinidade com a marca e gerar receita monetária cruzada. Além disso, o poder de mercado da Disney nos negócios tradicionais aumenta, devido à participação consolidada no mercado e a Disney estava avaliando a Fox mais alto que o mercado. Portanto, a transação suporta a entrada da Disney em um novo mercado e fortalece a posição atual do mercado.
Contribuições práticas - A dissertação preenche uma lacuna de conhecimento, uma vez que não
foram divulgados estudos sobre o tema selecionado. Agora, serve como material de ensino para palestras que cobrem fusões e aquisições, além de identificar a falta de avaliação da propriedade intelectual nas análises financeiras. Por fim, serve como um documento informativo para investidores que consideram investir em ações da Disney.
Palavras-chave: exagerada, direta ao consumidor, monetização, poder de mercado, avaliação de
empresas
List of Abbreviations
Disney The Walt Disney Company
21CF 21st Century Fox
FOX 21st Century Fox
AVOD Ad-based Video on Demand
AI Artificial Intelligence
AR Artificial Intelligence
CAPEX Capital Expenditures
CAPM Capital Asset Pricing Model
CEO Chief Executive Officer
COS Cost of Services
DCF Discounted Cash Flows
DTC Direct to consumer
EBIT Earnings before Interest and taxes
EBITDA Earnings before interest, tax, depreciation and amortization
EV Enterprise Value
FCF Free Cash Flow
FCFF Free Cash Flow to the Firm
GDP Gross Domestic Product
IP Intellectual Property
M&A Mergers and Acquisition
M&E Media and Entertainment
OTT Over the top
P/B Price-to-Book
P/E Price-to-Earnings
P/S Price-to-Sales
SVOD Subscription Video on Demand
TV Terminal Value
TVOD Transactional Video on Demand
VOD Video on Demand
VR Virtual Reality
Table of Content
1 Introduction ... 1
1.1 Contextualization ... 1
1.2 Justification of the Theme Selection ... 3
1.3 Structure of the paper ... 3
2 Problem to be discussed ... 4
2.1 Research Questions ... 4
2.2 Definition of the Problem’s Limits... 4
3 Literature Review ... 5
3.1 Mergers and Acquisition ... 5
3.1.1 Types of M&A ... 5
3.1.2 The Reasons for M&A: Synergies ... 6
3.2 Valuation Techniques ... 8
3.2.1 Discounted Cash Flow (DCF) Valuation ... 9
3.2.1.1 Weighted Average Cost of Capital ...10
3.2.1.2 Cost of Equity ...10
3.2.1.3 Beta ...11
3.2.1.4 Cost of Debt ...11
3.2.1.5 Terminal Value and Growth Rate ...12
3.2.2 Relative Valuation ...12 4 Research Method ...13 4.1 Data Collection ...13 4.2 Data Treatment ...14 4.3 Method Limitation ...15 5 Strategic Analysis ...16
5.1 Analysis of the Media and Entertainment Industry ...16
5.1.1 Overview ...18 5.1.2 Current Performance ...20 5.1.3 Future trends ...21 5.1.4 Film Segment ...22 5.1.5 TV Segment ...25 5.1.6 Over-The-Top Platform ...26
5.1.7 Direct-to-Consumer ...31
5.2 Company Profiles ...32
5.2.1 21st Century Fox ...32
5.2.2 The Walt Disney Company ...34
5.2.2.1 Disney+ ...36
5.2.2.2 Disney’s Vertical Monetization Model ...37
5.3 Strategic Drivers ...38
6 Financial Analysis ...40
6.1 Key Financial Analysis ...40
6.1.1 Disney ...40
6.1.2 21st Century Fox ...42
6.2 Valuation of 21st Century Fox ...44
6.2.1 DCF Valuation ...44
6.2.2 Relative Valuation ...50
6.2.3 Summary of Valuation ...52
7 Impact on the Media and Entertainment Industry ...53
7.1 Market Structure ...53
7.2 Work Force ...54
7.3 Distributors ...54
7.4 Content variety ...55
7.5 OTT Market Fragmentation ...56
7.6 Competition ...57
8 Conclusion ...59
8.1 Summary of results ...59
8.2 Limitations ...61
8.3 Recommendation for Further Research ...62
Appendix ...64
List of Tables
Table 1 Overview of the Valuation Methods ... 9
Table 2 Historical Revenue of Fox (2014-2018) ... 44
Table 3 Projected Revenue of Fox (2019-2023) ... 46
Table 4 Projected Operating Expense (2019-2023) ... 46
Table 5 Projected D&A and Capex of Fox (2019-2023)... 47
Table 6 Projected FCFF & Terminal Value of Fox (2019-2023) ... 48
Table 7 Fox's Beta Calculation ... 49
Table 8 Fox's WACC and Capital Structure ... 49
Table 10 Fox's Discounted FCFF and Enterprise Value ... 50
Table 11 Sensitivity Analysis ... 50
Table 12 Multiple Valuation of Fox ... 51
Table 13 Summary of Fox Valuation ... 52
List of Figures
Figure 1 Real GDP growth - Annual percent change ... 17Figure 2 Consumer Confidence Index ... 18
Figure 3 Main competitors ranked by revenues in 2018 ... 21
Figure 4 Average cinema ticket price and numbers of tickets sold (1995-2018) ... 23
Figure 5 Total Box office & total inflation-adjusted box office (1995-2018)... 23
Figure 6 US film market share by Top 6 parenting company ... 24
Figure 7 Comparison of market share by OTT type in 2017 vs. 2023 (forecasted) ... 27
Figure 8 Global OTT revenue ... 28
Figure 9 Number of global subscribers by major US SVOD platforms ... 29
Figure 10 Content spending by major US SVOD platforms ... 30
Figure 12 Disney's Net Revenues by Segment (in billion) ... 42
1 Introduction
1.1 Contextualization
Digitization. A strong and broad word that is having a large influence on life and businesses. Disruptive technologies have transformed entire industries in the past decade. Physical retail stores became nearly obsolete once Amazon made its move into the industry, Airbnb is surely the most envied company by Hotels and the videos of Uber drivers being attacked by taxi drivers went viral. These disruptors have established their leading role through customer interaction, profiling the consumers and offering the best user experience. The common factor that all of these companies inhabit, is their business model. They all are platforms that allow high customer interaction. Once companies established a large customer base and great brand awareness, they move into new markets. Amazon moved into the cloud computing service and Uber into food delivery. However, since some industries have high entry barriers, companies use a different tool – mergers and acquisitions (M&A). However, entering an industry is not the only rationale for such transactions. Corporations of diverse sizes and industries are also constantly attempting to maintain their position in the industry. They intend to achieve an economic benefit through these deals. Meaning, the goal of an M&A is to generate increased shareholder value by combining the two companies into one larger firm. For the management, it is crucial to decide the amount they are willing to pay for the acquired firm and when to announce it. Failing to identify the adequate price can cause a loss of the deal or potential financial distress.
The same phenomena is occurring in the media and entertainment (M&E) industry. Currently, the industry is experiencing a new convergence, which is the main driver for the large numbers of global M&As (Baker & Barbaglia, 2018). The sector is riding on a wave of consolidation triggered by disrupting technologies. In the past two years, three mega-mergers were announced and completed, which will shake the foundations of the industry. The mighty telephone giant AT&T won the fight with the U.S. government court regarding the acquisition of Time Warner’s content bundle, consisting of HBO, Warner Bros, and Turner Broadcasting. The bidding war for 21st Century Fox between the Walt Disney Company and Comcast ended in a $71.3 billion Disney-Fox transaction and a $39 billion takeover of Sky by Comcast. However, these transactions were not the only ones and are likely not to be the last. Nonetheless, what caused all the tumult and the urge
to react now? As similar to other industries, the M&E industry is threatened by the four horsemen of the digital apocalypse: Apple, Google, Amazon, and Netflix. Especially the last two global platforms became legitimate competitors that are now applying pressure on the traditional media companies, driving the need for scale and differentiation. However, to understand the rationale behind consolidation, one of the largest transactions in the past years will be analyzed. While the AT&T-Time Warner was a vertical transaction, the horizontal Disney-Fox deal will provide better details for the rationale and the impact on the industry.
On December 14, 2017, The Walt Disney Company announced to acquire 21st Century Fox for $52.4 billion in stock (The Walt Disney Company, 2017b). It stated that it would buy 21st Century Fox film and TV studios, cable networks including Fox Networks, Fox Sports Regional Networks, and Fox’s international networks. Further, it would acquire Indian satellite TV group Star India, an additional 30% stake in Hulu and other assets. However, 21st Century Fox would spin off Fox
Broadcasting network into the “Fox Corporation” company (The Walt Disney Company, 2017b). The reason behind the spinoff is that Disney owns the American Broadcasting Company (ABC) and the merger with the Fox Broadcasting Company would be illegal under the FCC’s rule, which prohibits a merger of two major broadcast networks (Johnson, 2017). Fox Corporation will also comprise of the following business units: Fox Television Stations, Fox News Channel, Fox Business Network and Fox Sports Media Group (The Walt Disney Company, 2017b). On June 12, 2018, Comcast offered a counter-bid of $65 billion for 21st Century Fox assets (Welch, 2018). However, eight days later Disney and Fox announced that they had improved their previous deal, increasing Disney’s offer to $71.3 billion. It outbids the offer of Comcast with a 10% premium and offers shareholders the option to receive cash instead of stock (The Walt Disney Company, 2018b). At the end of June 2018, the US Department of Justice gave antitrust approval to the merger agreement (Bartz & Shepardson, 2018). On July 19, 2018, Comcast announced that it would not pursue further to acquire Fox assets but to focus on bidding for Sky (Comcast, 2018a). Shortly after, the shareholders of both Disney and Fox approved the acquisition (The Walt Disney Company, 2018c). The deal still needed to go through many commissions and regulators, while on October 9, 2018, Comcast completed the acquisition of Sky for $39 billion (Comcast, 2018b). The acquisition was finalized on March 20, 2019, in which 51.57% of the shareholders elected to receive cash, 36.65% chose Disney shares and 11.79% failed to make an election (The Walt Disney Company, 2019a).
1.2 Justification of the Theme Selection
The dissertation, with the chosen topic of the acquisition of 21st Century Fox by the Walt Disney Company, is of relevance in three aspects, which can be grouped in two dimensions: academic and practical relevance.
First, and most important, is the academic relevance, since the dissertation will create academic value by generating new knowledge that will be available to the public. Currently, there are no studies available regarding this topic since the deal only was completed in March 2019. Therefore, a knowledge gap is existing that would be closed by the dissertation. The second aspect enacts as a hybrid of the two dimensions. The dissertation could be used as teaching material for lectures at universities that cover Mergers and Acquisitions. Hereby, it acts as a teaching note for the professor. Therefore, the dissertation teaches students new academic knowledge by simultaneously allowing them to put the knowledge in practice. Lastly, the dissertation will be from personal relevance. I am highly interested in the topic M&A, as I am seeking a career inside this corporate development/ management area. Thus, the topic will allow me to deepen my knowledge and to gather first practical experiences that will be of high value for my future career.
1.3 Structure of the paper
Following this chapter, the main research question is stated with its three underlying sub-questions. The sub-questions will act as guidance towards the main question. Once the main research question is established, a theoretical framework is created to provide basic knowledge regarding the selected theme. This is crucial since basic knowledge of the area is required in order to follow the logic of the analysis and its reasoning. However, before the analysis is conducted, the research method is presented. It shows on which scientific methodology the analysis is based. Further, the analysis follows, which is divided into three sections. First, the two companies and the industry they inhabit are analyzed. Based on this, strategic reasoning will be drawn. Second, the financial analysis of the acquired firm is done in order to understand the rationale from a financial point of view. Lastly, the impact of the transaction in the industry is mentioned. Consequently, these three sections will provide the basis for concluding the research question before a few recommendations for further research are given.
2 Problem to be discussed
2.1 Research Questions
The objective of this dissertation is to understand the decision of the Walt Disney Company to acquire 21st Century Fox. The main research question is the following:
Why is the Walt Disney Company acquiring its competitor 21st Century Fox?
Therefore, the dissertation answers three preliminary questions that provide support to answer the main research question:
What are the strategic drivers behind the acquisition? What are the financial drivers behind the acquisition?
What are the impacts on the media & entertainment industry by the transaction?
First, the media and entertainment industry is analyzed to understand the current consumer trends and possible disruptors that need to be anticipated by the companies to ensure their competitiveness. Further, an overview of the two companies is provided including an analysis of the key financial indicators. Moreover, The Walt Disney Company’s strategic aim to execute is identified. Second, a valuation of 21st Century Fox is conducted by using the multiple and discounted cash flow valuation technique. Third, the dissertation will identify and present the effects the M&A deal might have on the industry.
2.2 Definition of the Problem’s Limits
The first limit of the problem is the scope of the research. Since the paper wants to identify the reasons behind the M&A deal, it will only focus on the strategic and financial part of the rationale. However, in such a transaction there are much more factors taking part which are not even known to the public. Second, the third sub question will be answered by assumption, since no one knows how this transaction will change the industry. It is possible that the assumptions made are not becoming true or do not apply to this industry. However, since no one knows how the impact will
be, assumptions are allowed to make and are necessary to be made in order to anticipate possible issues or opportunities. The US Department of Justice also had to make assumptions, in order to give antitrust approval.
3 Literature Review
3.1 Mergers and Acquisition
There are only a few decisions for managers that carry as much risk to the shareholder as a large acquisition. According to Sirower and Sahni (2006), M&A announcements have generally a negative impact on the stock value of a company as the investors are skeptical that the transaction will generate value for the acquiring company. More specifically, investors doubt that the synergies implied in the premium paid will be achieved and that the value of each company will be sustained or enlarged in the consolidated company. Furthermore, failed mergers are costly and difficult to undo, meaning once the damage is done, the merger is irreversible.
Therefore, this chapter is explaining the rationale behind M&A, if and how these transactions can increase the value for shareholders. Following, the transaction types involved in M&A deals are explored.
3.1.1 Types of M&A
Ross et. al (2003) indicate two different classifications to identify types of M&A – legal procedures and the typical financial analysts’ classification.
The legal procedures category is sub-divided into three different transactions:
Merger and Consolidation – In a merger, the buying company takes over the target company, including all the assets and liabilities. In a consolidation, a new legal entity is formed, combining both companies into one. Both transactions require the approval by the shareholders of both companies involved, most commonly by the majority (2/3) of the voting shares.
Acquisition of Stock – The buying company makes an offer for the acquiree’s stocks. Commonly, this deal is conducted through a tender offer, in which the acquirer makes a public offer to the shareholders of the target firm. The shareholders then have the right to decide whether to sell the shares or not, making it difficult for the acquirer to buy the entire company.
Acquisition of Assets – The company buys all the assets from the target company which was involved in the offer. This deal needs the approval of the shareholders and the transfer of ownership can be costly.
Damodaran (2002) adds a further classification to the above mentioned legal procedures type. The classification refers to a deal when a company is not bought by another one, but rather, by its own management team (Management Buyout) or by investors, on the basis of a high level of debt (Leverage Buyout)
The typical financial analysts’ classification explains that the deals are sub-divided in the following characteristics:
Horizontal Acquisition – Refers to a transaction in which both the acquirer and acquire are settled in the same industry, competing with similar products.
Vertical Acquisition – The firms included in the deal are from a different stage in the value chain. For example, a firm buys its supplier or distributor.
Conglomerate Acquisition – The companies included in the deal are not competing in the same industry. Mostly used to diversify the risk.
3.1.2 The Reasons for M&A: Synergies
Synergies are seen as one of the main driving forces for M&A deals. It is the concept in which the value of the two merged companies will be larger than the sum of the two individual companies (Investopedia, 2018a). In fact, according to a survey, the most responsive strategic reason for an M&A transaction was to increase the scale and market share (84%) of the company (EY, 2014).
Damodaran (2005) suggests that synergies can be grouped into two groups. Operating synergies affect the corporate operation of the consolidated company and include operational benefits such as economies of scale, improved pricing power, and higher growth potential. Contrariwise, financial synergies are more specific. They include tax benefits, diversification and use for excess cash.
Operating synergies
The aim of those synergies is to generate a higher operating income from existing assets or increased growth. There are four synergies types:
Economies of scale – This refers to a cost advantage the combined firm obtains due to the increased scale of the firm. This mostly occurs in horizontal mergers
Greater pricing power – Results from the diminished competition and increased market share, which generally leads to an increased margin and operating income
Combination of different functional strengths – Represents the vertical acquisition in which a firm acquires a firm that is specialized in a different stage of the value chain. This type of synergy can be applied to multiple mergers, as the functional strength can be translated across industries
Higher growth in new or existing markets – Mostly used to enter a new market by using the established company as a stepping stone to increase sales of its own product
Financial Synergy
The result of those synergies is to increase the cash flows, reduce the discount rate (cost of capital) or both in combination. The following are included in the financial synergies:
Win-Win combination – The combination of a firm that has cash available but no investment opportunities and a firm with limited cash but high-return projects can generate higher value. The value can be generated by using the stored cash to invest in projects. This synergy is mostly seen if a large company acquires a small company (start-up).
Increased debt capacity – The consolidated firm may become more stable and therefore cash flows could be more predictable. Resulting in banks that are more willing to fund the
company a larger credit than the two individual companies would have received. Money is saved on taxes due to the lower cost of capital.
Tax benefits – Companies acquire other firms to take advantage of the tax laws that provide them with money saving opportunities. A company can shelter its income by acquiring a loss-making company to use its net operating losses to reduce the tax burden. On the other hand, a company can increase its depreciation charges by writing up the target company’s assets. Consequently, the company will save money on taxes and increase its value. Diversification – It relates to the spread of the risk by operating in multiple segments. These
segments are mostly not related, meaning that different factors influence them
After understanding the types of synergies, it is crucial for the management to avoid common errors in valuing synergies, i.e. using a wrong discount rate. The company needs to determine the value of the target company and potential synergy and to decide how much they are willing to pay for it. After the company understands which forms of synergies are expected, it needs to identify when the synergies have a positive effect on cash flows (Damodaran, 2005). According to Ficery et. al (2007), the most common error is that the synergy scope is wrongly understood and that the timing for synergy opportunities are missed. Since synergies generate the most value during the first year of the combined firm, companies need to pay special attention to capture the value during the first year. Going back to understand the value of synergy, Damodaran (2005) suggests three steps to estimate the value: conduct a standalone valuation of both companies, estimate the combined value without synergy, and calculate the value of the combined firm with synergy. Lastly, the estimate of the consolidated firm without synergies needs to be deducted from the estimate of the combined firm with synergies, to understand if the merger is profitable. Nonetheless, estimating the synergies is out of scope for this study, as it would require information unknown to the public.
3.2 Valuation Techniques
Several valuation techniques can be used to estimate the value of a company. Each approach has different purposes and difficulties. According to Damodaran (2002), valuation is relevant in three cases. First, valuation is a tool for investors that want to create an investment portfolio. Through
valuing companies, they are able to identify investment opportunities. Second, valuation can be used from a business point of view in corporate finance. Since the goal of a firm is to maximize its value, valuation can help to identify the right investments and on how to finance them. Third, it is used in analyzing acquisition opportunities. Thus, valuing a company is crucial in an M&A transaction, but there are different approaches.
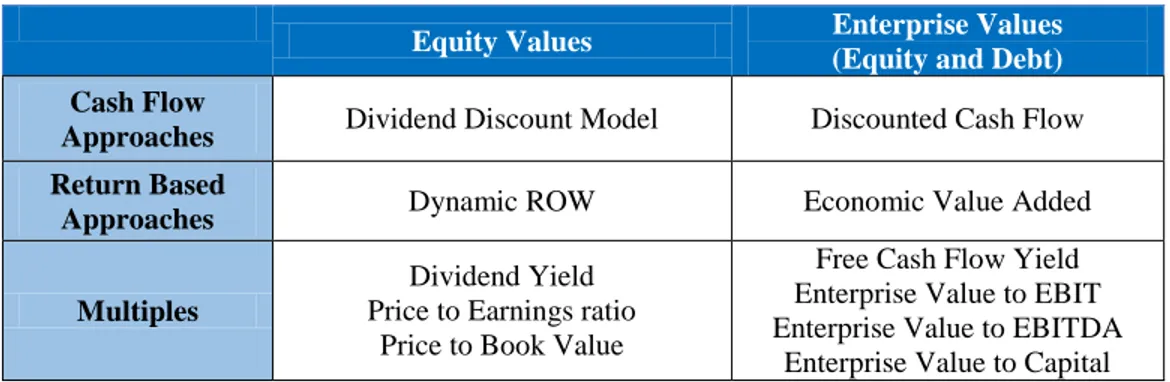
Table 1 Overview of the Valuation Methods
Equity Values Enterprise Values (Equity and Debt)
Cash Flow
Approaches Dividend Discount Model Discounted Cash Flow
Return Based
Approaches Dynamic ROW Economic Value Added
Multiples
Dividend Yield Price to Earnings ratio
Price to Book Value
Free Cash Flow Yield Enterprise Value to EBIT Enterprise Value to EBITDA
Enterprise Value to Capital
Source: Young, et al., 1999
Per Young, et al. (1999), the valuation can be divided into two sections, one focusing on equity value and the other on enterprise value. In addition, it exists three approaches that focus either on the value of the assets (cash flow), the capital stock (return based) or on a comparison with competitors (multiples). However, Kaplan and Ruback (1996) found that the best results, regarding valuing a company, were achieved by using the DCF based valuation and the multiple methods together. Thus, these are the chosen techniques to value 21st Century Fox.
3.2.1 Discounted Cash Flow (DCF) Valuation
The DCF valuation can be split into two parts. The valuation starts with projecting the future cash flow of a firm, based on assumptions that are related to a substantial industry analysis. Then the projected cash flows are discounted at a risk-adjusted rate to compute the present value.
𝐸𝑛𝑡𝑒𝑟𝑝𝑟𝑖𝑠𝑒 𝑉𝑎𝑙𝑢𝑒 = ∑ 𝐹𝐶𝐹𝐹𝑡 (1 + 𝑊𝐴𝐶𝐶)+ 𝑇𝑒𝑟𝑚𝑖𝑛𝑎𝑙 𝑉𝑎𝑙𝑢𝑒 (1 + 𝑊𝐴𝐶𝐶)𝑛 𝑛 𝑡=1
The Free Cash Flow to the Firm (FCFF) includes the funds that were generated by the company after paying expenses, taxes and reinvestment needs, but post interest expenses and dividends. The
remaining funds will then be allocated to equity and debt-holders. According to Luehrman (1997), FCFF is given by:
𝐹𝐶𝐹𝐹 = 𝐸𝐵𝐼𝑇 ∗ (1 − 𝑇𝑎𝑥) − 𝐶𝑎𝑝𝐸𝑥 − 𝐶ℎ𝑎𝑛𝑔𝑒𝑠 𝑖𝑛 𝑁𝑒𝑡 𝑊𝑜𝑟𝑘𝑖𝑛𝑔 𝐶𝑎𝑝𝑖𝑡𝑎𝑙 + 𝐷𝑒𝑝𝑟𝑒𝑐𝑖𝑎𝑡𝑖𝑜𝑛 𝑎𝑛𝑑 𝐴𝑚𝑜𝑟𝑡𝑖𝑧𝑎𝑡𝑖𝑜𝑛
3.2.1.1 Weighted Average Cost of Capital
The WACC includes all the financial effects, explicitly any benefits or costs connected with the firm’s leverage in terms of capital structure. Using WACC as a discount rate allows accounting for the overheads of different financing sources, which are proportionally weighted to the contribution to the company’s capital structure. Thus, the WACC represents the average rate of return required by equity holders (𝑅𝐸) and debtholders (𝑅𝐷) (Koller et al., 2010).
𝑊𝐴𝐶𝐶 =𝐷
𝑉𝑅𝐷(1 − 𝑇𝐶) + 𝐸 𝑉𝑅𝐸
D = market value of debt E = market value of equity V = E+D
𝑅𝐷 = required rate of return on debt
𝑅𝐸 = required rate of return on equity
𝑇𝐶 = corporate tax rate
The WACC equation comprises of three parts: the cost of equity, the cost of debt and the capital structure. The most popular method to calculate the cost of equity is the capital asset pricing model (CAPM), which requires data on the company’s beta, the risk-free rate, and the market risk premium. The cost of debt requires knowledge about the marginal tax rate and the default spread of the company. Lastly, the capital structure is the proportion of finances to debt and equity.
3.2.1.2 Cost of Equity
Equity shareholders invest in a company with the expectation to receive a certain return on their financial contributions. The cost of equity represents this required rate of return so that the investor is willing to purchase the shares of the company. Per Koller et al. (2010), the previously introduced CAPM is one of the best methods to calculate the cost of equity:
𝑅𝐸 = 𝑟𝑓+ 𝛽(𝑟𝑚− 𝑟𝑓)
Where the 𝑅𝐸 is the required rate of return on equity, 𝑟𝑓 the risk-free rate, 𝛽 is the systematic risk of the company and 𝑟𝑚 the expected market return.
3.2.1.3 Beta
The beta (𝛽) assesses the systematic risk of an investment in comparison to the market. In short, it estimates how volatile a stock is compared to the general market. Damodaran (2002) suggests to calculate beta with the bottom-up method. The method starts with identifying the business segments and industries in which the company operates and then choose comparable publicly traded companies. Then the beta of each firm is obtained and the average beta of the firms is unlevered by the mean debt to equity ratio.
𝛽𝑈 =
𝛽𝐿
1 + (1 − 𝑇𝐶) ∗ 𝐷𝐸
Once the unlevered beta (𝛽𝑈) is obtained, the beta needs to be re-levered by using the target debt to equity ratio and the targeted tax rate. Resulting in the levered beta (𝛽𝐿) of the firm.
𝛽𝐿 = 𝛽𝑈∗ [1 + (1 − 𝑇𝐶) ∗𝐷 𝐸]
3.2.1.4 Cost of Debt
The cost of debt is the essential rate required from debtholders in order for them to provide the funding. Thus, the cost of debt assesses the cost rate the corporation needs to pay on its current liabilities to its debtholders (Damodaran, 2002). It includes three elements: the risk-free rate, the default risk, and the tax rate. If companies do not trade regularly their credit ratings and linked default spread can be utilized to calculate the cost of debt.
3.2.1.5 Terminal Value and Growth Rate
The last required piece is the terminal value and the expected growth rate. Since it is difficult to forecast the cash flows over a larger period, a terminal value is used (Copeland, Koller, & Murrin, 2000). The terminal value is the final cash flow calculated under the assumption that it grows at a steady nominal rate at perpetuity (Kaplan & Ruback, 1996). According to Damodaran (2002), considering a stable growth model, the terminal value can be computed as follow:
𝑇𝑒𝑟𝑚𝑖𝑛𝑎𝑙 𝑉𝑎𝑙𝑢𝑒 = 𝐹𝐶𝐹𝐹𝑡+1 𝑊𝐴𝐶𝐶 − 𝑔
Either the stable growth rate (g) can be equal or less than the growth rate of the economy in which the company operates (Damodaran, 2002). Therefore, a common practice is to use the expected real or nominal GDP growth rate of the economy. Moreover, in stable growth, it is suggested to hold capital expenditures equal to depreciation (Kaplan & Ruback, 1996).
3.2.2 Relative Valuation
In this method, a company’s value is derived from the comparison of similar companies in the market by using typical variables such as sales, profits, or cash flows (Damodaran, 2002). These multiples can be grouped into two groups. First, the market multiples that use relative valuation metrics of similar firms. Second, transaction multiples that use recent deals of the peer group to reach the valuation. However, the latter will not be used as no information is available on past transactions.
Thus, several multiples can be computed as for instance price-to-earnings ratio, price-to-book value, and enterprise-value-to-EBITDA ratio. If price multiples are used, one estimates the market value of the company. On the other hand, if one uses the enterprise value multiples, the enterprise value is estimated.
According to Damodaran (2002), some of the more frequent multiples are the following:
Enterprise-value-to-sales ratio Enterprise-value-to-EBITDA
Price-earnings ratio Price-to-book ratio Price-to-sales ration
Calculating the multiples is simple and therefore the valuation of the firm can be easily concluded. However, the largest challenge is to define the peer group. Meaning, which firms in the market should be used, to compare with the one which is being valued. Kaplan and Ruback (1996) indicate one determinant for the peer group: comparable company, in which trading values of companies in the same ecosystem are used to calculate the multiple.
4 Research Method
The following chapter defines the method of research used to collect information related to the research topic. Furthermore, this chapter also describes the basis of the research and details how several research tools are used. The methodology of research portrays a well-defined structure and contributes to gathering the information for the following research. The period in which the thesis will be written is from February to May 2019.
4.1 Data Collection
The most appropriate form of research for this topic is to conduct a case study research since the study does not aim to determine the cause and effect but rather the exploration and description of an event. The main characteristics of a case study research are that it is specially focused, offers a high-level of detail, and is able to consolidate both objective and subjective data to accomplish a deeper understanding. This case study will follow the characteristics of an illustrative study, as it describes an event so that people not specialized in the topic can use this study to become familiar with the terminology related to the topic (GCU, 2018).
Most researches are divided into two categories namely qualitative and quantitative. Qualitative research is used to gather information which is rich in information and easily understandable. It also provides an understanding of the problem and supports the developing of hypotheses for
further quantitative research. On the other hand, quantitative research is used to gather information in the form of numerical data, which then can be summarized into statistics. Generally, quantitative research results from a large sample population. This study will be a mixture of both. The qualitative research will explain the concepts, compare several valuation methods and examine the valuation process. Furthermore, it is needed to conduct an industry analysis. The quantitative research is applied by forecasting financial performance and convert these financial performances into value.
Therefore, the primary source of information is secondary. Information related to qualitative research is gathered by previous researches and available reports to conduct the industry analysis. The financial data, needed for the quantitative research, is extracted from the annual reports of both companies and will be the foundation for the analysis. In addition, market data and further financial data are collected from websites such as Damodaran Online and Thomson Reuters Eikon. It is important to mention that data, which is used, is dated to September 2018 in order to avoid biases from the transaction. In order to gain primary research, the researcher tried to contact both companies in order to gain first-hand insights but was not able to secure an interview. In addition, employees of companies were contacted since an existing network exist. However, none was willing to give an interview even with the possibility to stay anonymous. The next steps were to contact financial advisors and analysts. However, due to company policies, they were not allowed to conduct interviews regarding clients of them. Thus, an independent journalist and film critic was interviewed, as he is an expert in the industry and shows great knowledge based on his profession.
4.2 Data Treatment
For the qualitative part of the dissertation, which relates to sub-question 1 and 2, the data will be analyzed by using content analysis. First, the data is organized and collected. Then a possible framework is identified and the data is sort into the framework. Lastly, the result can be analyzed.
As mentioned earlier, the method for the quantitative part of the dissertation is the discounted cash flow (DCF) method and the relative valuation method. To use these techniques, one needs the forecasted free cash flow to the firm (FCFF) and the weighted average cost of capital (WACC). To derive to the FCFF the research will use a financial model which is built on the basis of the data
provided in the companies’ financial statements. This model will be divided into three parts: input, breakdown, and forecast. Inside the input section, the financials are simply being replicated. The breakdown section is concerned with the most important elements of the financial statements, such as revenue, depreciation, etc., and investigates how these might change in the future. Lastly, the forecast section will present the financials of the company in the upcoming years. The forecast period will be five years from 2019 to 2023. In order to build this model, Microsoft Excel is used. To determine the WACC, the capital asset pricing model (CAPM) needs to be calculated first. However, the media and entertainment industry needs to be analyzed first by using relevant information from past research. With the help of financial and statistical mathematics, the value of the company is calculated. Once the value is calculated it will be compared to the relative valuation and the real market value, to identify the reasoning of the transaction.
4.3 Method Limitation
One of the largest limitations of this study is the access to the enterprises and people involved in the acquisition deal. It is unlikely that the research will be able to obtain primary data of the companies and people involved in the deal. Therefore, the research might miss crucial information that could explain the rationale of The Walt Disney Company. The reason for the denied access lies in the nature of the study. Since the study is not an official authorized study by a reputable magazine, the importance of this study is diminished and is unlikely to open doors to employees of the two companies. Additionally, the author of the case study has only limited access to the customers and their preferences. Meaning that insights are missing on upcoming consumer trends and their impact on the industry. This could mean, that future cash flows might be forecasted differently to the ones conducted inside the companies and therefore, the calculated equity value of the research can differ to the one calculated by Disney. In fact, it is quite likely that the estimated value will differ, since due diligence is not known to the public and in such a transaction there are multiple investment banks analyzing the company. Thus, it is not possible for the author to replicate the same input. Nevertheless, the limited access does not prevent to follow through on the study, as it can serve as an indicator that will support to answer the main research question.
5 Strategic Analysis
The following chapter focuses on the strategic analysis of the transaction. Therefore, the chapter begin with an analysis of the Media and Entertainment Industry. The industry analysis presents a general economic overview and then dives into the industry itself. It presents the components of the industry, the current performance and major trends that are shaping the future of the industry. The industry analysis is finalized by conducting a deep analysis of the most important segments in which the two companies compete. After the industry analysis, the two companies are presented. Lastly, the information from the industry analysis and the company overviews are taken into consideration in order to understand the strategic rationale of the transaction.
5.1 Analysis of the Media and Entertainment Industry
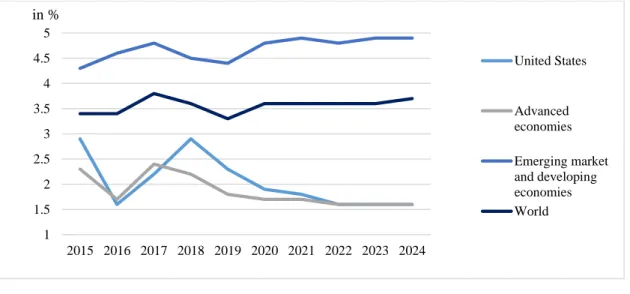
Analyzing if an industry performance is caused by the industry itself or by the general economic situation is crucial. Thus, it can add value to have a quick glimpse into the current situation of the world economy and the main underlying economy of the specific industry, which is, in this case, the United States. Figure 1 outlines the growth of the gross domestic product (GDP), which is the most common indicator for a country’s overall economic activity. In the past two years, the world economy growth decreased and is forecasted to keep decreasing in 2019 (3.3%). However, post-2019, the GDP growth is predicted to increase again, which is caused mainly by emerging countries. The United States, on the other hand, will experience a decrease in its GDP growth. While the 2018 GDP growth was 2.9% it is expected to decrease until 2024 (1.6%). This is similar to other advanced economies, which all underperform compared to the world average.
Figure 1 Real GDP growth - Annual percent change
Source: IMF (2019)
Nevertheless, the decrease in GDP growth will not have an effect on the unemployment rate in the U.S. The rate continuously decreased from a five-year high in 2014 (above 6.5%) to a rate of 3.9% in January 2019 (Trading Economics, 2019). Furthermore, it is expected that unemployment is further decreasing. Therefore, labor security exists in the United States due to the high employment rate.
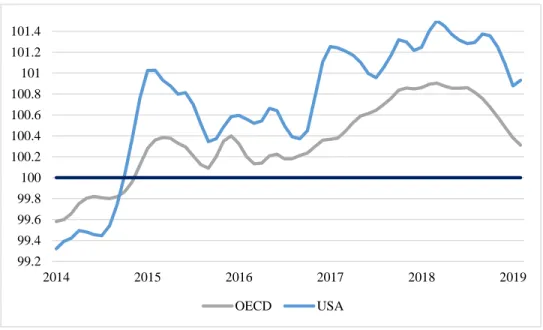
Another important indicator, especially for the M&E industry, is to measure the consumers’ optimism regarding the overall economy and their personal financial situation. It is called the Consumer Confidence Index and it indicates consumer spending behavior. It has a nominal value of 100. If the index is above the nominal value, consumers are more prone to spend, while consumers tend to save more and spend less if the index is below 100. Figure 2 shows that the consumers of the U.S. and the OECD countries shifted their behavior in October 2014 and December 2014, respectively. Before this, the index was recovering from an all-time low in 2009, due to the 2008 financial crisis. However, in the past four years, the consumers tend to spend more again reaching 101.5 for the U.S. and 100.9 for the OECD states in March 2018. The past year, on the other hand, is showing a decreasing trend. Since the indexes indicated high consumer confidence in 2014, the U.S. consumers have signaled to be more confident towards the future economic situation, compared to the average consumers of the OECD countries.
1 1.5 2 2.5 3 3.5 4 4.5 5 2015 2016 2017 2018 2019 2020 2021 2022 2023 2024 in % United States Advanced economies Emerging market and developing economies World
Figure 2 Consumer Confidence Index
Source: OECD (2019a)
In fact, the per-head consumption expenditure in the U.S. is one of the highest. According to the Digital Media report 2019 (Statista, 2018), the 2018 consumer spending per capita totaled $40,279, which is nearly triple the European average ($15,601) and five times higher than the global average ($8,087). Moreover, U.S. spending is 13 times higher than in China ($2,995), which is one of the most important emerging countries. China’s population of 1,388 million makes it potentially the biggest media and entertainment market worldwide compared to the “small” population of the USA (328 million) (Statista, 2018).
5.1.1 Overview
The global media and entertainment industry (M&E) is a large and diversified industry. Big conglomerates compete in various segments that consist of film, TV, music, video games and publishing. These segments function on a horizontal line aside each other while there are two additional vertical segments: internet and advertising. Combining all segments creates one vertical market. Furthermore, customer preferences and industry drivers differ for each segment. Therefore, the uniqueness of the vertical is obvious, since the different segments compete, or complement each other to address the industry needs.
99.2 99.4 99.6 99.8 100 100.2 100.4 100.6 100.8 101 101.2 101.4 2014 2015 2016 2017 2018 2019 OECD USA
A few decades ago, the industry has been viewed as a creative content generator that followed consumer and technology trends and decided what to supply. Therefore, the industry highly depended on cultures, languages and ultimately, specific markets. Nevertheless, the segments internationalized by overpassing the language barrier, due to its changing customers. In addition, the new generation became more demanding about what they like, where and how to watch it. Consequently, the industry transformed from a push to a pull market. The companies within the industry need to adapt to the consumer-driven trends since the industry appeals to the emotions and psychology of the customer, who subjectively decide what to accept and to value. The M&E industry also highly relies on external factors but most importantly on technology developments. Throughout its existence, the industry has experienced major disruptive forces. Starting in the 1990s, the digitization of content significantly affected the creation and distribution of music while the internet in the 2000s shattered the industry’s fundamentals. The most recent game-changer was social media, while it certainly will not be the last one that shapes the future of the M&E industry.
Concurrently, these disruptive forces provoked waves of convergence. The first wave occurred between 1993 and 2003 in which companies hoped to accelerate growth by combining their businesses. Mergers, such as the CBS-Viacom ($35.6 billion) in 1999 (Goldman & Johnson, 1999) and acquisitions, like Comcast-AT&T Broadband (€44.5 billion) in the year 2001 (AT&T, 2001) and News Corporation-DirectTV ($6.6 billion) in year 20003 (Sorkin, 2003), occurred. However, the most important deal, which is also the biggest deal of all time in the M&E industry, was the AOL-Time Warner merger. In 2000, America Online Inc. (AOL) purchased Time Warner for $164.7 billion (IMAA, 2019) which gave them 55% ownership of the new company AOL Timer Warner Inc. Nevertheless, most of these transactions were not successful, due to differences in corporate culture and wrong market timing.
Therefore, in the second wave, the companies focused more on vertical and horizontal acquisitions. In 2008, CBS bought CNET for $1.8 billion to strengthen its online content (CBS Corporation, 2008). Similar approaches were the Disney-Marvel Entertainment (2009) and Disney-Lucasfilm (2012) transactions. Disney wanted to gain the content of both companies. Lastly, Comcast acquired NBCUniversal in 2011 to gain the assets and the subscribers (Adegoke & Levine, 2011).
5.1.2 Current Performance
In 2017, the global M&E revenue reached $1.9 trillion and will reach $2.4 trillion in 2022, which displays a compound annual growth rate (CAGR) of 4.4% (PwC Belgium, 2018). This means that the industry is likely to outperform the global economy (recall Figure 1). However, this is not set in stone, since new technologies, that will be discussed later, will have a significant impact on the industry. One of the winners will be the video game segments, due to the rise of e-sports. It will be the second fastest-growing segment with a CAGR of 20.6% resulting in total revenue of $1.6 billion by 2022. In comparison, the 2017 total revenue counted $620 million (PwC, 2018). The losing segment is going to be in the publishing sector. The segment’s revenues continue to deteriorate as publishers encounter difficulties to monetize their digital content. Consequently, the revenues of magazines and newspapers will experience declines throughout the next years. The magazine market will shrink by US$3.8 billion to global revenue of $88.1 billion by 2022 (PwC, 2018). The largest M&E market in the world by far is the United States. It alone represents a third of the global M&E industry with $735 billion in total revenue and is expected to produce more than $830 billion by 2022 (International Trade Administration, 2018). China, the second largest market, “only” generates $190 billion and Japan came in third, at $157 billion (International Trade Administration, 2017).
Even though the industry is highly diversified, the competitive environment is not. The industry is considered highly concentrated. A few large firms shape the direction and its evolution. However, it is difficult to determine the main competitors, since most companies do not compete in all segments. For example, three big record companies dominate the music segment. However, these companies might not be in direct competition to companies that dominate the film segment. Therefore, the main competitors, which are relevant for the Disney-Fox transaction, are subtracted from the 2018 annual reports of The Walt Disney Company and 21st Century Fox. The main
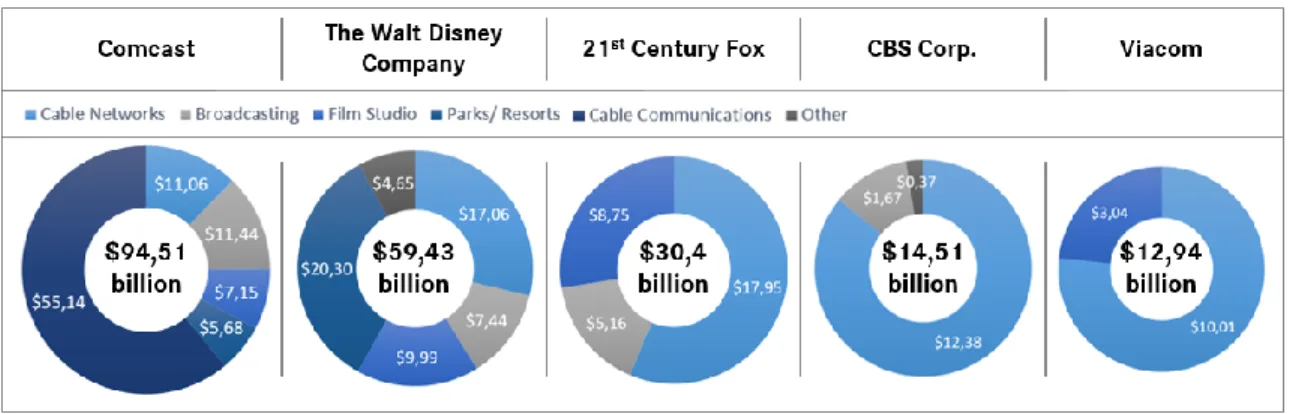
Figure 3 Main competitors ranked by revenues in 2018
Source: 21st Century Fox (2018), The Walt Disney Company (2018d), Comcast (2018c), Viacom (2018), CBS Corporation (2019)
Figure 3 shows that Comcast is the largest conglomerate among all five companies with a staggering $95 billion revenue in 2018. The Walt Disney Company follows as second but will catch up to Comcast once it consolidates the revenue of the third largest competitor, 21st Century Fox.
This means, that two larger conglomerates will likely dominate the market, since CBS Corporation and Viacom show “only” a 2018 revenue of $14.5 billion and $12.9 billion, respectively. Furthermore, it can be seen that the segments in which The Walt Disney Company and 21st Century
Fox mainly compete are the film and TV ones.
5.1.3 Future trends
According to PwC’s Global Entertainment & Media Outlook 2018-2022, the industry currently experiences the third wave of convergence. The $81 billion worth AT&T-Time Warner (AT&T, 2018) deal and the Disney-Fox transaction provides proof for the third wave. Alongside the convergence 3.0 comes five trends. Each trend bears a threat but also creates an opportunity for the M&E ecosystem. It will become essential to “diversify revenue streams, position themselves in
more and different points in the value chain and seek relevant scale.” (PwC, 2018).
The first driver of change, Ubiquitous connectivity, relates to being constantly online. As a result of the continuing investment in technology and internet infrastructure, as well as the upcoming 5G network, the coverage expanded dramatically. This supports the digital delivery of content to the devices. The mobile consumer is considered as the second driver. Consumers use more and more their smartphones as a mean to view or use the content created by the companies. These have now
the challenge to grasp and monetize the mobile consumer through customer experience. The third driver is the need for new sources of revenue growth. The traditional revenue streams of enterprises are deteriorating. If it is the home entertainment in the United States or the print newspaper in the UK, both show that the conventional mean of generating revenue does not fit in modern times. Business models need to be adapted or extended to seize the new revenue streams offered by digital technology. In 2018, digital revenue accounted for more than 50% of the industry’s income (PwC, 2018). One of these technologies is the fourth driver that emphasizes the value shift to platforms. Throughout the digitization of the industry, platforms have been the major recipients due to their effectivity to generate money through advertising, subscription, and transactions. Lastly,
personalization is gaining in importance. Data analytics, technology enhanced content
decision-making and user experience, are all crucial for succeeding in the M&E industry. Nonetheless, it is important to gain a deep insight regarding trends for the segments in which Disney and 21CF mainly compete – film and TV.
5.1.4 Film Segment
The global film segment was worth $96.8 billion in 2018, which includes box offices and home entertainment. This represents a nine percent growth from 2017 and a 25 percent growth from 2014 (Appendix 1).
Considering only the global box office revenue, the segment produced $41.1 billion (Appendix 1) and is projected to continue to grow (PwC, 2018). The growth is led by the Asia Pacific market ($16.7 billion) with China being the main driver (MPAA, 2019). By 2020, it is expected that the Chinese box-office revenue will exceed the one of the U.S., which is the largest market in terms of box-office revenue (PwC, 2018). However, it is not in terms of quantity. Hereby, India, with its famous Bollywood, is considered as the largest film market in the world in terms of produced movies and tickets sold. Nevertheless, in 2018, the total film industry increased by 10 percent in comparison to 2017 and generated $35.2 billion, while domestic box offices accounted for $11.9 billion (Appendix 2). This means that nearly 30% of global box office revenue was generated in the U.S. Therefore, it is no wonder that the last year was a record-breaking year for the film industry. Thus, it seems that the U.S. film industry is flourishing since Figure 4 shows that domestic
box office revenue is steadily growing throughout the years. It is also in line with the growing global box office (Appendix 3).
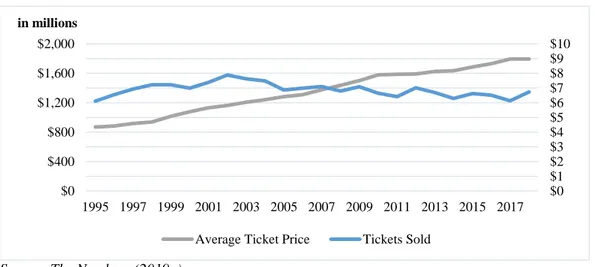
Figure 4 Average cinema ticket price and numbers of tickets sold (1995-2018)
Source: The Numbers (2019a)
However, this might not be true if one considers the admissions sold and the change in ticket prices, as displayed in Figure 4. Here it can be seen that the amount of tickets sold is slowly declining since 2002, while the year 2018 indeed sold the most tickets in the past five years. Furthermore, admissions are becoming more expensive. One needs to pay $1.79 more in 2018 ($8.97) compared to ten years ago in 2008 ($7.18). Thus, considering inflation, the total domestic box office (inflation-adjusted) looks slightly different from the nominal box office. Now, the box office revenue shows a downward trend (Figure 5) that could indicate the decreasing importance of theatrical distribution.
Figure 5 Total Box office & total inflation-adjusted box office (1995-2018)
Source: The Numbers (2019a) $0 $2 $4 $6 $8 $10 $12 $14 $16 1995 1997 1999 2001 2003 2005 2007 2009 2011 2013 2015 2017 in billions
Total Box Office Total Inflation Adjusted Box Office $0 $400 $800 $1,200 $1,600 $2,000 1995 1997 1999 2001 2003 2005 2007 2009 2011 2013 2015 2017 $0 $1 $2 $3 $4 $5 $6 $7 $8 $9 $10 in millions
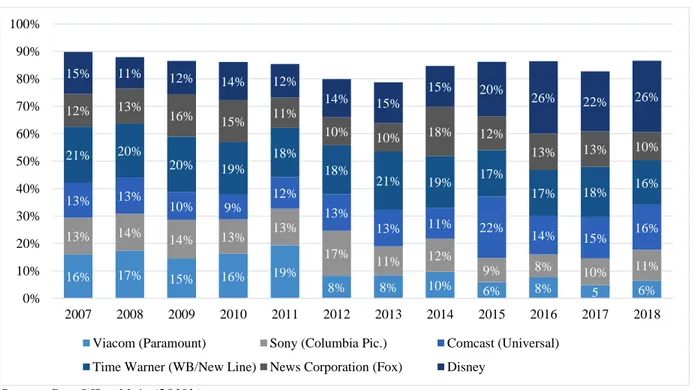
Previously, it was mentioned that a few large companies control the film industry. They are commonly known as the “Big Six”, which are major film studios that have been active since Hollywood’s Golden Age. They include the following studios: Paramount Pictures (Viacom); Columbia Pictures (Sony); Warner Bros. Pictures (Time Warner); Universal Pictures (Comcast); 20th Century Fox and Walt Disney Studios. It needs to be noted that there are only five major studios left since Disney swallowed 20th Century Fox in 2019. Figure 6 shows the development of the US market share in the film industry by the parenting company of the film studios. Eye-catching is that the six companies collectively generate approximately 85% of all US box office grossing. Out of these, Disney dominates with a 26% market share in 2018n which equals a total gross of $3.135 billons (Box Office Mojo, 2019b). Second, are Comcast and Time Warner with each 16%. This has not always been like this. Until 2014, Time Warner held the most market share with its two studios Warner Bros Pictures and New Line Cinema. However, starting from 2011, Disney gained momentum and increased its market share slowly year by year, except in 2017.
Figure 6 US film market share by Top 6 parenting company
Source: Box Office Mojo (2019b)
Disney’s growth can be attributed to the acquisitions of Marvel (2009) and Lucasfilm (2012). Nevertheless, Disney also benefited from a consumer taste shift. According to Hüttmann (2019), the cinema experienced a fantasy trend after the turn of the millennium. He argues that the cinema
16% 17% 15% 16% 19% 8% 8% 10% 6% 8% 5 6% 13% 14% 14% 13% 13% 17% 11% 12% 9% 8% 10% 11% 13% 13% 10% 9% 12% 13% 13% 11% 22% 14% 15% 16% 21% 20% 20% 19% 18% 18% 21% 19% 17% 17% 18% 16% 12% 13% 16% 15% 11% 10% 10% 18% 12% 13% 13% 10% 15% 11% 12% 14% 12% 14% 15% 15% 20% 26% 22% 26% 0% 10% 20% 30% 40% 50% 60% 70% 80% 90% 100% 2007 2008 2009 2010 2011 2012 2013 2014 2015 2016 2017 2018 Viacom (Paramount) Sony (Columbia Pic.) Comcast (Universal)
in the 90s was dominated by action movies with classical action heroes, like Bruce Willis in Die
Hard. Alongside movies of the genre Thriller and Drama, these movies had a budget of $40 million
to $60 million. However, on account of The Lord of the Rings and Harry Potter in 2001, the fantasy genre gained new respectability. Shortly after, many more fantasy movies like The Chronicles of
Narnia followed. Today, it is challenging to find a low budget movie in the cinema, since
big-budget blockbusters dominate them. These movies have a much higher big-budget, which can range from $200 million to $400 million (Hüttmann, 2019). He states further, that today’s cinema can be called an event cinema since it inhabits movies that are purely for entertainment with a larger budget and great special effects. Simultaneously, the major film studios flooded the cinemas with franchises. James Bond, Fast and the Furious and Jurassic Park are examples. Once the first film was a success, the company uses the built-in awareness of the first movie to market the second movie, since familiarity breeds success (Garrahan, 2014). If the audience is familiar with a title, they are more prone to look forward to it, meaning that sequels and franchises become cash machines for the studios. In economic terms, franchises are cash cows for film studios. Returning to Disney it becomes clear that they understood these trends and made acquisitions accordingly. Therefore, it is hardly surprising why Disney acquired the fantasy-based studios Marvel Entertainment and Lucasfilm and turned them into the largest existing movie franchises (Lynch, 2018).
5.1.5 TV Segment
The film market is small compared to the TV market. In 2017, the number of TV households worldwide was 1.63 billion (Statista, 2019a). The global pay TV revenue totaled around $200 billion in the same year. Most of the revenue is generated by advertising and program revenue, which means licensing the content to broadcast programs. In the coming years, there will be a strong growing market in the Asia-Pacific region with an estimated 666 million pay TV subscribers by 2022 (Statista, 2019b). Alone in the U.S., there are 119.9 million TV homes, which means that 94% of American households own a TV (Nielsen, 2018). Thus, TV is one of the most penetrated media channels. Nearly 187 million adults watched cable or satellite TV in the United States last year (eMarketer, 2019). As mentioned earlier, Comcast Corporation is one of the largest cable providers in the United States. According to Richter (2018), Comcast has 22.1 million pay TV
subscribers, with DirectTV (20 million) and Charter (16.7 million) being second and third, respectively.
However, the TV market experiences the same trend as the film industry. The number of subscribers is deteriorating and consequently the revenue as well. The global pay TV revenue is predicted to decline to $183 billion by 2023 (Statista, 2019b). The deterioration is mostly driven by the United States since more and more people are cutting their cords. In 2018, the traditional pay TV services lost 3.5 million subscribers (Leichtman Research Group, 2019). By 2018, a total of 33 million people already cut their cords in the United States and the number is expected to increase rapidly. It is forecasted that there will be 55 million cord-cutters in the U.S. by 2022 (eMarketer, 2019). This declining trend is not a regional occurrence but a global trend. The third quarter in 2018 was the first time that the global pay TV subscribers’ number of the top 100 pay TV companies declined. The quarter showed a loss of 0.11 million subscribers, even though the Asia Pacific region showed strong growth (Informitv, 2019).
The vital question now is, why are people visiting cinemas less and cut their cords. It is not that the people are becoming less interested in media but that they are switching the channel. Due to the digitization, the consumers are starting to watch content more frequently online on over-the-top (OTT) platforms.
5.1.6 Over-The-Top Platform
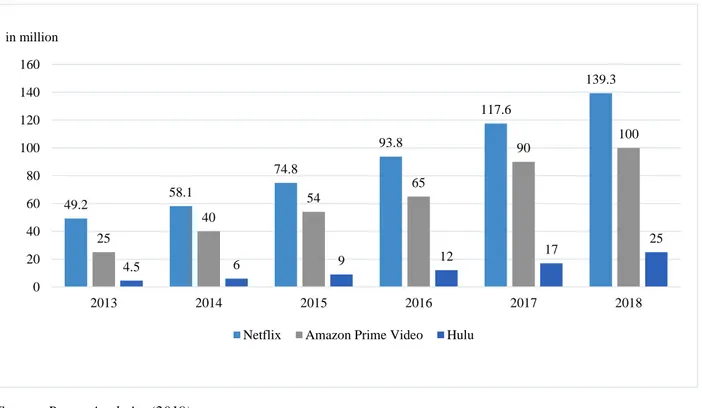
OTT platforms are content providers that distribute media through the internet and therefore bypassing the TV broadcaster. The platforms either offer access to film and TV content on demand, which they acquired from other companies (licensing) or produced their own original content specifically for the platform. There are three different types of OTT platforms. The first and most commonly known is the subscription VOD (SVOD), that uses a subscription business model. Subscribers pay a monthly or annual fee for unlimited access to all programs provided by the service. The most famous SVOD platforms are Netflix and Prime Video. Hulu is also a big player in the United States. The second model is a transactional VOD (TVOD) in which customers pay for each content individual. Large players are iTunes or Google Play Movies. The third is an advertising VOD (AVOD). The consumers do not pay a fee for watching content but ads are present. The most famous are YouTube and Crackle.
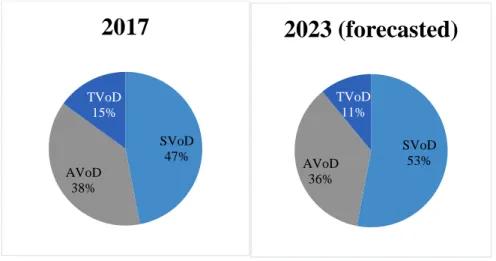
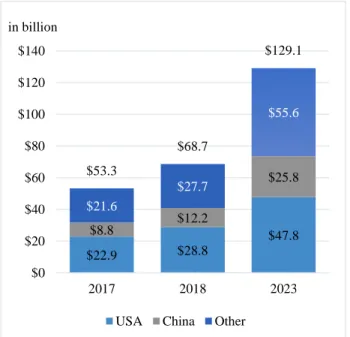
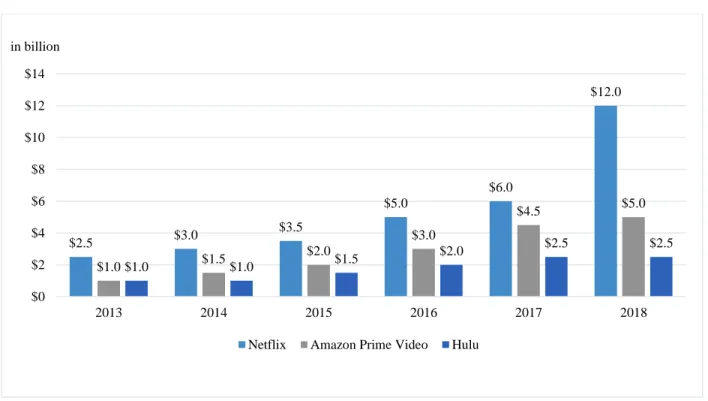
The online video streaming market is one of the fastest growing segments in the media ecosystem. In 2014, the global OTT revenue totaled $21 billion. In 2017, it recorded a global revenue of $53 and is about to reach $69 billion in 2018. It is expected that the growth continues and the revenue will reach $129 billion in 2023. This would be a 240% increase from 2017 (Appendix 4). The vigorous growth is steered by two determinants: SVOD, and the two regions China and the USA. SVOD platforms show great growths in the past years since more people are joining and subscribe to these disruptive platforms. At the end of 2017, the global subscription number counted 366 million people. The expected number will be up by 411 million in 2023 and equal 777 (Digital TV Research, 2018b). Consequently, the revenue generated through SVOD service providers increases as well. While in 2015 the global SVOD market was worth $11.2 billion, it already doubled its revenue by 2017. The growth will continue and the market is expected to reach $69 billion by 2023 (Appendix 5). If this growth sustains, the SVOD market will have nearly tripled its revenue. Figure 7 displays the importance of SVOD for the overall over-the-top market.
Figure 7 Comparison of market share by OTT type in 2017 vs. 2023 (forecasted)
Source: Digital TV Research (2018a) & Digital TV Research (2018b)
SVOD platforms account for 47% of the total global OTT revenue and are forecasted to gain five more percent in the next five years. Simultaneously, 2019 will be the year in which global subscription OTT revenue will outgrow cinema. The forecasted $46 billion in 2019 (Appendix 5) will be certainly higher than the 2019 global box office since the box offices will need to grow by twelve percent, which did not occur in the past five years (Appendix 1).
The second determinant is the driving force of China and the USA. The U.S. is the largest OTT market and continues to dominate, while China is the fastest-growing market. In 2017, the USA
SVoD 47% AVoD 38% TVoD 15%