USING THE ECHO PATTERN TO RANGE A SOUND SOURCE
Michael B. Porter
Sergio Jesus
Scripps Institution of Oceanography
UCEH - University of Algarve, PT-8000,
La Jolla, CA 92152, U.S.A.
Faro, Portugal
Yann Stéphan and Xavier Démoulin
Emanuel Coeho
CMO - SHOM
Instituto Hidrografico
Brest, France
Lisboa, Portugal
Abstract
One of the currently exciting areas in SONAR research is in the use of acoustic channel models to improve SONAR systems. In this paper, we use the echo pattern at a single phone to localise a sound source in both range and depth in the ocean. To make the localisation robust, the signal processing is set-up with particular regard to which acoustic features are reliable and clear encoders of the
source position. The resulting algorithm was tested using experimental data collected during INTIMATE’96- a shallow water experiment conducted on the Portuguese continental shelf[1]. The results show successful tracking over a period of several days encompassing two fixed 25-hour stations and an 18-hour period of ship manoeuvres.
INTRODUCTION
Our interest in this paper is to develop a practical method for rapid (immediate) source localisation in a passive acoustic system that may operate in a highly variable shallow-water environment. In brief, the method consists of using an acoustic model[2] to predict the echo pattern in the ocean that would result if the source were anywhere on a grid of hypothetical source locations. The source position is then identified as the one whose echo pattern most closely matches the measured one. This is essentially the concept of matched-field processing[3]. That processing is usually done with tonals; however, there is also limited work with broadband, time-domain signals [4][5][6][7].
The key challenge in incorporating acoustic models is to do so in a robust manner. The acoustic models are imperfect, primarily because of the lack of precise environmental information. The signal processing needs to incorporate the acoustic information taking into account its quality. Our approach is to correlate the logs of the envelopes of the acoustic signals. This eliminates sensitivity to the phase of surface and bottom reflections. It also brings into balance the weaker late arrivals with the stronger early arrivals so that the entire arrival structure is used for source localisation.
EXPERIMENT OVERVIEW
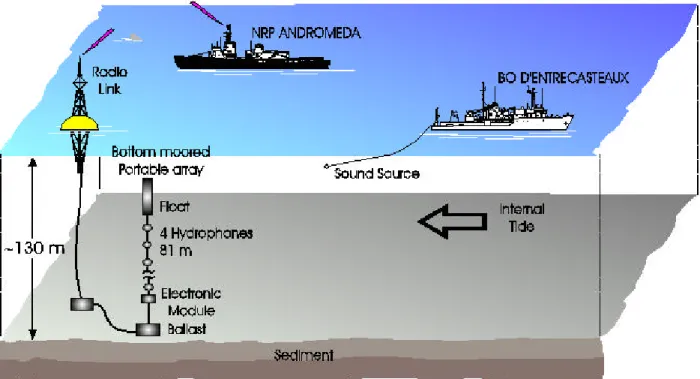
To study this process, we conducted an experiment called INTIMATE ‘96 for Internal Tide Monitoring by means of Acoustic Tomography Experiment about 10 km west of Lisbon, Portugal. It involved a towed source whose sound field was received by a fixed, vertical line array with 4 hydrophones. The configuration is illustrated in Figure 1. The source transmitted linear frequency-modulated (LFM) chirps sweeping from 300 Hz to 800 Hz over a 2-second period. These were repeated every 8 seconds for the duration of the experiment.
The sound source was towed at a depth of 90 m in a sort of bow-tie pattern around the array as shown in Figure 2. This pattern allowed us to study the reliability of the tracking over ranges from 0 to 10 km. In addition, it allowed us to study the tracking on several different radials. In particular, we included an easy slice along the continental shelf and therefore with a nearly constant bottom depth. At the other extreme, we included a slice perpendicular to the continental shelf, which has significant topographic variation.
In addition, to the topographic variation there was also (by design) great oceanographic variation due to the internal tides. The crests of these tides are aligned parallel to the shore so that slices along the continental shelf are also range-independent in terms of the oceanography.
Figure 1: Experimental configuration.
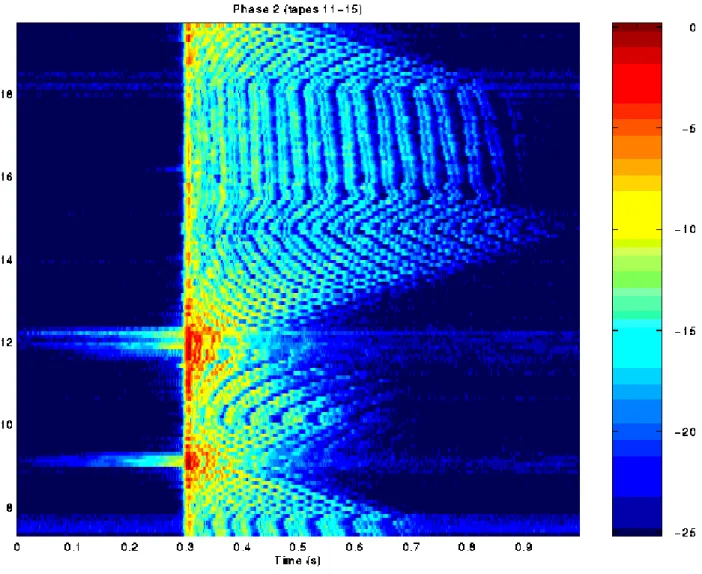
Figure 3: Echo response over the 18 hours of ship manoeuvres.
Acoustics
The chirps were processed using traditional methods to compress the waveforms into impulses. In particular, the received time series were correlated with the transmitted waveform to yield the so-called correlogram. We next calculated the envelope of the correlogram and converted the result in dB. This process is repeated for every transmitted chirp over the 18 hours of the experiment yielding the plot shown in Fig. 3.
We see in this figure a pattern of echoes corresponding to multiple surface and bottom reflections, i.e. the multipath structure of the channel response. We can understand this pattern both qualitatively and quantitatively with the aid of a
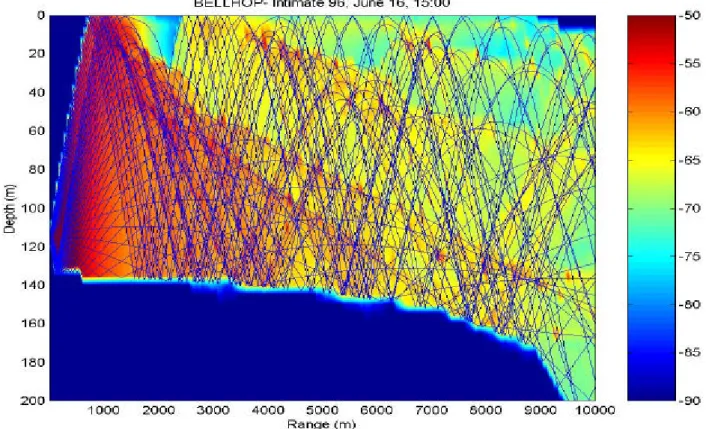
ray/beam model. Figure 4 shows the rays propagating from the lowest phone on the array at 115 m in the downslope direction. We see that there are two classes of ray paths. The first group of rays is refracted away from the warmer waters near the ocean surface and thus never reflects from the surface. The second group of rays propagates steeply enough to penetrate the warm surface layer and reflects off both the surface and bottom. Perhaps the most obvious feature in the echo response is the change in the overall duration of the echo response. At longer ranges there are more echoes and the overall channel response extends to about 0.7 seconds. The duration tells us the range of source while the precise pattern of echoes tells us its depth.
Figure 4: Ray trace and transmission-loss.
Tracking
As mentioned earlier, we track the source by running an acoustic model for an ensemble of candidate ranges and then we look for a match between the modelled and measured acoustic response. The acoustic model yields the ensemble of predicted echo responses. For each transmitted chirp we then compute the model/data correlation for each candidate depth and range. Thus we obtain correlation over a space-time volume.
Mathematically, we may write this as:
τ
τ
τ
g
t
r
z
d
r
z
r
t
c
(
;
,
)
=
∫
le(
)
le(
−
;
,
)
. Here,( )
[
(
)
]
}
log
20
,
0
max{
)
(
t
env
r
t
a
r
le=
−
,and r(t) is the waveform computed by correlating the received waveform with a replica of the transmitted waveform. The constant, a, is a clipping threshold set at 30 dB. In addition,
(
)
[
(
;
,
)
]
}
log
20
,
0
max{
)
,
;
(
t
r
z
env
g
t
r
z
a
g
le=
−
,particular, searching for the maximum of the correlation,
)
,
;
(
max
)
,
(
r
z
c
t
r
z
P
t=
,identifies the best fit.
In Figure 5 below, we have plotted this correlation after projecting by taking a maximum over depth. There are 4 phones on the vertical array each yielding its own ambiguity surface plotted in the panels of Figure 5.
We observe that all 4 phones show a zigzagging peak, which identifies the source range. The results have been checked against GPS navigational data and are correct to within 10%. We also note that peak is a bit obscured during the time period between 14:00 and 18:00. This corresponds to the time when the source was located downslope. The acoustic modelling here was done using a simple flat-bottom model so this degradation was expected.
Finally, we see that the upper right-hand panel shows significantly poorer performance. This phone actually failed during the experiment and was flooded with salt water. Thus, these 4 panels show
signal-to-noise ration. The robustness of the processor is very gratifying.
Summary
Collectively these results suggest that acoustic channel models offer great potential for developing new systems. A critical issue is that of designing the algorithms which exploit the reliable features of the acoustic propagation. The INTIMATE ’96 experiment has provided a wealth of data that illustrates the basic channel stability and provides insight on how to best use the resulting information. In fact many researchers believed that model-based tracking would not be feasible in shallow-water. The nature of shallow-water sound speed profiles usually implies that all multipaths are bottom interacting and the reflectivity of the ocean bottom is usually not well known. Furthermore, shallow waters typically show greater oceanographic variability due to river efflux or other coastal processes such as the tides (which play a strong role in this experiment).
The simple algorithm described here takes many of these physical features into account. The envelope is in insensitive to the phase of the waveform. Thus, the acoustic model can be inaccurate in its prediction of the phase of the bottom reflection coefficient.
The correlation of the logs is motivated by the fact that most of the acoustic energy is carried in the first few arrivals. These are not separated in time and are very sensitive to oceanographic variation. As such a simple correlation of time-series yields an unreliable localizer. Correlation in the log domain accentuates the role of the later arrivals, which do provide reliable information for source localisation.
To make this formal we may envision a statistical ensemble of modelled echo responses derived from another ensemble of possible environments. The ensemble of possible environments would reflect our prior estimates of oceanographic variability and uncertainty in bottom properties. This naturally leads to a Bayesian estimator, which however is impractical to implement. The processor implemented here may be viewed as a practical, physics-based approximation of the optimal processor.
Acknowledgments
This work was supported in part by ONR Grant N00014-95-0558. One of us (M.B.P) gratefully acknowledges support under the PRAXIS program as a visiting Professor at the Universidade do Algarve and by the New Jersey Institute of Technology under the sabbatical program. The data was collected on a portable array lent to us by the SACLANT Undersea Research Centre.
References
[1] X. Démoulin, Y. Stéphan, S. Jesus, E. Coelho, and M. Porter, ‘INTIMATE96: A shallow-water tomography experiment devoted to the study of internal tides', Proceedings of the Shallow Water Acoustics Conference, Beijing, China (1998).
[2] F. Jensen, W. Kuperman, M. Porter and H. Schmidt, Computational Ocean Acoustics, American Institute of Physics, (1994). [3] Tolstoy, Matched-Field Processing for
Underwater Acoustics, World Scientific, Singapore, (1993).
[4] Evan K. Westwood and David P. Knobles, ‘Source track localization via multipath correlation matching’, J. Acoust. Soc. Amer., 102(5), pp. 2645-54 (1997).
[5] L.N. Frazer and P.I. Pecholcs, ‘Single-hydrophone localization’, J. Acoust. Soc. Amer., 88, pp. 995-1002 (1990).
[6] R.K. Brienzo and W.S. Hodgkiss, ‘Broadband matched-field processing’, J. Acoust. Soc. Amer., 94(5), pp. 2821-2831 (1993). [7] Z.H. Michalopoulou, M.B. Porter, and J.
Ianniello, ‘Broadband source localization in the Gulf of Mexico', Journal of Computational Acoustics, 2(3), pp. 361–370 (1996).
Figure 5: Ambiguity surfaces showing the source range over time as calculated from each of the 4 phones in the array.