LUÍS ANTÓNIO DE MATOS BARRETO
Response to simulated El Niño
stress by Macrocystis pyrifera
LUÍS ANTÓNIO DE MATOS BARRETO
Response to simulated El Niño
stress by Macrocystis pyrifera
Dissertation for Master’s degree in Marine Biology
Advisors: Ester Serrão Gareth Pearson Co-advisor: Lydia Ladah 2017
“Response to simulated El Ninõ stress in Macrocystis pyrifera”
Declaração de autoria de trabalho
Declaro ser a autora deste trabalho, que é original e inédito. Autores e trabalhos consultados estão devidamente citados no texto e constam da listagem de referências incluída.
Luís António de Matos Barreto
Direitos de cópia ou Copyright: © Luís Barreto:
A Universidade do Algarve tem o direito, perpétuo e sem limites geográficos, de arquivar e publicitar este trabalho através de exemplares impressos reproduzidos em papel ou de forma digital, ou por qualquer outro meio conhecido ou que venha a ser inventado, de o divulgar através de repositórios científicos e de admitir a sua cópia e distribuição com objetivos educacionais ou de investigação, não comerciais, desde que seja dado crédito ao autor e editor.
Acknowledgements
I want to thank my supervisors Gareth Pearson, Ester Serrão and Lydia Ladah for giving me this incredible opportunity and always being there to support and guide me.
Dr. Zertuche for his hospitality and wise advise.
Mariana-Sanchez for all the help, patience and friendship. Could not have been done without your help!
All the 2015 Ice team members and voluntaries that worked countless nights without sleep. BEE lab. team, Rita (she came to the rescue!), Neusa, Licinia, Neiva, Tania and Cristina. Daniel Reed for all the sampling, shipping and the constructive comments and ideas during our project.
Jorge Assis for building our climatologies.
All the volunteers in Portugal that helped during the sporophytes growth. Cristovão Nunes for all the tips in the tanks design and setup.
To my Family and friends for all the love and support, in special to my mother for always being there for and with me.
All the ones that should be here, you know.
And to Mafalda for being that special reason why we grow together, our new adventure is already here!!
Abstract
Compelling evidence on environmental and species distribution changes due to global climate change have greatly increased over the last decades and extreme events like marine heatwaves (MHWs) (concurrent high temperature and low nutrient) are increasing in frequency, duration and intensity. The giant kelp, Macrocystis pyrifera (L.) C.A. Agardh forms dense marine forests serving as a foundation species in ecosystems that are of great ecological and economic importance. Thus, the objective of this study was to test for evidence of local adaptation to conditions representative of MHWs stress in the field on a regional level, encompassing areas with different oceanographic regimes and genetic groups. Adult blades from two depths and four regions of the Northeast Pacific were exposed to simulated nutrient and thermal stress conditions. The results clearly showed that M. pyrifera populations at the southernmost limit displayed greater thermal tolerance in their photosynthetic physiology. Compared to the other regions, surface blades from the South suffered reduced impact on the photosynthetic apparatus, with Fv/Fm values at 24ºC 15.5% higher than the regional mean. Thermally-sensitive parameters governed mainly by enzymatic processes (rETRmax and Ek) were unaffected over the 15 - 24ºC range in the southernmost region, suggesting adaptation to local environmental conditions. Amongst the bottom blades collected at depth, photosynthetic responses to stress were rather similar among different regions. The F1 juvenile generation grown in vitro from parental source material did not exhibit a significant reductions in Fv/Fm under the moderate stress temperature used (21ºC), but rETRmax and Ek remained significantly higher in the Southern regions. Consistently poor
photosynthetic responses to thermal stress were observed in the North-Center region (Santa Barbara) in all experiments, suggesting genetically-based fitness reduction. Our results also highlighted the need for further research on the synergistic effects of low nutrients availability and high thermal stress considering different life stages of M.
pyrifera.
Key-words: Giant kelp, foundation species, climate change, thermal stress, local
Resumo
Evidências científicas de alterações no ambiente e distribuição de espécies devido a mudanças climáticas de caracter global, tem aumentado largamente nas últimas décadas. Eventos como as ondas de calor marinhas, têm aumentado a sua frequência (em cerca de 38%), duração e intensidade, ameaçando vários ecossistemas marinhos como recifes de coral, pradarias marinhas e florestas marinhas, assim com espécies de grande relevância económica. Espécies como as lagostas e as amêijoas foram afetadas através da redução do habitat e por stress térmico, o que resultou num aumento da mortalidade, na redução do tamanho dos indivíduos e da sua taxa de reprodução.
O Kelp gigante, Macrocystis pyrifera (L.) C.A. Agardh é o kelp com maior distribuição nos oceanos que forma extensas florestas marinhas, com uma canópia densa na superfície resultando numa grande produção primária a qual alimenta diretamente organismos herbívoros mas maioritariamente detritívoros. Devido a sua densidade e dimensão, as florestas de M. pyrifera são capazes de alterar as condições ambientas locais, nomeadamente reduzindo correntes e luz, criando um habitat heterogéneo, abrigando um grande número de espécies. Assim, funciona como uma espécie fundadora do ecossistema apresentando grande relevância ecológica e económica.
A fotossíntese é influenciada pela temperatura que regula as taxas de reações e movimentos de solutos dentro das células das algas tendo sido utilizada com sucesso noutros estudos, para quantificar o efeito de aumento de temperatura em kelps. Um dos métodos mais comuns para medir respostas fotossintéticas em eco-fisiologia é o fluorómetro (PAM), pois é capaz de determinar eficientemente as taxas fotossintéticas em laboratório e também no campo.
A utilização de técnicas de deteção remota como boias e satélites em estudos oceanográficos, permite obter dados a uma grande escala e com grande regularidade possibilitando a análise de padrões e fatores relevantes como por exemplo oscilações da temperatura da superfície do mar (SST) ou movimentos da camada de gelo polar. Esta técnica pode também ser utilizada para gravar eventos a uma escala temporal mais curta, como blooms de fitoplâncton e processos de afloramento costeiro. Dado que a macroalga
M. pyrifera forma uma canópia densa à superfície da água do mar, a utilização de dados
essencial na análise da distribuição, padrões sazonais de crescimento e correlação das florestas de kelp gigante com fenómenos ambientais como furacões ou eventos como o El Niño. A análise de climatologias, resumos de uma ou mais variáveis (SST ou Clorofila
a) em escalas temporais grandes, utiliza modelos de fluxos atmosféricos e oceanográficos
com enormes bases de dados e capacidade de processamento dos mesmos (como por exemplo o sistema de reanalise de dados oceanográficos ORAS4). Estes aumentam a quantidade e qualidade dos dados utilizáveis para estudar os fatores ambientais que afetam a espécie em estudo e permitem a criação de cenários de hipotéticos de alterações na distribuição destas espécies.
O objetivo deste estudo foi procurar evidências de adaptação local a condições representativas de stress relacionado com ondas de calor marinhas (temperaturas altas e baixa concentração de nutrientes) a um nível regional numa área que engloba regimes oceanografias diferentes, assim como diferentes grupos genéticos.
Em 2015, lâminas de M. pyrifera adultas amostradas a duas profundidades e provenientes de quatro regiões do Pacifico Noroeste foram expostas a um gradiente de água do mar a 3 temperaturas (15, 20 e 24ºC) e nutrientes (meio não enriquecido e enriquecido com Provasoli (PES)) replicados (x3), simulando condições similares fenómenos com o El Niño. Tanques de 30L contendo água do mar filtrada foram equipados com termostatos para regular a temperatura, bombas de circulação de água e aparelhos de registo de temperatura para registar o seu perfil. As condições de cultura foram: salinidade a 35ppm, ciclos de 14:10 luz:escuro a 80 μE· m-2·s-1 e os tratamentos com adição de nutrientes foram enriquecidos com 20 mL·L-1 PES.
Os resultados das experiências revelaram, com grande expressividade, que as populações de kelp gigante do limite sul da distribuição geográfica no hemisfério norte, expressavam na sua resposta fotossintética uma maior tolerância ao stress. Comparada com as outras regiões, as lâminas da superfície da região Sul, demonstraram uma menor perturbação no aparelho fotossintético com os valores do parâmetro Fv/Fm 15.5% superiores à média regional, nos tratamentos a 24ºC. Também na região Sul, os parâmetros relacionados com os processos fotossintéticos de enzimas termo sensíveis (rETRmax e Ek) foram mais elevados a 24ºC comparativamente com os tratamentos a 20ºC, o que não sucedeu nas outras regiões. Nas lâminas amostradas junto ao fundo, as repostas fotossintéticas ao
laboratório, a partir do tecido reprodutivo recolhido nas mesmas populações amostradas para as lâminas adultas, não exibiram uma redução significativa do parâmetro Fv/Fm, provavelmente devido à temperatura máxima utilizada (21ºC) a qual não foi suficientemente alta para causar stress térmico. No entanto, os parâmetros rETRmax e Ek foram significativamente mais altos na região Sul. A região Norte-Centro (Santa Barbara, Califórnia) revelou os níveis mais baixos de resposta fotossintética ao stress em todas as experiências, incluindo nos esporófitos F1. Este facto aponta para uma possível redução de fitness devido a fatores genéticos. Os nossos resultados realçam também a necessidade de futuras investigações nos efeitos sinérgicos de baixa disponibilidade de nutrientes, associada a elevadas temperaturas considerando diferentes etapas no ciclo de vida de M.
pyrifera.
Palavras-chave: Kelp, espécies, espécies estruturais, alterações climáticas, stress
Contents
Introduction 1
Objectives 5
Materials and Methods 6
Common-garden experiment comparing adult blades (Experiment 1) 7 Oceanographic data 9 Effect of blade removal on physiological responses: Comparison of entire
individuals vs excised blades (Experiment 2) 9 Control of environmental carry-over effects: Comparison of F1 generation
juvenile sporophytes (Experiment 3) 10 Statistical analyses of experimental data 11
Results 13
Common-garden experiment comparing adult blades (Experiment 1) 13 Maximum quantum efficiency of PSII (Fv/Fm) 15
Light-limited photosynthetic rates (α) 16 Maximum electron transport rate (rETRmax) 16
Minimum saturating irradiance (Ek) 17 Oceanographic data 20 Comparison of entire individuals vs excised blades (Experiment 2) 22 Comparison of F1 generation juvenile sporophytes (Experiment 3) 25 Maximum quantum efficiency of PSII (Fv/Fm) 26
Light-limited photosynthetic rates (α) 26 Maximum electron transport rate (rETRmax) 26
Minimum saturating irradiance (Ek) 27
Discussion 28
Regional differences and potential for local adaptation 28 Thermal limits 30 Nutrient effects 32 Depth effects 33 Conclusions 34 References 35 Annexes 46
Abbreviations list
PAM fluorometer - Pulse Amplified Modulated fluorometer RLC - rapid light curve
PSII - photosystem II
Fv/Fm - maximum quantum yield of PSII ETRmax - maximum electron transport rate
rETRmax - relative maximum electron transport rate α - photosynthetic rate in light-limited region of RLC
Ek - minimum saturating irradiance
N – North
NC - North-Center SC - South-Center S - South
SW - seawater
RuBisCO - Ribulose-1,5-biphosphate carboxylase/oxygenase ANOVA - Analysis of variance
GLM - Generalized Linear Models ATP - adenosine triphosphate
Vmax - maximum rate of enzymatic reaction Km - substrate affinity
ɸPSII - effective quantum yield of PSII SST - sea surface temperature
Chl a - chlorophyll a
MHWs - Marine Heat Waves PES - Provasoli Enriched Seawater
1
Introduction
Temperature is a major physical factor that defines the biogeographic distribution of species in the marine environment (Adey & Steneck, 2001; Poloczanska et al., 2007; Wernberg et
al., 2016). Species range distributions are usually associated with a center where conditions
are optimal and the edges where those conditions are no longer met (Lomolino et al., 2006). Thermal limits occur where organisms can no longer tolerate continuous temperature conditions in the environment or their fluctuations (Garrabou et al., 2009; Mohring et al., 2014). While temperature change across the latitudinal range can be broadly contiguous, environmental factors such movement of air masses, ocean currents, hurricanes, upwelling and internal waves provide extreme complexity to the marine environment resulting in great spatial (from meters to hundreds of kilometers) and temporal (from hours to decades) thermal variability (Adey & Steneck, 2001).
Compelling evidence on environmental and species distribution changes due to global climate change have greatly increased over the last decades (Selig et al., 2010; Wernberg et
al., 2012a; Rosenzweig & Neofotis, 2013; Caputi et al., 2015). In a decadal review of
scientific experiments related to climate change on marine organisms, Wernberg et al., (2012b) found that virtually all experiments showed significant effects of stress related to increased temperatures. The frequency of high seawater temperature anomalies on nearshore ecosystems has increased 38% (Lima & Wethey, 2012) resulting in a mean temperature increase of 0.5-1ºC (Hawkins et al., 2003; Ridgway, 2007). Thus, extreme events like marine heatwaves (MHWs) characterized by a sudden significant increase of seawater temperature (but see Hobday et al., 2016 for a recent detailed and hierarchical definition) are increasing in frequency, duration and intensity (Perkins, 2011; Hobday et al., 2016). Examples of such events are the northern Mediterranean Sea marine heat wave (MHW) of 2003 (Garrabou et
al., 2009) or the 2014 positive temperature anomalies on the NE and equatorial Pacific that
led to the extreme magnitude of the 2015/16 El Niño (Bond et al., 2015; Levine & Mcphaden, 2016). MHWs are caused by the interaction of atmospheric and oceanographic processes that can encompasses different geographical (local, regional and global) and temporal (seasonal, yearly, decadal) scales (Trenberth, 2012; Hobday et al., 2016).
2
These events are also affecting larger areas of the globe, threatening several marine ecosystems and key species (Lima & Wethey, 2012; Wernberg et al., 2012a). Coral reefs are among the most sensitive ecosystems to anthropogenic related environmental changes (Halpern et al., 2007) and recent extreme MHWs caused extensive bleaching and disease (Selig et al., 2010; Smale & Wernberg, 2012b). Seagrass meadows (e.g Posidonia oceanica) also responded negatively after the two extreme MHWs events (2003 and 2006) in the Mediterranean when shoot mortality rates exceeded recruitment (Marbà & Duarte, 2010). Similar results were obtained in a laboratory experiment mimicking an ocean warming scenario on the seagrass Zostera noltii, with reduced photosynthetic performance and shoot density (Repolho et al., 2017). Species with great economic relevance such as lobsters and scallops were also affected by the loss of habitat and direct thermal stress resulting in increased mortality, individual size reduction and reproductive rates (Mills et al., 2013; Caputi et al., 2015). Kelp forests and fucoid beds have also registered negative effects caused by rising seawater temperature events on fundamental processes such as growth, reproduction, recruitment and resilience to disturbances (Ladah & Zertuche-González, 2007; Pearson et al., 2009 ; Wernberg et al., 2012a; Nicastro et al., 2013; Jueterbock et al., 2014; Mota et al., 2015)
Photosynthesis is greatly influenced by temperature (Raven & Geider, 1988; Kirk, 2011) which regulates the rate of enzymatic reactions and solute movements within algal cells (Raven & Geider, 1988; Davison, 1991; Tamburic et al., 2014) and has been successfully used to quantify the effects of temperature increase on kelps (Henkel & Hofmann, 2008; Wernberg et al., 2010). While low temperatures reduce photosystem 2 (PSII) activity (Baker, 1991), high temperatures can result in protein denaturation and damage to the membrane systems of the photosynthetic apparatus (Daniel et al., 1996). Thus, photosynthesis is often used as an indicator for algal stress response to temperature (Hurd et al., 2014). As photosynthesis depends on the electron transport rate (ETR) in order to maintain cellular redox balance, metabolic homeostasis, and energy production (ATP) for the organism, this system is highly conservative in response to environmental (e.g temperature oscillations) and physiological changes (McDonald et al., 2011). The other facet of photosynthesis, i.e., the Calvin cycle biochemical pathway through which inorganic carbon is fixed, is temperature dependent via effects on enzyme activity. Moderate temperature increase may enhance
3
photosynthesis by increasing maximum rates of enzymatic activity, beyond which further temperature increase may reduce the maximum rate (Vmax) and/or substrate affinity (Km) of key enzymes such as RuBisCO. Limitation of photosynthetic process by inorganic carbon availability, carbonic anhydrase activity, diffusion and active transport of CO2 across the chloroplast membrane may also occur at higher non-acclimated temperatures, contributing to declining photosynthetic rates (Davison, 1991).
One of the most commonly used methods to measure photosynthetic responses in ecophysiological research is the Pulse Amplified Modulated (PAM) fluorometer, as it can efficiently determine photosynthetic rates in laboratory and field conditions (Beer et al., 1998; Ralph & Gademann, 2005; Roleda et al., 2009; Terada et al., 2016). These instruments generally have built-in software routines allowing efficient measurement of the maximum quantum yield of PSII (Fv/Fm), or the effective quantum yield of PSII under illumination (ɸPSII). ɸPSII together with information on illumination can be used to construct photosynthesis-irradiance curves, often as “rapid light curves” (RLCs) when illumination steps are given briefly (over several seconds). Declining Fv/Fm values imply a reduction in the maximum quantum yield of PSII photochemistry and therefore disturbance (short term photoacclimation) or damage to the photosynthetic apparatus (Lichtenthaler et al., 2005). RLCs are a powerful tool that provide more detailed information on the maximum electron transport rate (ETRmax), while the initial slope (α) of the RLC provides information about the relative efficiency of (PSII) photochemistry and the minimum saturating irradiance (Ek) reveal the dominance of photochemical quenching (Ralph & Gademann, 2005) and can be used as a photoacclimation indicator (Sakshaug et al., 1997).
The giant kelp, Macrocystis pyrifera (L.) C.A. Agardh is the most widely distributed kelp taxon in the oceans, distributed through the northeast and southeast Pacific Ocean, in the southwest Atlantic Ocean, South Africa, Australia, New Zealand and also around most sub-Antarctic Islands (Graham et al., 2007)). It has an heteromorphic life cycle in which the microscopic haploid gametophyte (male and female) alternates with a micro and macroscopic diploid sporophyte (Ladah & Zertuche-González, 2007; Graham & Halpern, 2008). M.
pyrifera forms dense forests with thick canopy at the water surface where the majority of the
4
net primary production (NPP) between 0.42 and 2.38 kg dry mass m-2 y-1 (Graham & Halpern, 2008). While this productivity feeds secondary production via direct grazing, most of this carbon follows the detrital pathway or is exported (Graham, 2004; Dean et al., 1984). Due to their size, density and primary production, M. pyrifera forests are able to modify the local environmental conditions providing a heterogeneous habitat which can harbour a high number of species (Santelices & Ojeda, 1984; Graham, 2004). Therefore, this species serves as a foundation species in ecosystems that are of great ecological and economic importance (Lee et al., 2009; Graham et al., 2007; Byrnes et al., 2011).
Due to the great importance of M. pyrifera as a structuring species in the Northeast Pacific, several studies have been conducted in recent years to understand the oceanographic processes affecting geographical range and genetic diversity of this species (Alberto et al., 2010, 2011; Bell et al., 2015; Johansson et al., 2015). Across the broad latitudinal distribution of M. pyrifera in the Northeast Pacific, regionally heterogeneous environmental conditions raise the hypothesis that populations may be locally adapted. In general, adaptive genetic responses to the environment can occur on a time scale of years to hundreds of years (Crispo
et al., 2010). Examples of local adaptation to warmer and nutrient limited sea-water were
already described for example in Fucus serratus (Jueterbock et al., 2014); but see Pearson et
al (2009) for potential mal-adaptation in the same species) and coral reef endosymbionts
(Howells et al., 2012).
The use of remote sensing techniques such as oceanographic buoys and satellite data has greatly increased our knowledge of the marine environment as continuous observations allow for pattern analysis of relevant factors (e.g. sea surface temperature (SST) oscillations, ice shelf movements) and can record short-lived events (e.g. phytoplankton blooms, upwelling event) (Joint & Groom, 2000; Paolo et al., 2015). Because M. pyrifera forms dense canopies at the water surface where most of the adult sporophyte biomass is located (Nyman et al., 1993; Graham et al., 2007) remote sensing by satellite data analysis has become a fundamental tool to assess kelp forest distribution, seasonal growth and correlation with environmental phenomena like hurricanes or El Niño events (North et al., 1993; Graham et
al., 2007; Cavanaugh et al., 2013). The analysis of climatologies (long-term summary of a
5
oceanographic observations by data integration in reanalysis systems (e.g. ocean reanalysis system ORAS4) provide improved quality controlled data sets that can be used to assess how environmental conditions affect target species and provide plausible scenarios concerning species range distribution shifts (Lee et al., 2009 ; Balmaseda et al., 2013)
Understanding the physiological responses of M. pyrifera to stress conditions will help to predict and possibly minimize reductions in range distribution. Although several studies have focused on the response of M. pyrifera to thermal stress (North & Zimmerman, 1984; Deyseher & Dean, 1986; Rothausler et al., 2009; Xu et al., 2013) a regional comparison between population responses that encompass areas with different oceanographic regimes and genetic groups has yet to be performed.
Objectives:
This study aims to test for evidence of local adaptation to conditions representative of heat waves in the field (i.e., concurrent high temperature and low nutrient [inorganic N] stress) in populations of the giant kelp Macrocystis pyrifera at its southern limit in the northern hemisphere, in a region that encompasses distinct genetic groups and biogeographic thermal barriers, by comparing southern limit populations with those near the center of the range. This aim is approached by comparing ecophysiological responses of adult blades and F1 juvenile sporophytes from eight populations representing four distinct genetic regions.
6
Materials and Methods
In all tasks, the model used was the giant kelp Macrocystis pyrifera in the northeast Pacific between Baja California, Mexico and central California, U.S.A., an area covering around 1300 km of coastline that includes major biogeographic and thermal transition zones (Fig 1).
Figure1: Locations of the 8 populations (2 populations per region) sampled along the coast of California, USA
(regions North, North-Center) and Baja California, Mexico (regions South-Center and South) (see Annex I for coordinates).
7
Common-garden experiment comparing adult blades (Experiment 1)
On June 18, 2015, adult M. pyrifera blades were simultaneously sampled by SCUBA diving from two populations within each of 4 regions in the northeast Pacific: 1) north (N) (Santa Cruz), 2) north-center (NC) (Santa Barbara) - both in the U.S.A, and 3) south-center (SC) (Ensenada) and 4) south (S) (Punta Eugenia) in Baja California, Mexico (Fig. 1, see Annex I for coordinates). Populations within a region were not very distant, but direct gene flow is expected to be low based on gaps in habitat continuity between populations (Alberto et al., 2010). From each population, 54 blades were sampled from the surface and 54 blades near the bottom (at depth 15-20 m). In addition, 10 reproductive blades (sporophylls) were sampled for subsequent spore release. Blades were cleaned of epiphytes using paper towels, then packed in moistened paper towels and wrapped in aluminum foil. All blades were transported to Ensenada in cool-boxes packed with ice for the laboratory experiment and arrived within 24 h of collection. Samples from the Ensenada area were collected, prepared and stored in a similar way, to avoid transportation effects. Immediately on arrival at the laboratory, adult sporophyte blades were acclimated for 24h at 15 ºC in 20 mL·L-1 Provasoli seawater (SW) medium (PES; Provasoli, 1968) (Anderson, 2005).
The experimental design consisted of a replicated (×3) gradient of SW temperatures (15, 20, 24 ºC) and nutrients (non-enriched or enriched SW with PES SW medium), simulating a range of environmental conditions including El Niño (Fig. 2).
Figure 2: Experimental design. Acclimation for 24 h (15 ºC, with nutrients) followed by transfer of blades to 3
replicates of each of 3 temperature treatment (15, 20, 24ºC) with enriched and non-enriched seawater with PES. For each treatment condition (temperature and nutrients) a total of 3 blades per population (8 populations) x 2 depths (surface and bottom) were used.
8
Tanks containing 30 L filtered SW were equipped with thermostats to regulate temperature, pumps for water circulation and temperature loggers to record thermal profiles. Culture conditions were 14:10h light:dark cycle, 80 μE· m-2·s-1 and treatments with nutrients were enriched with 20 mL·L-1 PES (Anderson, 2005) at 35 ppm salinity. Blades were placed inside large open-mesh (1 cm) bags to allow individual identification throughout the experiment while not significantly reducing light and water circulation reaching the blades. Three blades per population (and from each depth within that population) were placed in each treatment tank. The maximum temperature (24ºC) was selected based on climatology analysis of the sites and thermal limits reported on literature (Hernandez-Carmona et al., 2001; Ladah & Zertuche-González, 2007; Rothausler et al., 2009)
The following physiological measurements were taken using a pulse amplified modulated (PAM) fluorometer (Diving PAM, Waltz, Germany) during the course of the experiment to allow a continuous assessment of the condition and stress responses of the algae: Fv/Fm (the maximum yield of photosystem 2 (PSII) photochemistry), and rapid light curves (photosynthesis versus irradiance curves from relative electron transport rates [rETR], calculated from PSII yield [∆F/Fm] at each irradiance level). Fv/Fm measurements and observation of blade condition were performed every 24h (starting at 12h) to determine if sampling was required due to tissue degradation (at higher temperatures). If so, rapid light curves were performed and tissue from each individual blade was sampled for gene expression. Tissue samples were flash-frozen in liquid nitrogen and later lyophilized in order to preserve tissue for RNA extraction. Diving PAM settings for the RLCs were the following: light curve intensity (LC-INT = 2), duration of each step (LC-WIDTH = 10seconds) and actinity light list for each step (1, 19, 45, 70, 94, 138, 219, 278 and 444). These settings allowed a plateau in the rETR curve to be reached (i.e., saturated photosynthesis and in some cases photoinhibitory decline at the highest irradiance (Ralph & Gademann, 2005). RLC calibration was performed prior to the experiment using separate M. pyrifera blade samples.
9
Oceanographic data:
We analyzed local oceanographic features of each region prior to and during the sampling event for evaluation in light of the physiological results. Ocean temperature data were compiled on a daily basis at two depths (surface and 20 m) for each region. Data were derived from the Global Ocean Physics Reanalysis ECMWF ORAP5.0 (1979-2013), which uses a 3D model (NEMOVAR) with a bias correction scheme that combines satellite data and in
situ measurements, for a spatial resolution of 0.25 degree x 75 depth levels (Balmaseda et al., 2015; Zuo & Balmaseda, 2015; Zuo et al., 2015). Bilinear interpolation was used to
estimate the temperatures of each sampling site (e.g., Assis et al., 2016). An anomalously warm event (heat wave) was defined similarly to Hobday et al. (2016) as five or more days of temperatures warmer than the 90th percentile of a historical baseline climatology, which in our study was considered for the period 1993-2015. The climatology was defined relative to the time of year, using all data within an 11-day window centered on the time of year from which the climatological threshold was calculated. The high percentile threshold (e.g. 90%) was used rather than an absolute value above the climatological value as the magnitude of variability across a range of timescales varies considerably by region (Hobday et al., 2016).
Effect of blade removal on physiological responses: Comparison of entire individuals vs excised blades (Experiment 2)
In adult Macrocystis pyrifera sporophytes, photosynthesis is mostly performed at the canopy surface and the resulting products (mannitol and aminoacids) are translocated downwards to the youngest blades, meristems, holdfasts and sporophylls (Schmitz & Grant, 1979). As translocation in M. pyrifera is not fully understood, an experiment was designed in order to understand if individual responses to thermal stress (i.e. entire individuals, in this case small juveniles due to logistic constrains) differ from those of juvenile and adult excised blades. A total of 24 juveniles (smaller than 40 cm), 40 juvenile blades and 40 adult bottom blades from
M. pyrifera sporophytes were collected from the Campo Kennedy population, in the
South-center region. Two temperatures (16 and 24 ºC) and nutrients concentration (non-enriched and enriched PES-enriched SW) were used with 2 × replicates per treatment. We used a lower
10
number of juveniles to minimize any population impact caused by the removal of young sporophytes. Culture conditions were replicated from the first experiment (see above) and Fv/Fm measurements were taken every 12h using the diving PAM fluorometer using the same settings as in the first experiment.
Control of environmental carry-over effects: Comparison of F1 generation juvenile sporophytes (Experiment 3)
A third experiment was designed in order to assess the ecophysiological responses of first filial (F1) generation sporophytes to thermal stress given a common growth history in vitro. Gametophytes developed from spores released from 10 fertile sporophylls per population used in Experiment 1were grown vegetatively in 500 mL Erlenmeyer flasks with 4 mL·L-1 of PES (Anderson, 2005)without iron, 35 ppm salinity, 20 μE· m-2·s-1 red light (LEE filters, #026 bright red) and aeration at 15ºC.
On February 2017 a gametophyte mass from each population was manually separated into the smallest pieces possible using forceps. The fragments were seeded onto a spool of cotton filament and left for 2h in air under cool (15ºC) and humid conditions to allow attachment. Seeded spools for each population were then placed separately into 20 L tanks with aerated seawater (SW) and weekly increasing concentrations of PES (6, 10, 15, 20 mL·L-1) containing iron. Incubations proceeded under white light (20, 40 60 80 μE· m-2·s-1) and 14:10 h light:dark cycle. Seawater and tanks were changed/cleaned weekly to maintain optimal culture conditions. When sporophytes were ca. 1 cm length they were gently removed from the line using forceps and grown detached with aeration (see Westermeier et al., 2006) in the same 20 L tanks. When sporophytes reached 6 to 10 cm they were transferred to the experimental setup. This constituted a temperature gradient (15, 17, 19 and 21ºC) in PES-enriched SW, with 3 replicates of 5 sporophytes per final temperature. A 24 h ramp between each temperature increase was used to avoid excessive stress on the small juvenile sporophytes. All individuals were initially at 15ºC, at 24 h all individuals were transferred to 17ºC except the 15ºC treatment, and so on up to 21ºC.
11
Rapid light curves (RCLs) were performed every 24 h for 5 days using a diving PAM. Experimental conditions were: 10 L tanks with aeration, SW with 20 mL·L-1 PES with iron, 80 μE· m-2·s-1 white light and 14:10 h light:dark cycle. Diving PAM settings for the RLCs were adjusted for the lower light conditions in the laboratory: light curve intensity (LC-INT = 2), duration of each step (LC-WIDTH = 10 s) and actinity light list for each step (0, 5, 18, 30, 42, 69, 97, 133 and 195 µmol.m-2.s-1). All individuals were flash-frozen in liquid nitrogen after 120 h. An additional 15 individuals were also flash-frozen at the beginning and another 15 at the end of the experiment for a transcriptomic baseline. Due to sporophyte growth problems in one of the NC populations and no sporophyte recruitment in one of the S populations, these two regions only had one replicate population. The 17ºC treatment and the NC region at 24 h were removed from the data analysis as temperature fluctuations were recorded in the 17ºC culture chamber, resulting in inconsistent ecophysiological responses and potentially compromising the data analysis and interpretation.
Statistical analyses of experimental data
In order to assess ecophysiological responses to temperature and nutrients in M. pyrifera from different regions, generalized linear models were used (GLMs; McCullagh & Nelder, 1989).
Experiment 1) - Adult blades: Four levels of the factor “Region” (N, NC, SC, and S), three
levels of the factor “Temperature” (15, 20 and 24ºC), two levels of the factor “Nutrients” (PES-enriched and non-enriched SW) and two levels of the factor “Depth” (surface and bottom) were used as fixed effects. The response variables were minimum saturating irradiance (Ek), maximum potential relative ETR (rETRmax) and the photosynthetic rate in light-limited region of RLC (α), and the maximum quantum yield of PSII (Fv/Fm). All parameters were estimated from the rapid light curves (computed with rPackage phytotools (Silsbe & Sairah, 2015, CRAN repository), by fitting the model of Platt et al (1980). Analysis of variance (ANOVA) and post-hoc tests (Tukey Honest Significant differences (HSD)) were used to analyze the differences amongst treatments using R software (R Development Core Team, 2008). Fv/Fm and α were square root transformed to approximate residuals to a normal distribution. Since only a short acclimation period was possible, and to minimize any effects
12
of transportation on physiological responses, data from the RLCs were analyzed at the end point of the respective temperature treatments.
Experiment 2) - Entire individual vs removed blade: ANOVA and post-hoc tests (Tukey HSD)
were used to analyze the difference between treatments using Fv/Fm as the variable for two levels of factor “Temperature” (16 and 24ºC), two levels of the factor “Nutrients” (PES-enriched and non-(PES-enriched seawater) and three levels of factor “Tissue” (juvenile, juvenile blade and adult blade). Fv/Fm was square rooted transformed and the GLMs fitted using the Gaussian family (highest AIC) and resulting residuals were approximate to the normal distribution.
Experiment 3) - F1 generation juvenile sporophytes: Four levels of the factor “Region” (N,
NC, SC and S), three levels of the factor “Temperature” (15, 19 and 21ºC) and two levels of the factor “Nutrients” (PES-enriched and non-enriched SW) were used as fixed effects with the response variables α, Ek, ETRmax (estimated by the Diving PAM software Win-Control 3, Walz GmbH, Effeltrich, Germany) and Fv/Fm. GLMs were fitted using the Gaussian family distribution for all variables(selected by AIC comparison with the available distributions for R). The variable Fv/Fm wassquare root transformed and residuals were approximate to the normal distribution. Analysis of variance (ANOVA) and Tukey (HSD) were used to analyze the differences amongst treatments using R software (R Development Core Team, 2008). For the first and third experiments, we used populations within the same region as a replicate for that region.
13
Results
Common-garden experiment comparing adult blades (Experiment 1)
Our results showed that Macrocystis pyrifera blades from all regions performed well at 15ºC and 20ºC but were rapidly stressed at 24ºC. At this temperature, more than 88 % of the blades had lower mean Fv/Fm values compared with the other treatments. At 24ºC there was tissue degradation (e.g. necrotic tissue and loss of pigmentation) and mucilage production. Therefore, the experimental treatments at this temperature had to be terminated earlier while at the other temperatures the blades remained in culture in good condition. Rapid light curves (RLCs) parameters (α, Ek and rETRmax) and Fv/Fm measured at the end point of each temperature treatment confirmed that 24ºC treatment rapidly stressed M. pyrifera blades (Fig. 3). Since no main effect or interactions involving nutrients were detected, non-enriched and PES-enriched treatments were combined for the plots in Figure 3.
14 Surface Bottom 0.3 0.4 0.5 0.6 0.7 0.8
North North-Center South-Center South
Fv/Fm 0.3 0.4 0.5 0.6 0.7 0.8
North North-Center South-Center South
Fv/Fm 15°C 20°C 24°C 0.4 0.5 0.6 0.7 0.8
North North-Center South-Center South
α 0.4 0.5 0.6 0.7 0.8
North North-Center South-Center South
α 15°C 20°C 24°C 0 30 60 90 120 150
North North-Center South-Center South
rETRmax 0 30 60 90 120 150
North North-Center South-Center South
rETRmax 15°C 20°C 24°C 70 90 110 130 150 170
North North-Center South-Center South Ek 70 90 110 130 150 170
North North-Center South-Center South
Ek 15°C
20°C
15
Figure 3: Maximum quantum yield of PSII (Fv/Fm), photosynthetic rate in light-limited region of RLC (α),
relative maximum electron transport rate (rETRmax) and minimum saturating irradiance (Ek) mean values (±
mean standard error) for 3 temperatures (15, 20, 24ºC) and 4 regions (North, North-Center, South-Center and South) of adult blades over time. Different letters indicate significant differences among temperatures within each region and variable using Tukey HSD.
Maximum quantum efficiency of PSII (Fv/Fm)
Decreasing values of Fv/Fm can provide a rapid indication of stress affecting PS II in the dark-adapted state. With Fv/Fm as response variable, ANOVA indicated signification interactions due to Region x Temperature, Temperature x Depth and Region x Depth (Table 1).
The interaction between Region x Temperature revealed significant differences between regions in the response to thermal stress: In the N, NC, and SC regions, Fv/Fm was lower at 24ºC than at either 20ºC or 15ºC (and attributable mainly to stress in surface blades), but in the S region significantly lower Fv/Fm was only detected between 24ºC and 15ºC (p = 0.040). The region differences were clear when responses at 24ºC between regions at 24ºC were considered; Fv/Fm was higher at 24ºC in the S versus either SC or NC regions (p = 9.5 x 10⁻⁵ and 2.3 x 10⁻⁶, respectively), but was marginally insignificant between S and N regions (p = 0.066).
Post-hoc tests (Tukey HSD) indicated that the interaction between Temperature x Depth (i.e., surface and bottom blades) was due to greater resilience of Fv/Fm in bottom blades at 20ºC and 24ºC (p = 0.001929 and p < 0.0001, respectively), while in 15ºC control conditions no differences in blade sampling depth were detected (p > 0.25).
Finally, the interaction between Region x Depth was due to significant contrasts involving surface blades between regions; more specifically Fv/Fm in NC surface blades was lower overall than in all other regions (NC < N, p = 0.00136; NC < SC, p = 0.00027; NC < S, p = 8 x 10⁻⁷). In addition, bottom blades had significantly greater Fv/Fm than surface blades in the N and NC regions, but not in the SC or S (Fig. 3).
16
Light-limited photosynthetic rates (α)
Analysis of α values revealed a significant interaction between Region x Temperature x Depth and post-hoc tests (Tukey HSD) highlighted that regional differences regarding the response to thermal stress (24ºC) were due to significantly higher α values on the S region surface blades compared to NC and SC regions (p = 7.19 x 10⁻⁵ and p = 2.82 x 10⁻⁵, respectively) as other interactions were non-significant (p > 0.275). The response to thermal stress of the S region surface blades showed surprising stress tolerance, as all post-hoc tests between surface blades at 24ºC and either 15 or 20ºC temperatures were non-significant (p > 0.742), indicating that α was little affected over this temperature range. The same contrasts were significant for all other regions (p ≤ 0.00023 in all cases). Also all regional comparisons between the 24ºC treatments for the bottom blades were non-significant (p ≥ 0.698). The effect of the 24ºC surface blades on the interaction was also attested by the analysis of the α values between and within the 15ºC control and 20ºC that showed no significant differences between or within depths considering all possible regional combinations (total 120 combinations) with only one residual significant value (p = 0.046) . Because both α and Fv/Fm represent aspects of photosynthetic efficiency (Kirk, 2011), the values reported were quite similar among temperatures within each region (Fig. 3).
Maximum electron transport rate (rETRmax)
Blades from all regions (exception for the S region surface blades) followed the same pattern in both depths as rETRmax values were higher at 20ºC, indicating increased photosynthetic performance when exposed to 20ºC and photosynthetic inhibition by thermal stress when exposed to 24ºC (Fig. 3).The post-hoc analysis of the interaction Region x Depth indicated that the significant regional differences were cause by significantly lower values in NC surface blades compared to other regions from the same depth (NC < N, p < 0.001; NC < SC,
p = 0.002; NC < S, p < 0.001); no significant contrasts were found between regions when
analyzing the blades collected from the bottom (p > 0.257). Treatment temperatures (e.g. 15, 20 and 24ºC) differed significantly, with 18.5% and 29.5% higher rETRmax values in blades at 20ºC, when compared to 15ºC and 24ºC, respectively (p < 0.001) and 11% higher at 15ºC
17
than at 24ºC (p < 0.001). Again, the S region surface blades showed tolerance to thermal stress (i.e. 24ºC) with no significant differences in rETRmax compared at 24ºC compared with 20ºC and 15ºC (Fig. 3) (p = 1.000).
Minimum saturating irradiance (Ek)
The ANOVA analysis of Ek for adult blades showed a significant main effect for Temperature, and a significant interaction between Region x Depth (i.e., blade type). The patterns of the response were similar to ETRmax with a clear peak at 20ºC for the majority of the regions (Fig. 3). The Region x Depth interaction (Table 1) resulted from significantly lower Ek values in NC surface blades (96.3) compared to the N (130.4407), SC (124.069) and S (134.25) regions (all p ≤ 0.001) and no significant differences were found between surface blades for the other 3 regions (p > 0.824). Regional comparisons for Ek in bottom blades were non-significant (p > 0.438). At 20ºC, Ek values were 19.6% and 20.8% higher overall compared to 15ºC and 24ºC, respectively (p < 0.001 for both comparisons), while no significant differences were found between 15ºC and 24ºC (p = 0.783). This result clearly demonstrates the thermal dependence of Ek with a peak near 20ºC in N, NC, and SC regions. In contrast, Ek for S region surface blades was temperature independent across the thermal range tested, with no significant differences detected (all p = 1.000; Fig. 3). The thermal dependence of both Ek and ETRmax is expected, since they are governed by the rate of enzymatic processes, and our results suggest that S region blades were better able to adjust photosynthetic rates across a broad temperature range between 15-24ºC, in contrast to surface blades from more northerly regions.
The overall picture that emerged was that the NC region (Santa Barbara, Southern CA) was particularly sensitive to thermal effects on Fv/Fm, particular for surface blades. Overall, bottom blades showed greater resilience than surface blades. There was also a clear tendency in the S region towards thermal stress resilience, followed, surprisingly, by N regional populations (Santa Cruz, Central CA).
18
Table 1: Four-way ANOVA for the effects of Region, Temperature, Nutrients and Depth on the maximum
quantum yield of PSII (Fv/Fm), photosynthetic rate in light-limited region of RLC (α), maximum electron
transport rate (ETRmax) and minimum saturating irradiance (Ek) mean values of adult blades. Significant
p-values are marked in bolt.
Fv/Fm Factor df SS MS F p-value Region 3 0.063 0.021 8.268 < 0.001 Temperature 2 0.488 0.244 96.204 < 0.001 Nutrients 1 0.002 0.002 0.646 0.422 Depth 1 0.138 0.138 54.239 < 0.001 Region:Temperature 6 0.044 0.007 2.867 0.010 Region:Nutrients 3 0.018 0.006 2.368 0.070 Region:Depth 3 0.072 0.024 9.524 < 0.001 Temperature:Nutrients 2 0.006 0.003 1.158 0.315 Temperature:Depth 2 0.031 0.015 6.058 0.003 Nutrients:Depth 1 0.001 0.001 0.366 0.545 Region:Temperature:Nutrients 6 0.022 0.004 1.459 0.191 Region:Temperature:Depth 6 0.020 0.003 1.331 0.242 Region:Nutrients:Depth 3 0.008 0.003 1.038 0.376 Temperature:Nutrients:Depth 2 0.006 0.003 1.095 0.336 Region:Temperature:Depth:Nutrients 6 0.018 0.003 1.174 0.319 α Factor df SS MS F p-value Region 3 0.016 0.005 4.265 0.010 Temperature 2 0.277 0.138 110.182 < 0.001 Nutrients 1 0.000 0.000 0.006 0.939 Depth 1 0.074 0.074 58.612 < 0.001 Region:Temperature 6 0.030 0.005 3.918 0.001 Region:Nutrients 3 0.002 0.001 0.545 0.652 Region:Depth 3 0.015 0.005 3.985 0.008 Temperature:Nutrients 2 0.005 0.003 2.056 0.130 Temperature:Depth 2 0.029 0.015 11.570 < 0.001 Nutrients:Depth 1 0.000 0.000 0.005 0.943 Region:Temperature:Nutrients 6 0.012 0.002 1.572 0.155 Region:Temperature:Depth 6 0.018 0.003 2.413 0.027 Region:Nutrients:Depth 3 0.002 0.001 0.504 0.680 Temperature:Nutrients:Depth 2 0.001 0.001 0.415 0.661 Region:Temperature:Depth:Nutrients 6 0.011 0.002 1.520 0.171
19 rETRmax Factor df SS MS F p-value Region 3 17909 5970 9.516 < 0.001 Temperature 2 60023 30012 47.839 < 0.001 Nutrients 1 364 364 0.58 0.447 Depth 1 13760 13760 21.934 < 0.001 Region:Temperature 6 3278 546 0.871 0.516 Region:Nutrients 3 228 76 0.121 0.948 Region:Depth 3 8223 2741 4.369 0.005 Temperature:Nutrients 2 592 296 0.472 0.624 Temperature:Depth 2 1148 574 0.915 0.402 Nutrients:Depth 1 94 94 0.15 0.699 Region:Temperature:Nutrients 6 3712 619 0.986 0.435 Region:Temperature:Depth 6 3916 653 1.04 0.399 Region:Nutrients:Depth 3 3495 1165 1.857 0.137 Temperature:Nutrients:Depth 2 286 143 0.228 0.796 Region:Temperature:Depth:Nutrients 6 7123 1187 1.892 0.082 Ek Factor df SS MS F p-value Region 3 26036 8679 7.816 < 0.001 Temperature 2 74820 37410 33.693 < 0.001 Nutrients 1 807 807 0.727 0.395 Depth 1 7284 7284 6.56 0.011 Region:Temperature 6 6562 1094 0.985 0.435 Region:Nutrients 3 551 184 0.165 0.920 Region:Depth 3 15432 5144 4.633 0.003 Temperature:Nutrients 2 264 132 0.119 0.888 Temperature:Depth 2 6577 3288 2.962 0.053 Nutrients:Depth 1 227 227 0.204 0.652 Region:Temperature:Nutrients 6 7125 1188 1.07 0.381 Region:Temperature:Depth 6 7887 1315 1.184 0.314 Region:Nutrients:Depth 3 7744 2581 2.325 0.075 Temperature:Nutrients:Depth 2 242 121 0.109 0.897 Region:Temperature:Depth:Nutrients 6 13871 2312 2.082 0.055
20
Oceanographic data
Short term climatology (2.5 months centered on the sampling day) showed a latitudinal gradient of temperature increase towards the south but with only small differences between the SC and NC regions, particularly during the days before the sampling day (vertical lines; Fig.4).
Figure 4: Daily mean seawater temperature (ºC) on the 4 regions (North, North-Center, South-Center, South),
at the surface (left) and 20m depth (right) centered on our sampling day (17/06/2017; vertical lines) using data collected from the Global Ocean Physics Reanalysis ECMWF ORAP5.0.
Previously to our sampling, the S region registered a continuous high temperature while the remaining regions presented a pattern of increasing temperatures. The NC region actually had higher temperatures than the SC region over several days prior to sampling, especially at 20m depth. Seawater (SW) temperatures at 20 m depth showed lower values when compared to the surface. On the sampling day, cooler 20 m SW had a mean difference to the warmer surface of between 2 and 3ºC. During the months following the sampling, a persistent pattern of water temperature increase was predominant in which 25ºC was reached in the S region by mid-September.
21
Temperature climatologies were compiled for the S region on the surface and bottom (20 m depth) over the last 22 years (Fig. 5)
a)
b)
Figure 5: Climatologies of the South region surface (a) and 20m depth (b) over the past 22 years. Marine heat
waves (MHWs) are marked in red (according to Hobday et al., 2016).
Marine heat waves (an anomalously warm event lasting five or more days, with temperatures warmer than the 90th percentile based on a 30-year historical baseline period [Hobday et al., 2016] greatly increased during the El Niño event the 1997-98, but also in 2014 and 2015 including during our sampling campaign (Table 4).
22
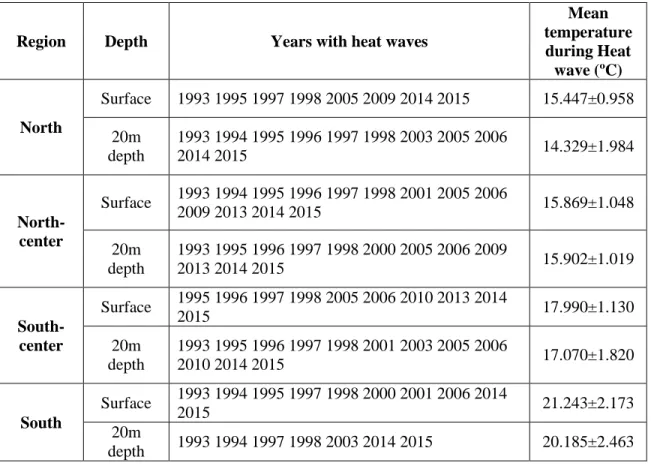
Table 2: Climatologies resume of the sampling sites (region) over the last 22 years for the seawater surface and
20m depth for the years with marine heat waves (MHW) and mean temperature (ºC) during MHWs.
Region Depth Years with heat waves
Mean temperature during Heat wave (ºC) North Surface 1993 1995 1997 1998 2005 2009 2014 2015 15.447±0.958 20m depth 1993 1994 1995 1996 1997 1998 2003 2005 2006 2014 2015 14.329±1.984 North-center Surface 1993 1994 1995 1996 1997 1998 2001 2005 2006 2009 2013 2014 2015 15.869±1.048 20m depth 1993 1995 1996 1997 1998 2000 2005 2006 2009 2013 2014 2015 15.902±1.019 South-center Surface 1995 1996 1997 1998 2005 2006 2010 2013 2014 2015 17.990±1.130 20m depth 1993 1995 1996 1997 1998 2001 2003 2005 2006 2010 2014 2015 17.070±1.820 South Surface 1993 1994 1995 1997 1998 2000 2001 2006 2014 2015 21.243±2.173 20m depth 1993 1994 1997 1998 2003 2014 2015 20.185±2.463
All regions registered MHW during 2014-15 in both depths which suggests recent increase on the frequency of these extreme events.
Comparison of entire individuals vs excised blades (Experiment 2)
The photosynthetic response (Fv/Fm) over time for three different types of blades (entire juveniles, excised adults and juvenile blades) to thermal and nutrient stress is shown in (Fig. 6).
23
Figure 6: Maximum quantum yield of PSII (Fv/Fm) mean values (± mean standard error) for 2 temperatures (16 and 24ºC) and 3 types (adult blade, juvenile blade and juvenile) on a) enriched seawater with PES (20 mL.L-1) and b) non-enriched seawater, over time.
24
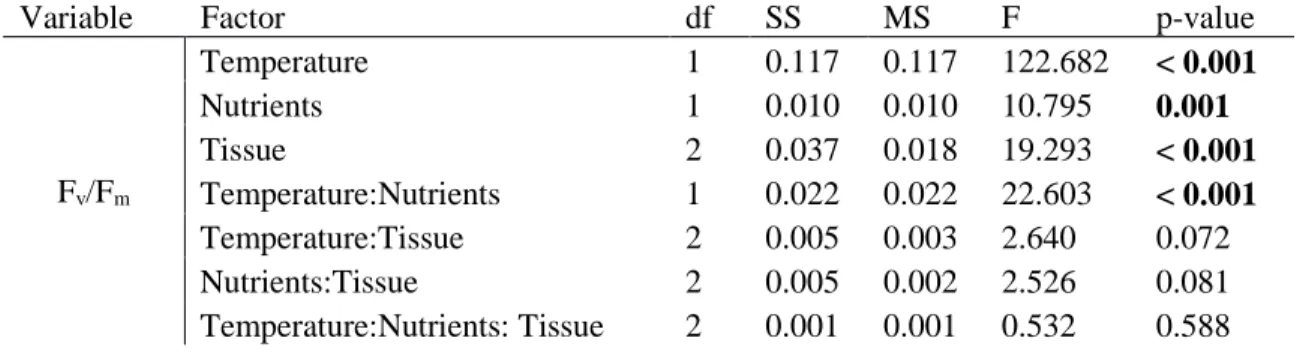
As in the previous experiment, blades and entire individuals at 16ºC showed rather constant Fv/Fm over time while exposure to 24ºC resulted in a rapid decrease, indicating a severe decline in PSII energy conversion efficiency. The ANOVA showed an interaction between Temperature x Nutrients and a significant main effect for the factor Tissue (Table 3). The post-hoc analysis (Tukey HSD) on the factor Tissue (i.e. juvenile, excised juvenile and adult blades) indicated no significant differences between the entire juvenile and the juvenile blade (p = 0.995), supporting the experiment design using excised blades in Experiment 1. Also in this analysis, significantly higher Fv/Fm values were found for adult blades (0.766) when compared with entire juvenile (0.737) and juvenile blade (0.736) (p = 0.0000065 and p = 0.0000001, respectively). Post-hoc tests (Tukey HSD) indicated that the interaction between Temperature x Nutrients was due to higher temperature as tissue at 24ºC in enriched SW had significant lower Fv/Fm values than 16ºC non-enriched and by nutrients when temperatures were at 24ºC (see Annex II for mean values and p-values). The only exception was between 16ºC enriched and 16ºC non-enriched where differences in Fv/Fm were non-significant (p = 0.848). This experiment supports the use of excised blades as surrogate for entire individuals for M. pyrifera and that high temperature (24ºC) in conjugation with low nutrients availability affects this species ecophysiological response, while having no effect at lower (non-stressful) temperatures (16ºC), at least for 72h.
Table 3: Three-way ANOVA for the effects of Temperature, Nutrients and Type on the maximum quantum
yield of PSII (Fv/Fm) mean values. Significant p-values are marked in bolt.
Variable Factor df SS MS F p-value
Fv/Fm Temperature 1 0.117 0.117 122.682 < 0.001 Nutrients 1 0.010 0.010 10.795 0.001 Tissue 2 0.037 0.018 19.293 < 0.001 Temperature:Nutrients 1 0.022 0.022 22.603 < 0.001 Temperature:Tissue 2 0.005 0.003 2.640 0.072 Nutrients:Tissue 2 0.005 0.002 2.526 0.081 Temperature:Nutrients: Tissue 2 0.001 0.001 0.532 0.588
25
Comparison of F1 generation juvenile sporophytes (Experiment 3)
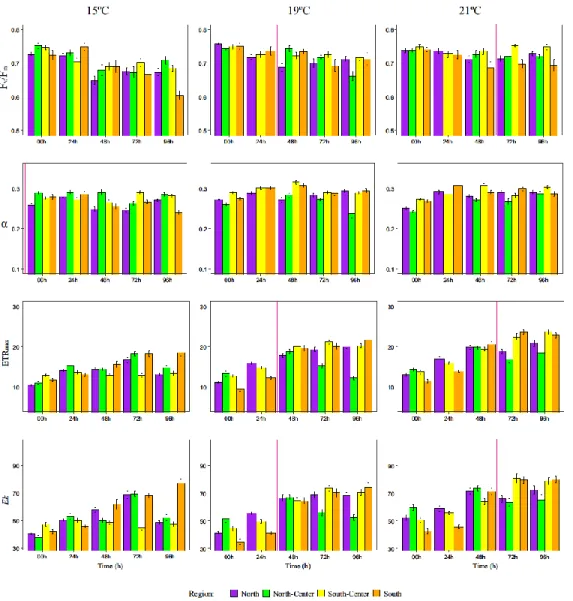
F1 generation juvenile sporophytes of M. pyrifera grown in vitro and exposed to a thermal gradient over a 5-day simulated heat wave (15, 19 and 21ºC) showed few region-specific patterns of stress induced by temperature increase, based on photosynthetic response parameters (Fv/Fm and the RLCs parameters α, ETRmax and Ek; Fig. 7).
Figure 7: Maximum quantum yield of PSII (Fv/Fm), photosynthetic rate in light-limited region of RLC (α),
maximum electron transport rate (ETRmax) and minimum saturating irradiance (Ek) mean values (± mean
standard error) for 3 temperatures (15, 19, 21ºC) and 4 regions (North, North-Center, South-Center and South) of F1 juvenile sporophytes over time. Vertical red line indicates the starting point for each temperature (time point when sporophytes were at that specific temperature for 24h). Different letters indicate significant differences among regions within each sampling time (00, 24, 48, 72 and 96h) for each temperature using Tukey HSD. North-Center region data at 24h on 19 and 21ºC was removed due to values inconsistences.
26
Maximum quantum efficiency of PSII (Fv/Fm)
Values for Fv/Fm in F1 juvenile sporophytes increased with increasing temperature as by the last sampling time (96 h) sporophytes at 21ºC had higher Fv/Fm (0.725) when compared with the control (15ºC) (0.671) although this increase was only significant for the SC region (p = 0.006) (Fig. 7). The interaction Region x Temperature (Table 4) was analyzed with post-hoc tests (Tukey HSD), which showed that within the same temperature, significant regional differences were only found at 21ºC, in which the S region had significant lower Fv/Fm values (0.670) compared to N (0.721) and SC (0.749) regions (p = 0.021 and p = 0.0000042, respectively), but was not significantly different to the NC region (0.719; p = 0.087).
Light-limited photosynthetic rates (α)
The photosynthetic efficiency of juvenile F1 sporophytes as assessed from the initial slope of ETR vs. irradiance curves (α). With α as response variable, post-hoc tests on the interaction Region x Temperature reveled significant differences within temperature treatments, but in contrast to Fv/Fm no differences were found at 21ºC (all p > 0.252), but only at 19ºC and 15ºC. At 15ºC α values from the N region sporophytes (0.260) were significantly lower than either the NC (0.273) or SC (0.277) regions (p = 0.00043; p = 0, respectively), while SC had significantly greater α than the S region (0.266, p = 0.0097456). All regions showed a significant increase in α values at 21ºC compared with controls at 15ºC (S > 9%, p = 0.001; SC > 4.9%, p = 0.011; N 11.2%, p = 0) except for NC region (> 1.1%, p = 0.999).
Maximum electron transport rate (rETRmax)
An increase of ETRmax values with temperature and also time was observed during the experiment (Fig. 7). The analysis of the interaction Region x Temperature indicated a significant increase of regional differences with increasing temperature within the same region as ETRmax values were significantly higher at 21ºC compared to the 15ºC control (N > 33.4%; NC > 17.9%; SC 43%; S > 42%) (p < 0.0000322). All regional contrasts at 21ºC
27
differ significantly (p < 0.044) except for S-SC regions (p = 0.972) but at 15ºC significant differences were only found between NC region and the N and SC regions (p = 0.034 and 0.014, respectively). At 21ºC the sporophytes from S and SC regions showed significant higher ETRmax (24.01 and 22.96, respectively) compared with NC and S regions (17.55 and 19.79, respectively) (p < 0.004).
Minimum saturating irradiance (Ek)
F1 sporophyte Ek values followed a similar pattern to ETRmax as the Region x Temperature interaction pointed again to significant contrasts at higher temperatures, with tissue within each region at 21ºC showing Ek mean values 31% greater overall than 15ºC control (all p ≤ 0.002). Regional differences were also higher at 21ºC as northern regions showed significantly lower Ek values (N = 68.8 and NC = 63.88) compared with the southern regions (SC = 79.49 and S = 82.40; all p ≤ 0.001). No significant differences were found within the groups (N-NC, p = 0.836 and SC-S, p = 0.999). At 15ºC, a strong reduction in Ek was observed at 96 h, but interestingly S region sporophytes Ek values continued to increase, being at least 32.33% higher than the other regions.
Table 4: Two-way ANOVA for the effects of Region and Temperature on the maximum quantum yield of PSII
(Fv/Fm), photosynthetic rate in light-limited region of RLC (α), maximum electron transport rate (ETRmax) and
minimum saturating irradiance (Ek) mean values of F1 juvenile sporophytes. Significant p-values are marked in bolt.
Variable Factor df SS MS F p-value
Fv/Fm Region 3 0.033 0.011 9.577 < 0.001 Temperature 2 0.009 0.004 3.771 0.023 Region:Temperature 6 0.024 0.004 3.502 0.002 α Region 3 0.049 0.016 28.820 < 0.001 Temperature 2 0.087 0.043 76.160 < 0.001 Region:Temperature 6 0.037 0.006 10.730 < 0.001 ETRmax Region 3 426 142 15.650 < 0.001 Temperature 2 12133 6066 668.050 < 0.001 Region:Temperature 6 1232 205 22.610 < 0.001 Ek Region 3 2460 820 5.216 0.0014 Temperature 2 107682 53841 342.405 < 0.001 Region:Temperature 6 11060 1843 11.722 < 0.001
28
Discussion
Regional differences and potential for local adaptation
The results of our common garden experiment clearly showed that populations of M. pyrifera at the southernmost limit of the species distribution in the northern hemisphere displayed greater thermal tolerance in their photosynthetic physiology. This suggests an important effect of the highly selective thermal conditions of the southernmost kelp habitat. This better performance of South (S) region populations was more clearly seen in the blades collected at the water surface, which were able to maintain similar maximum electron transport rate (ETRmax) values at temperatures between 15-24ºC, and in contrast to more northerly populations. The rather clear patterns of thermal tolerance in the S region surface blades was much less evident in blades from deeper waters (bottom blades), the responses of which were rather similar between regions.
Given the constraints of the experiment, in particular the short pre-acclimation period, these differences can either be attributed to intrinsic (i.e., genetically-determined) variation, or to plasticity induced by an environmental history of higher temperatures in southern surface waters (up to 20ºC; Fig. 4). Wave height increase might also have impacted the kelp forests of the south region as the hurricane Blanca, the second of the season, moved near the populations two weeks before our sampling campaign. In the field, the southern population (Bahia Tortugas) had a lower canopy cover (sparse distribution of individuals) and showed signs of greater stress (lower pigmentation, damaged tissue) compared with populations in more northern regions. The differences observed between the S and SC regions are all the more intriguing given that genetic analysis with microsatellites (neutral genetic markers) indicated that these two regions form a single genetic cluster (Johansson et al., 2015). We conclude that, while the results are consistent with local genetic adaptation, this hypothesis will require further analysis and confirmation via the transcriptomes extracted from the individuals across the experiments, particularly those derived from the F1 generation cultured
29
Individuals from the North-Center (NC) region showed a consistently poor photosynthetic response to thermal and nutrients stressors compared with other regions using both acclimated field-collected blades (Experiment 1) and in vitro F1 sporophytes (Experiment 3). As F1 juveniles were grown in common-garden laboratory conditions, the effects of environmental history can safely be excluded (assuming no or limited carry-over across generations and life-history phases). It can therefore be concluded that the NC populations are intrinsically less able to cope with stress conditions due to genetic factors. A possible reason might be elevated levels of self-fertilization and inbreeding in NC populations. Previous studies in the Santa Barbara bay area showed that self-fertilization greatly reduced
M. pyrifera fitness (survival to adulthood, zygote production, development of reproductive
structures and fecundity) (Raimondi et al., 2004) . The study of Johansson et al., (2013) reported a high self-fertilization rate (32-44%) and strong correlation between inbreeding depression and mortality. Although this hypothesis requires an objective study and analysis at the regional level, our results suggest that reproductive strategies and constraints such as inbreeding and self-fertilization may be important factors regulating regional differences underlying local population dynamics.
The North (N) and South-Center (SC) regions adult blades showed similar intermediate photosynthetic responses to stress conditions with no significant differences between them (Table 1, Fig. 3). N region blades from both depths were in very good conditions, with almost no tissue damage or mucilage production and good pigmentation which might reflect local field conditions prior to our experiment as SW temperatures were below 15ºC in the area. The good ecophysiological conditions might have contributed to the increase of photosynthetic efficiency of surface blades (α) compared to the other regions but Fv/Fm and ETRmax were lower than the S region, suggesting greater stress on the photosynthetic apparatus. The N region kelp forests are located ~ 300 km north of the phylogeographical break of Point Sal (Johansson et al., 2015), 50Km north of the biogeographic break of Point Conception, a boundary characterized by a 5ºC north-south temperature gradient caused by the interaction of the cold California current with the California Eddy (Burton, 1998; Eberl
et al., 2013). The mean surface temperature during a MHW over the last 22 years is 15.447ºC
± 0.958 in this region. This suggests that these populations are not exposed to the same level of thermal/nutrient stress experienced by the southern regions, and may putatively be less
30
able to cope with such stresses. Our regional analysis did not, however, show a clear latitudinal gradient of ecophysiological response of the giant kelp to thermal and nutrient stresses, which could be due to several factors: heterogeneity of oceanographic/atmospheric processes (Pacific decadal oscillation (PDO), El Niño and La Niña, California current, California Eddy, upwelling areas, internal waves) (Burton, 1998; Fram et al., 2008; Ladah et
al., 2012 ; Newman et al., 2016; Jacox et al., 2016) , or, as suggested by other authors, or
by more local processes that interact at a smaller (population) scales such as competition, dispersal and reproduction, wave exposure, dispersal, forest depth and density (Dayton, 1999; Edwards, 2004; Edwards & Hernández-Carmona, 2005; Cavanaugh et al., 2011; Cavanaugh et al., 2013; Johansson et al., 2015). Thus, in order to understand and predict possible implications of climate change on M. pyrifera forests on a regional level, further studies should focus on understanding the fundamental processes that act locally and how they interact with larger scale processes.
Thermal limits
This study showed that at 24ºC adult blades from almost all regions of Macrocystis pyrifera studied showed a strong decline in ecophysiological responses. However, the exception was surface blades from the southernmost region, which did not follow general trends with respect to temperature-sensitive photosynthetic parameters Ek and rETRmax. While Fv/Fm and the slope of electron transport rate with increasing irradiance (α) showed a similar pattern of photosynthetic rate decrease with increasing temperature, rETRmax and Ek increased from 15 to 20 ºC followed by a decrease at 24 ºC. This temperature trend is typical of rate-limited enzymatic processes in, e.g., Calvin cycle enzymes such as RuBisCO (Kirk, 2011). When temperature was increased to 24ºC the thermal optimum for photosynthesis was exceeded and the entire network was affected. The exception to this pattern was the S region surface blades in which ETRmax an Ek did not differ between 15 and 24ºC, suggesting either pre-acclimation or adaptation to local conditions with warmer SW temperatures.
It appears that the thermal limits of photosynthetic performance were not exceeded in Experiment 3 using F1 juvenile sporophytes, in which 21ºC was the maximum exposure temperature. It is also possible that the use of gradual thermal ramping may have alleviated