Department of Information Science and Technology
Multimodal Emotion Recognition
Pedro Coelho Grácio da Silva
A Dissertation presented in fulfillment of the Requirements for the Degree of
Master in Telecommunications and Computer Science Engineering
Supervisor:
Miguel Sales Dias, PhD, Invited Associate Professor at ISCTE-IUL EPFL
Co-Supervisor: João Freitas, Phd, Microsoft
“Knowledge is power”
v
Abstract
Reading emotions from facial expression and speech is a milestone in Human-Computer Interaction. Recent sensing technologies, namely the Microsoft Kinect Sensor, provide basic input modalities data, such as RGB imaging, depth imaging and speech, that can be used in Emotion Recognition. Moreover Kinect can track a face in real time and present the face fiducial points, as well as 6 basic Action Units (AUs).
In this work we explore this information by gathering a new and exclusive dataset. This is a new opportunity for the academic community as well to the progress of the emotion recognition problem. The database includes RGB, depth, audio, fiducial points and AUs for 18 volunteers for 7 emotions. We then present automatic emotion classification results on this dataset by employing k-Nearest Neighbor, Support Vector Machines and Neural Networks classifiers, with unimodal and multimodal approaches. Our conclusions show that multimodal approaches can attain better results.
Keywords: Emotions, automatic recognition, 3D camera, multimodal, audio, video, depth.
vii
Resumo
Ler e reconhecer emoções de expressões faciais e verbais é um marco na Interacção Humana com um Computador. As recentes tecnologias de deteção, nomeadamente o sensor Microsoft Kinect, recolhem dados de modalidades básicas como imagens RGB, de informaçãode profundidade e defala que podem ser usados em reconhecimento de emoções. Mais ainda, o sensor Kinect consegue reconhecer e seguir uma cara em tempo real e apresentar os pontos fiduciais, assim como as 6 AUs – Action Units básicas. Neste trabalho exploramos esta informação através da compilação de um dataset único e exclusivo que representa uma oportunidade para a comunidade académica e para o progresso do problema do reconhecimento de emoções. Este dataset inclui dados RGB, de profundidade, de fala, pontos fiduciais e AUs, para 18 voluntários e 7 emoções. Apresentamos resultados com a classificação automática de emoções com este dataset, usando classificadores k-vizinhos próximos, máquinas de suporte de vetoreseredes neuronais, em abordagens multimodais e unimodais. As nossas conclusões indicam que abordagens multimodais permitem obter melhores resultados.
Palavras-Chave:Emoções, reconhecimento automático,câmara3D, multimodal, áudio, vídeo, informação de profundidade.
ix
Acknowledgments
I would to express my gratitude to my advisor Miguel Sales Dias and João Freitas for their guidance and wise suggestions which improved my final work.
I would also like to give my regards to my colleagues, Filipe Gaspar, for his guidance, support and out of the box ideas on my work; to Nuno Pires, Marco Damião, Joana Silva, Tiago Serra, Nuno Mendes Martins and my family for helping me in all my academic route. I would also like to thank to all the people that in a good or bad way influence my life, myself and the way that I am today, namely Isa Estrela for always making me smile. You will always be in my heart.
xi
Contents
Abstract ... v Resumo ... vii Acknowledgments ... ix Contents ... xi List of Figures ... xvList of Tables ... xvii
List of Acronyms ... xix
1. Introduction ... 1
1.1 Motivation ... 2
1.2 Emotion Recognition Problem Space ... 3
1.2.1 Level of Description ... 3
1.2.2 Static versus Dynamic Expressions ... 6
1.2.3 Spontaneous versus Posed Expressions ... 6
1.2.4 Expression Intensity ... 6
1.2.5 Multimodal Information ... 7
1.2.6 Data Collection ... 8
1.2.7 Thesis Problem Statement ... 8
1.3 Thesis Hypothesis, Objectives and Contributions ... 9
1.4 Major Contributions ... 10
1.5 Structure of the Dissertation ... 10
2. Background and Related Work in Emotion Recognition ... 11
2.1 Visual Emotions ... 11
2.1.2 Visual Features ... 12
Geometric Feature Extraction ... 12
xii
Kinect Features ... 13
Distance Feature Extraction... 15
2.2 Speech Emotions ... 15
2.2.1 Frequency Speech Features ... 18
LPC ... 18
MFCC ... 18
2.3. Facial Expression Recognition and Classification ... 19
2.4 Related Work ... 21
Unimodal ... 21
Multimodal ... 21
3. Multimodal Data Collection ... 23
3.1 Dataset ... 23
3.2 Acquisition Setup ... 24
3.2.1 Acquisition data formats ... 24
3.2.2. Data Nomenclature and Folder Structure ... 24
3.2.3 Environment Conditions ... 24
3.2.4 Data Synchronization ... 25
3.3 Collection Description ... 26
3.4 Database Results ... 27
4. Emotion Recognition System: Methods, Results and Discussion ... 31
4.1 Methodology ... 31
4.1.1 Performance Evaluation ... 31
4.1.2 Feature Extraction... 31
4.1.3 Machine Learning Classifiers ... 33
4.2 Experiments ... 33
4.2.1 Experiment #1 – Full Dataset ... 35
xiii
4.2.3 Experiment #3 – Audio Features Experimentation ... 36
4.2.4 Experiment #4 – Sub Dataset ... 37
4.2.5 Experiment #5 – Features within Features ... 38
4.3 Emotion Classification Application... 39
4.4 Discussion ... 40
5. Conclusions and Future Work ... 41
5.1 Conclusions ... 41
5.2 Future Work ... 42
6. Bibliography ... 43
xv
List of Figures
Figure 1- Basic emotions as identified by Ekman and Friesen [13]. ... 3
Figure 2- Plutchik’s emotions model [21]. ... 4
Figure 3 - Prototypic expressions on real human faces [26]. ... 5
Figure 4 - Decision Level Classifier Architecture. ... 7
Figure 5 - Mixed Features Classifier Architecture. ... 8
Figure 6- Example of feature extraction [98]. (a) Input video frame. (b) Snapshot of the geometric tracking system. (c). Extracted texture map. (d) Selected facial regions for appearance feature extraction [43]. ... 12
Figure 7- Position of Action Units on human face[48]. ... 14
Figure 8 - Constrained Facial Features: Measured distances between selected landmarks generated by the face tracker. These distances are calculated in real time in relation to the neutral expression [49]. ... 15
Figure 9- Average pitch for male and female [61]. ... 17
Figure 10 - The typical structure of a recognition system. ... 20
Figure 11- Example of tracked points on Kinect (after feature selection) [47]. ... 21
Figure 12 - Room Configuration. ... 24
Figure 13- Synchronization device shown on the left part of the image. The device emits a sound at the same time a led in turned on, allowing for visual and audio signals synchronization. ... 25
Figure 14- Different volunteers while performing the Fear recording task. ... 27
Figure 15- Different volunteers while performing the Anger recording task. ... 27
Figure 16 - Different volunteers while performing the Disgust recording task. ... 28
Figure 17- Different volunteers while performing the Joy recording task. ... 28
Figure 18- Different volunteers while performing the Sadness recording task. ... 28
Figure 19- Different volunteers while performing the Surprise recording task. ... 29
Figure 20- Example figure of different features across time for one data sample – emotion anger, subject 1 and sentence 1. From top to bottom - a) AUs, b) Raw Audio Signal, c) Pitch, d) MFCC + RMS, e) LPC. Abscissa represents time in seconds. ... 32
Figure 21- AUs features across time for one data sample – emotion anger, subject 1, sentence 1. From top to bottom – a) AUs, b) Audio Signal. Abscissa represents time in seconds. ... 32
xvi
Figure 23 - Accuracy results for different k values, unimodal video and unimodal audio. ... 34 Figure 24 - Accuracy results for different values of hidden nodes, unimodal video and unimodal audio for NN. ... 34 Figure 25 - Example classification of correct predictions on unimodal video. ... 39 Figure 26 - Example classification of incorrect predictions on unimodal video. ... 39
xvii
List of Tables
Table 1- Recognition of facial expressions can be achieved by categorizing a set of such
predetermined features as in FACS [22]. ... 4
Table 2 - AUs Name, Avatar Illustration and Value Interpretation [47]. ... 14
Table 3 - Taxonomy of features commonly used for acoustic and linguistic emotion recognition [57]. ... 16
Table 4- Emotion and respective sentences. ... 26
Table 5 - Classification accuracy for experiment 1. ... 35
Table 6 - Classification results for experiment 2 (2 AUs), SVM and kNN Classifier. .. 35
Table 7 – Classification results for experiment 3, kNN. ... 36
Table 8 – Classification results for experiment 3, SVM. ... 36
Table 9 - Classification results for experiment 3, NN. ... 36
Table 10 - Classification results for experiment 4 using kNN, SVM and NN. ... 37
Table 11 - Classification results for experiment 5, unimodal audio and video, NN Classifier. ... 38
Table 12 - Classification results using all features and AUs + Pitch Measures, multimodal mixed features, Neural Networks Classifier. ... 38
xix
List of Acronyms
AFEA - Automatic Facial Expression Analysis AU – Action Unit
DCT - Discrete Cosine Transform FFT - Fast Fourier transform
HCI – Human-Computer Interaction
HCII - Human-Computer Intelligent Interaction HMM - Hidden Markov Models
kNN - k-Nearest Neighbors LPC - Linear Predictive Coding MFC - Mel-Frequency Cepstrum
MFCC - Mel-Frequency Cepstral Coefficients SU – Shape Unit
SVM - Support Vector Machine
1
1. Introduction
Human beings have always had the innate capability to recognize and distinguish between their fellow´s faces. With exception of fingerprints, facial expression is one of the most particular and distinguishable visible features of a person. Emotions enable humans to perceive how they feel about something. Recently, there has been a growing interest in the improvement of the Human-Computer Interaction (HCI) using natural modalities. In fact, it is argued [1] that to truly achieve effective human–computer intelligent interaction, computers need to be able to interact naturally with the user, similarly to the way that humans interact with each other. Humans interact mainly through speech, but interaction also occurs through single or both hands gesture and even full body gesture [2] (to emphasize certain parts of the speech or to convey sign language, for example), and via the display of emotions [3]. Emotions can be displayed visually or verbally through speech, and one of the most important ways humans display emotions is through facial expressions. For instance, humans can clearly identify fear and disgust in voice and joy and surprise in facial expressions. Therefore the recognition of facial expressions, specially to convey emotions, has raised considerable interest in the scientific community, with important applications in HCI, computer animation (virtual characters which convey emotions), surveillance and security, medical diagnosis, law enforcement, and awareness systems and therefore, it has been an active research topic in multiple areas such as psychology, cognitive science, human-computer interaction and pattern recognition in image processing [4]. Common uses of facial expression recognition are:
1. Intelligent entertaining systems for kids; 2. Interactive Computers;
3. Intelligent Sensors; 4. Social Robots.
In the field of HCI based on speech and language technology, recognition of emotional speech is also challenging [4]. An interdisciplinary related area is Affective Computing, which studies the development of systems and devices that can recognize, process and simulate human affections. Affection and emotion are not the same but are deeply related. Affective qualities include beauty, shape and structure – characteristics that
2
evoke emotions - while emotions include the different feelings a human being can have, such as anger, fear, repugnance, sadness, happiness and surprise.
A system with the capability of recognizing and understanding emotions, via the recognition of facial expressions or though the recognition of emotional speech, in the Human-Computer Interaction (HCI) process, would facilitate the interaction with users: it should be able to “perceive, interpret, express and regulate emotions” [5]. Recognizing the user’s emotional state is thus “one of the main requirements for
computers to successfully interact with humans” [6]. It would enable also
“differentiating between satisfaction and dissatisfaction of the user in a given
computer-aided task” [7]. The range of potential applications is vast: “emotion and paralinguistic communication, clinical psychology, psychiatry, neurology, pain assessment, lie detection, intelligent environments” [7]. For example, an affective system could “calm a
crying child or prevent strong feeling of loneliness and negative emotions”[8] and an
emotion recognition system could be used to help “autistic children to learn and elicit
emotional responses and could also help autistic children learn how to distinguish between emotions”[9].
1.1 Motivation
The research in this thesis comes in the framework of the European Union Marie Curie project GOLEM - Realistic Virtual Humans [9] and LIFEisGAME [10]. GOLEM is a researcher’s exchange program between companies and academia in Europe. In this case, the exchange program covers the Microsoft and Face in Motion, as companies, and the Universities of Porto in Portugal and of Zaragoza and Barcelona, in Spain. GOLEM will share knowledge in order to produce virtual (digital) characters.
The ability of socially and emotionally impaired individuals to recognize and respond to emotions conveyed by the face is critical to improve their communication skills. The LIFEisGAME project is showing how it is possible to apply a pioneer serious game approach to teach children with Autism Spectrum Disorder (ASD) to recognize facial emotions, using real time photo-realistic image synthesis and automatic facial expression analysis, in order to elicit emotional reactions from those children. This research comes in line with established theory in Psychology, where the social and emotional ability of impaired individuals to recognize emotions and respond to it, is critical in order to improve their communication skills [11].
3
1.2 Emotion Recognition Problem Space
1.2.1 Level of Description
Facial expressions can be described at different levels and two of the mainstream methods are facial affect (emotion) and facial muscle action (action unit) [7].The leading study of Ekman and Friesen [12]identified 6 basic emotions - angry, disgust, fear, happy, sad and surprise, plus a neutral state, as shown in Figure 1. Their studies suggest that each of this basic emotion corresponds to a basic prototypical facial expressions recognized universally.
Figure 1- Basic emotions as identified by Ekman and Friesen [13].
Plutchik’s Model [8] is a more complex model for emotions. It describes the relation between emotional concepts, has intensity (from the center to the perimeter, color fades) (Figure 2) and considers the existence of eight primary emotions -anger, fear, sadness,
disgust, surprise, anticipation, trust and joy. It also has more complex mixed emotions (colorless emotions), which are the combination of two primary ones. Psychologists suggest that some basic emotions are universally displayed and recognized from facial expressions and the most commonly used are the six basic emotions from Ekman and Friesen [14]. This is also reflected in the research on automatic facial expression analysis; most facial expression analysis systems developed so far target facial affect analysis and attempt to recognize a set of prototypic emotional facial expressions [15; 16].There have also been some efforts to detect cognitive and psychological states like interest [17], fatigue [18] and pain [19][20].
4
Figure 2- Plutchik’s emotions model [21].
Ekman and Friesen produced a system called Facial Action Coding System or FACS[12] which describes and enumerates “action units” (AU). These AUs describe all facial movement visually distinguishable which cause facial movements. There are 46 AUs in FACS (Table 1) that account for changes in facial expression .The combinations between
different AUs result in different and possible expressions. Table 1 shows different AUs and their associated facial action based on FACS.
Table 1- Recognition of facial expressions can be achieved by categorizing a set of such predetermined features as in FACS [22].
Although Ekman and Friesen proposed that specific combinations of FACS action units represent prototypic expressions of emotion [7] (Figure 3), emotion-specific expressions
5 are not part of FACS, though it is possible to map AUs onto the basic emotions using a finite number of rules [23]. Separate systems, such as the emotional facial action system (EMFACS) [24] do such coding, as FACS by itself just describes actions of the face, not the meaning of a set of AUs. By using EMFACS, face images may be coded for emotion expressions as well as for more categories of positive or negative emotion [25]. In his work Paul Ekman has also identified a set of facial features, which characterized an expression of each basic emotion (Figure 3).
Figure 3 - Prototypic expressions on real human faces [26].
Sadness – inner corner of eyebrows are raised, eyelids are loose and lip corners are pulled down.
Happiness – muscle around the eyes are tightened, crow’s feet wrinkles appears around eyes, cheeks are raised and lip corners are raised diagonally.
Fear – eyebrows are pulled up and together, upper eyelids are pulled up and mouth is stretched.
Surprise – entire eyebrows are pulled up, eyelids are also pulled up and mouth is widely open.
Anger – eyebrows are pulled down, upper lids are pulled up, lower lids are pulled up and lips may be tightened.
Disgust – eyebrows are pulled down, nose is wrinkled and the upper lip is pulled up.[27]
6
1.2.2 Static versus Dynamic Expressions
Many existing works attempt to analyze facial expressions in each image. Although facial expressions can be detected in a snapshot, psychological experiments [28] suggest that the dynamics of facial expressions are crucial for successful interpretation of facial expressions. Without any deliberate posing, differences between facial expressions are conveyed more powerfully by dynamic transitions between emotional state rather than a single state represented by a still image [29]. Therefore is very important to capture and analyze temporal dynamic facial expressions. Recently many approaches have been introduced to model these dynamic facial expressions in videos or sequences of images [30] [31].
1.2.3 Spontaneous versus Posed Expressions
Most of the existing academic research uses data that was collected by asking the subjects to deliberately pose facial expressions. These exaggerated facial expressions rarely occur in real-life situations [4]. Although professional actors may carry out this task with great success, spontaneous facial expressions induced in natural environments are subtle and fleeting (such as tightening of the lips in anger or lowering the lip corners in sadness [22]), spontaneous facial expressions differ from posed expressions both in terms of which muscles move and how they move dynamically, posed expressions differ in appearance and timing from spontaneous ones [32].
1.2.4 Expression Intensity
FACS system uses a 5-point intensity scale to describe intensity variation of action units [22]. Explicit analysis of expression intensity variation is essential for distinguishing between spontaneous and posed facial behaviors [33]. Expression intensity estimation is necessary and helpful for accurate assessment of facial expressions because a distinct emotional state of an expresser cannot be correctly perceived unless the expression intensity exceeds a certain level and methods that work for intense expressions may generalize poorly to subtle expressions with low intensity[4].
7
1.2.5 Multimodal Information
Academic works on emotion recognition can be usually divided into three main groups: Unimodal, face based or speech based recognition systems.
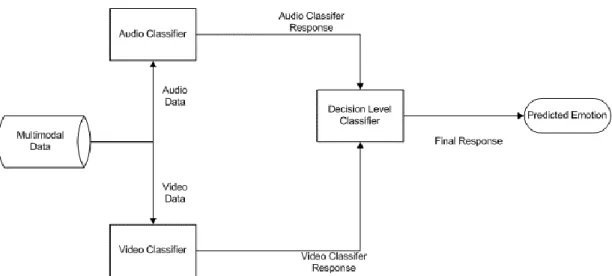
Multimodal systems that combine unimodal approaches at decision level (Figure 4).
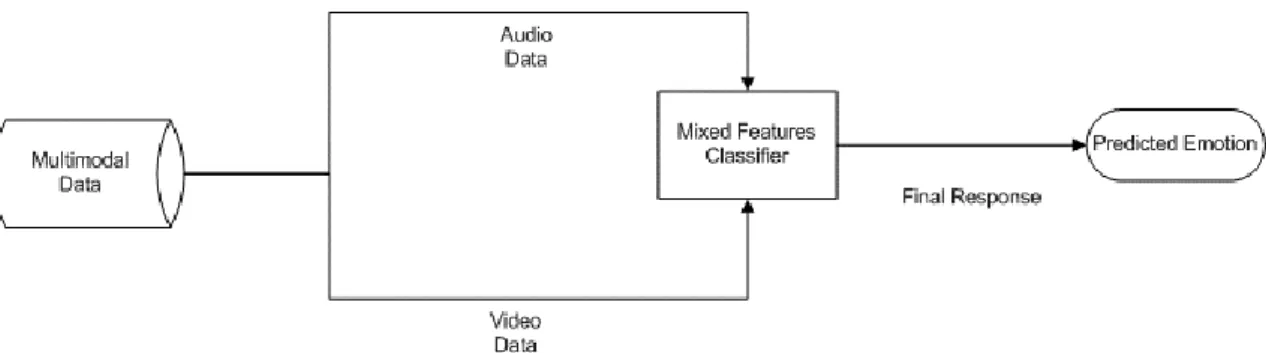
Multimodal systems that combine and fuse emotion-related features from various underlying modalities and perform classification using mixed features (Figure 5).
Decision level fusion ignores possible relationships between features from different modalities. For instance, anger and fear have similar facial cues but their vocal patterns are different [4]. It is desirable that a classifier using both vocal and facial cues can correctly distinguish these emotions. On the other side, psychological studies show that emotional cues in face and speech are not strictly aligned [34]. For example, raising inner brows, as a facial cue of anger, could be seen shortly before or after the increase in speech tone, as the vocal cue of anger. This asynchrony makes feature fusion difficult as it needs more calibration.
8
Figure 5 - Mixed Features Classifier Architecture.
1.2.6 Data Collection
Since facial expression has large dimensions of the problem space as discussed above, we need large datasets for training, testing and benchmarking the recognitions systems. The Cohn-Kanade database [35] is the most widely used database, which contains image sequences of 100 subjects posing a set of 23 facial displays.
Recently a 3D facial expression database has been built [36], which contains 3D range data for emotional expressions at a variety of intensities.
Although several databases exist, there isn’t a single database which contains 3D data for facial points and speech captured using a Kinect Sensor.
1.2.7 Thesis Problem Statement
In the scope of human emotion recognition, the problem addressed in this thesis can be defined in the following research question form:
Assuming the dynamic and spontaneous production of each of the six “universal” emotions listed by Ekman and Friesen [12], how can automatic emotion recognition be performed, by fusing information coming from both visual and audio input HCI modalities?
9
1.3 Thesis Hypothesis, Objectives and Contributions
Given our definition of the problem tackled in this work, stated in the previous section and in the scope of Automatic Human Emotion Recognition, we now state our thesis hypothesis to address such problem:
H1: “To explore the six prototype emotions developed by Ekman and Friesen, with dynamic and spontaneous expressions, we can use a multimodal dataset, from where we can extract training and testing sets needed for our Automatic Human Emotion Recognition task.”
H2: “We can perform dynamic and spontaneous Automatic Human Emotion Recognition, by using a suitable machine learning technique and where a multimodal approach that uses fuse features extracted from visual and speech input HCI modalities, captured by an appropriate sensor (Microsoft Kinect), is superior to a unimodal approach”.
H3: The human emotion accuracy rate obtained with our developed emotion classification technique is comparable with the state-of-the-art.
In order to demonstrate our 3 thesis hypothesis (H1, H2 and H3), we will proceed with the following goal oriented methodology:
To demonstrate H1:
Since at the time of writing of this thesis no public data containing both speech and 3D visual data were available, to carry our work, we decided to collect a new dataset. To that aim, we:
Developed a multimodal data collection system collecting synchronized RGB data, depth data and speech, including Kinect AUs, Kinect Facial (fiducial) Points, using the available Microsoft Kinect SDK.
Collected data from different volunteers with due consent. To demonstrate H2:
Defined unimodal and fused multimodal features for the input HCI modalities considered:
o Unimodal Visualdata(RGB-D video) - based in standard Action Units - AUs from the Kinect SDK.
o Unimodal Audio data – based in features extracted from the speech signal.
10
Choose a suitable machine learning classification system from the techniques available in the literature.
Trained and tested such machine learning technique to perform human emotion recognition, with the collected data.
Developed a human emotion classification demo based in Microsoft Kinect, with such classification technique.
To demonstrate H3:
Compared the emotion accuracy rate in the unimodal and multimodal cases, aiming at achieving rates that compare well with the state-of-the-art.
1.4 Major Contributions
One of the thesis envisaged contributions to the scientific community is a multimodal database for European Portuguese, to our knowledge, the first one being developed, featuring the following data types:
RGB video data, depth data, speech, Kinect AUs, Kinect Facial (fiducial) Points. Although this database is in Portuguese, studies suggest that speech emotions are language independent [37].
1.5 Structure of the Dissertation
The rest of the dissertation is organized as follows. Chapter 2 reviews the background and related work in emotion recognition. Chapter 3 focuses in the data collection methodology and resulting database. Chapter 4 describes our human recognition classification pipeline, addressing unimodal and multimodal classification schemes. This chapter also presents and discusses the results achieved by training and testing the classification techniques with the collected data. Finally, in Chapter 5, we draw some conclusions and discuss potential directions of future research in human emotion recognition using a multimodal data-driven approach.
11
2. Background and Related Work in Emotion Recognition
Emotional expressions play a significant role in our social lives and mutual interaction between individuals [16]. They greatly influence our perceptions and often help our construction of experiences – we can say emotion is an experience differentiator. State of the art suggests three modes of emotional expression, suitable for automated detection:
(i) Emotion from facial expression; (ii) Emotion detection from speech;
(iii) Multimodal emotion detection - combining facial and speech emotion.
It is also stated that Physiological signals represent the most promising and objective manner for detecting emotions in computer science [38].
Emotions conveyed in speech can be grouped into two main categories: consciously expressed emotions and unconsciously expressed emotions [39]. Consciously expressed emotions are usually easily perceived, for instance, when an individual raises his voice while talking expressing that he is angry. On the other hand, trying to conceal his anger might only be disguised be a slight kindness to his words.
2.1 Visual Emotions
Computer systems that attempt to automatically analyze and recognize facial features and motions from visual information (usually still images or sequence of images) are referred to as facial expression analysis. Sometimes the facial expression analysis has been confused with emotion analysis in the computer vision domain [40]. To be able to detect and analyze emotion we need a different system, has explained before in Chapter 1. Because of this, EMFACS suggests that facial expressions not only convey emotion, they can also express intention, cognitive processes, physical effort, or other intra or interpersonal meanings [7]. Interpretation of facial expressions is often aided by context, body gesture, voice, individual differences, and cultural factors as well as by facial configuration and timing and as such facial expression analysis systems need to analyze the facial actions regardless of context, culture, gender, and so on [7].
12
2.1.2 Visual Features
Geometric Feature Extraction
Geometric feature extraction is one of the early techniques to extract geometric facial features. Tian et al. [41] develop multi-state models to extract them and have three-state lip model to describe the lips: open, closed, tightly closed. Usually the initial frame is calibrated by hand, like the position of the nose and eyes, and then the system extracts the features automatically. Employing automatic active appearance model mapping can reduce the manual preprocessing of the geometric feature initialization [7].
3D wireframe mesh systems have also been developed to track geometric facial features defined on the model [42]. The 3D model is manually fitted to the initial by selecting features such as the corners of the eyes and mouth. Figure 6shows an example of the
geometric feature extraction.
Figure 6- Example of feature extraction [98]. (a) Input video frame. (b) Snapshot of the geometric tracking system. (c). Extracted texture map. (d) Selected facial regions for appearance feature extraction [43].
Appearance Feature Extraction
Appearance feature extraction represents the dominant and most popular feature extraction technique used in the field of face recognition. Gabor wavelets are widely used to extract the facial appearance changes. Donato et al. [44] compared techniques for recognizing upper and lower face AUs. These techniques include optical flow, principal component analysis, independent component analysis, local feature analysis and Gabor wavelet representation [7]. The best performances were obtained using a Gabor wavelet representation and independent component analysis. Again these systems needed manual calibration to align the input image with a standard face image using the center of the eyes and mouth.
Tian et al. [45] found that Gabor wavelets work well for single AU recognition for homogeneous subjects without head motion. With non homogeneous subjects with
13 small head motions the results are relatively poor if using only Gabor appearance features.
In summary, when using Gabor wavelets alone, the recognition is adequate only for certain AUs, whereas, when using solely geometric features, the recognition is consistently good and shows high AU recognition rates [7].
Kinect Features
Kinect Face Tracking SDK can extract a total of 112 points from the face and 6 AUs and 11 SU’s (Shape Units), which are a subset of what is defined in the Candide3 model [46]. The SUs estimate the particular shape of the user’s headband and the AUs are deltas from the neutral shape that can be used to morph animated avatar models, so that the avatar acts as the tracked user does [47]. AUs are expressed as a numeric weight varying between -1 and +1, describing position of face muscle groups. Table 2 shows the
6 AUs and their interpretation as well as an avatar illustration.
AU Name and Value Avatar Illustration AU Value Interpretation
Neutral Face (all AUs 0) not applied
AU0 – Upper Lip Raiser (In Candid3 this is AU10)
0=neutral, covering teeth 1=showing teeth fully
-1=maximal possible pushed down lip
AU1 – Jaw Lowerer (In Candid3 this is AU26/27)
0=closed 1=fully open -1= closed, like 0
AU2 – Lip Stretcher (In Candid3 this is AU20)
0=neutral
1=fully stretched (joker’s smile) -0.5=rounded (pout)
14
AU3 – Brow Lowerer (In Candid3 this is AU4)
0=neutral
-1=raised almost all the way
+1=fully lowered (to the limit of the eyes)
AU4 – Lip Corner Depressor
(In Candid3 this is AU13/15)
0=neutral
-1=very happy smile +1=very sad frown
AU5 – Outer Brow Raiser (In Candid3 this is AU2)
0=neutral
-1=fully lowered as a very sad face +1=raised as in an expression of deep surprise
Table 2 - AUs Name, Avatar Illustration and Value Interpretation [47].
Previously, the FACS system was described with 46 Action Units for facial expressions. However, the library from Kinect SDK shares only six of them. All available AUs (with code from FACS) are presented on Figure 7.
Figure 7- Position of Action Units on human face[48].
AU(2) OuterBrowRaiser AU(4) BrowLowerer AU(10) UpperLipRaiser AU(20) LipStretcher AU(15) LipCornerDepressor AU(26) JawLowerer
This set of Action Units is sufficient to classify emotions based on user facial expression [48].
15
Distance Feature Extraction
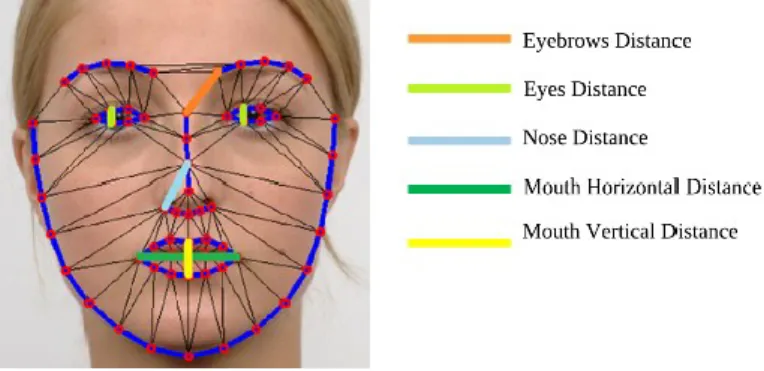
Other academic work [49] based on Kinect uses the distance between fiducial points as input features. This approach starts with a calibration with neutral face to each subject in order to make the distances relative and specific to the subject’s face features. An example is shown on Figure 8.
Figure 8 - Constrained Facial Features: Measured distances between selected landmarks generated by the face tracker. These distances are calculated in real time in relation to the neutral expression [49].
2.2 Speech Emotions
Automatic recognition of emotional speech has a wide potential of applications such as in emotion-oriented computing or in affective computing [5]. Using automatic speech emotion recognition on an angry customer in an automatic call-center could route him to a human operator. Other application could develop robots for entertainment use [50]. Scientifically automatic speech emotion analysis is a challenging problem due to the semantic gap between low-level speech signal and highly semantic (and subjective) information [51].
There are several portrayed emotional expression databases in different languages. According to Scherer [52], vocal emotion expressions may be in large part driven by universal psychobiological mechanisms since judges from different cultures, speaking different languages, can recognize the expressed emotions with much better accuracy than a 50-50 guess. This point can also be supported by [53] who showed that even the small babies who do not speak yet could recognize the emotional clues from the speech of the adults. In the work of Zhu [37], a language-independent machine recognition of human emotion in speech is also implemented with a database of emotional speech from various subjects and different languages for developing and testing the feasibility of the system, which proved the work of Abelin [54], Tickle [55] and Burkhardt [56] with
16
human testing. Therefore, the languages used in the emotional speech databases do not have much influence on the study of vocal emotions. Several databases were built by different research groups.
There is no unique way to classify features but the following taxonomy is often used: acoustic and linguistic features are usually separated due to the different extraction methods. Also another distinction is made upon the database because for spontaneous and/or real-life speech linguistic features gain considerably importance, while in acted speech these features lose their value, since utterances are identical for all speakers [57]. Today a large number of acoustic features (low-level descriptor) and functionals (rich statistical description of low-level descriptor) support the extraction of large features vectors, up to thousands of features [58]. Table 3explains some of acoustic/linguistic
features most often used.
Table 3 - Taxonomy of features commonly used for acoustic and linguistic emotion recognition [57].
Acoustic features are used to characterize their emotions over time. As so, common statistics as minimum, mean and maximum deviation are used. Example of this features are pitch, intensity, duration and voice quality.
In the academic literature we find terms such as prosodic and voice quality features, which are part of acoustic features. The main used features come from speech
17 processing, where the prosody is characterized by large statistics measures of pitch, energy and duration [59]. The idea behind using this type of features is based on the fact that humans use acoustic variation, voluntary or involuntary, to gather the importance or certain aspects of their speech [60].
The duration features model temporal aspects, like pitch, energy or duration of voiced and unvoiced segments (they are measured in seconds) which represents the duration parameter of phonemes, syllabus, words, pauses or utterances [58].
Intensity features “model the energy of a sound as perceived by the human ear, based on the amplitude in different intervals” [58] and refers to the strength of a sound wave. Energy features rely on both intensity and frequency and model intervals or characteristic points.
Pitch is commonly known as the fundamental frequency F0 (defined as the lowest frequency of a periodic waveform, measured in Hz). It carries information about emotion because it depends of the tension of the vocals folds and the sub-glottal air pressure [57]. Studies show (Figure 9) that the average masculine pitch is about an octave
lower than feminine pitch: 120 Hertz (Hz) (B2 in musical notes) for masculine, 220 Hz (A3) for feminine, and 155-185 Hz (D#3-G3) for gender-ambiguous.
Figure 9- Average pitch for male and female [61].
Voice quality models the various measures of voice quality and is a complicated issue by itself. Measures like the shimmer, jitter and other micro-prosodic events are usually
18
characteristics of voice quality. They reflect peculiar voice quality properties such as breathiness or harshness [58].
Spectrum of speech reveals information about formants, which are one of the quantitative characteristics of the vocal track. Formants are characterized by frequency and bandwidth.
The cepstrum is the result of the Fourier transform of the logarithm of the spectrum of a signal and it emphasizes changes on periodicity in the spectrum, while being relatively robust against noise [58].
The final feature commonly used is wavelets, which are waves that give a short-term multi-resolution analysis of time, energy and frequencies in a speech signal [58].
Linguistic features are the words or the grammatical alternations that humans use and play a role in the reflection of our emotional state. They are various techniques for this analysis but the main ones are N-Grams (based on probabilistic language model) and Bag-of-Words (numerical representation form of texts). Before applying these techniques, the complexity of speech is reduced using approaches such as elimination of irrelevant words or stopping words.
2.2.1 Frequency Speech Features
LPC
Linear predictive coding (LPC) is “a tool used mostly in audio signal processing and speech processing for representing the spectral envelope of a digital signal of speech in compressed form, using the information of a linear predictive model” [2]. It is one of the most used methods for speech analysis.
MFCC
Mel-frequency cepstral coefficients (MFCCs) are coefficients that collectively make up a mel-frequency cepstrum. MFC are cepstral coefficients obtained from a spectrum filtered by Mel scale [62], which is a scale inspired by the characteristics of human perception, different from the normal cepstrum, in a way that the frequency allows approximating the human auditory system's response more . It stands that high frequencies are caught by human’s ear with less precision in comparison to low frequencies [62].
19
2.3. Facial Expression Recognition and Classification
Most common used techniques for facial expression recognition are Neural Networks, Support Vector Machine (SVM), Bayesian Networks, Hidden Markov Models (HMM), Dynamic Bayesian Network and rule-based classifiers. Facial expression recognition is divided into frame-based or sequence-based recognition [7], where frame-based recognition uses features from one image (or frame) to recognize its expression, while the sequence-based recognition tries to capture a pattern in a sequence to recognize the expression for one or more images.
For frame-based expression recognition the most used methods are neural networks, support vector machines, linear discriminant analysis, Bayesian network, and rule-based classifiers.
For sequence-based expression recognition, which uses temporal information, the most used techniques are HMM, recurrent neural networks, and rule-based classifiers.
The task of classification is assigning a vector or a set of features to some predefined classes (emotions) in order to analyze and recognize the emotion. Generally speaking a class is defined during the training phase of the system (or by manual feature extraction) which defines the class with a set of model features, which are the ones or the approximation to best matching reference. This section presents an overview of the most commonly supervised learning models used in pattern recognition systems.
k-Nearest Neighbors (kNN). This classification method uses the feature-vectors from a query example to find their k nearest neighbors in a set of features-vectors, gathered during the training. The training mainly consists of the extraction of (possible good discriminable) features from training images, which are then stored for later classification. Due to the use of exact search methods, the algorithm performs relatively slowly in higher dimensional spaces or if there are many reference features.
Neural Network. A Neural Network (NN) is used for solving artificial intelligence problems. Artificial neural network algorithms attempt to abstract the complexity of the brain and focus on what matters the most from an information processing point of view. These abstractions tend to reduce the amount of computation required to simulate a neural networks, so it larger networks and train them on larger data sets.
20
Support Vector Machines. A Support Vector Machine (SVM) is an algorithm that analyzes data and recognizes patterns, mostly used for classification analysis. SVM are based on the concept of decision planes that define decision boundaries. The basic SVM takes a set of input data and predicts, for each given input, which of two possible classes forms the output.
The general approach to automatic facial expression analysis (AFEA) consists of three steps (Figure 10): face acquisition, facial data extraction and representation, and facial
expression recognition [7].
Figure 10 - The typical structure of a recognition system.
A recognition system starts processing its input data by extracting all the features (feature extraction) that constitute the system and then extracting only the key features (feature selection) for further analysis. Afterwards, the system will classify those features based on pattern recognition and machine learning. Finally there will be one or more recognized emotions and the most ranked one will be presented by the system. This is the general approach to automatic facial expression/emotion analysis.
Upon data input, the face is automatically found for the input images or sequences. It can be a detector to detect face for each frame or just detect face in the first frame and then track the face in the remainder of the video sequence. After locating the face, the features caused by facial expressions are extracted and identified as facial action units (Figure 11). Kinect extracts geometric features (such as nose, mouth, etc.) and then creates (for visualization or use) appearance features that form the face geometry. The facial components or facial feature points are extracted to form a feature vector that represents the face geometry. The classifier will then recognize the facial expression. This is the last stage of AFEA systems.
21
Figure 11- Example of tracked points on Kinect (after feature selection) [47].
2.4 Related Work
Multimodal integration of speech and face analysis can be done at different levels of abstraction, low or high level. Performing a low-level fusion is also called fusion at signal level and a high-level fusion is also called fusion at the decision level.
Unimodal
Emotion recognition on video modality achieves an accuracy of 73.22% using HMM (Hidden Markov Models) and Bayesian Networks [63] and 91.5% using SVM and MLR (machine-learned ranking) [64] for 6 Basic Expressions of Cohn-Kanade Database [35]. For video sequences and using HMM, accuracy between 78.5% and 82.5% were obtained [30]. Audio modality recognition accuracy is reaches high values of accuracy, 81.67% using PCA (Principal component analysis), LDA (Linear discriminant analysis) and RBF (Radial basis function) [65] and 92% for 6 Emotions [66].
Multimodal
Using multimodal features usually results in an improve accuracy, such as the work of [67], in which the authors report an improvement of 5% compared to the performance of the facial expression recognition and an improvement of 13%, compared to the result of the emotion recognition from speech.
Other work [68] using the Enterface 2005 database [69] has a recognition rate of emotion classification of less than 35% for speech and less than 30% in case of face. Combining the two modalities leads to an improvement of 5% in case of fusion at the decision level and almost 40% recognition rate in case of early fusion. Other researchers [70] achieved a multimodal recognition rate of 79%, as opposed to facial expression
22
recognition rate of 67% and emotion from speech detection rate of 73% using FAPS (facial animation parameters) and audio features related to pitch and rhythm.
23
3. Multimodal Data Collection
In any classification problem, a dataset that observes relevant data signals is essential for building recognition models. For example, areas such as speech recognition, speaker identification and music genre classification rely on different kinds of audio data. Likewise, specifically designed datasets should be collected in order to address the problem of emotion recognition, with the possibility of extracting appropriate characteristics of the signals [62]. Since, to the best of our knowledge, no specific dataset that allowed addressing the stated hypothesis was found in the scientific community, we have acquired a novel multimodal dataset.
3.1 Dataset
We acquired a multimodal dataset (RGB video, depth, audio and facial data) using Microsoft Kinect as capture device. The goal of the dataset was to simulate realistic environments, where the user has to perform emotional acting, inducing human responses from face expression and tone.
Emotion classification using facial movements and speech is already explored in the state-of-the-art [71]. However, the detection of spontaneous and subtle emotions during speech is still a challenging task, due to its complexity, short duration and small impact in facial movements.
In our approach, the user will reproduce certain sentences with a speech tone and facial expressions associated with an emotional state. This approach will provide, besides the multiple data sources (RGB-D, speech and facial data), a different view about emotion acting and their application domains, which remain unexplored in state-of-the-art datasets.
We used everyday persons as users, not actors, to keep the situation with a high level of realism and to provide a wide range of diversity on the expressions. Actors have professional skills and training that most people do not have, thus the intent was to have a situation that simulated a real, untrained, user. Some available databases try to induce emotions in the users by asking them to imagine themselves in general and predefined situations [69] [72][73]. In the same line, we decided to provide a protocol to the users that instructed them to imagine and simulate a certain role, while they read the pre-defined sentence. This guarantees a more realistic response from the volunteers. For this dataset, we choose the six basic Ekman emotions [74] plus a neutral one, due to their
24
generality and applicability in real world situations. Additionally, the sentences were pronounced in Portuguese, since it is the volunteers’ mother tongue and, at the time of writing of this experiment, there was no multimodal Portuguese database available.
We collected data from a total of 18 healthy volunteers, without any history of visual or speech impairments.
3.2 Acquisition Setup
3.2.1 Acquisition data formats
The various types of acquired data are detailed here: RGB image – Resolution 640x480 – 30fps (.bin); Depth image – Resolution 640x480 – 30fps (.bin); Audio – Mono 16 bit PCM format – 16 kHz (.bin).
Facetracker SDK Fiducial Points and Action Units detected (.bin). Audio file (.wave) (for easy preview).
Video file (.avi) (for easy preview). TimeStamps for each individual frame.
3.2.2. Data Nomenclature and Folder Structure
Each volunteer had its own folder called “Volunteer0X”, where X is the number associated to the volunteer. Regarding file names, we used the following template: “Volunteer0X_EMOTION_Sentence0Y _take0Z.format”
Y is the sentence number and Z the take number.
3.2.3 Environment Conditions
The room configuration, used for the collection, can be observed in the Figure 12.
25 Each volunteer was at 1 meter away from the acquisition hardware, sitting comfortably while the sentences were projected in a screen. His/her face was frontal and centered relatively to the acquisition camera.
Illumination was not controlled. However, in each acquisition we tried to provide uniform lightning conditions. The background was static and white. Although the room was not sound isolated, noise was kept to a minimum.
For a more complete coverage of real scenarios we would need to extend the condition variables.
3.2.4 Data Synchronization
Kinect only provides synchronization between RGB and depth information. Thus we needed to synchronize these signals with speech as well.
To guarantee RGB-D and speech synchronization our data collection system emits a light/sound signal (Figure 13) in the beginning of each recording. This synchronizing device emits a shrill sound in a known frequency, easily detectable in the recorded sound wave.
Figure 13- Synchronization device shown on the left part of the image. The device emits a sound at the same time a led in turned on, allowing for visual and audio signals synchronization.
26
3.3 Collection Description
Each volunteer read 2 prompts per emotion, while his/her voice and face expression was captured. Each prompt was recorded twice, in order to guarantee redundancy in the final results. The prompts are translations to European Portuguese from the eNTERFACE’05 dataset[69]. Each volunteer started the sentence with a Neutral expression and then produced the respective emotion. The data collection started with the following neutral prompt:
“A jarra está cheia com sumo de laranja” The remaining sentences used are shown in Table 4.
Emotion Sentences
Anger 1- O quê? Não, não, não! Ouve, eu preciso deste dinheiro! 2- Tu és pago para trabalhar, não é para beberes café. Neutral 1 - A jarra está cheia com sumo de laranja.
Disgust 1- Ah, uma barata! 2- Ew, que nojo!
Fear 1- Oh meu deus, está alguém em minha casa!
2- Não tenho nada para si, por favor, não me magoe! Joy 1- Que bom, estou rico!
2- Ganhei! Que bom, estou tão feliz! Sadness 1- A minha vida nunca mais será a mesma.
2- Ele(a) era a minha vida.
Surprise 1- E tu nunca me tinhas contado isso?! 2- Eu não estava nada a espera!
27
3.4 Database Results
We obtained emotional data from 18 volunteers, with visual and speech recordings. The experiment description was fully documented in order to allow future reproduction and adding more data to the dataset.
This section provides some examples taken from database, where volunteers performed each emotion task (fear, anger, disgust, joy, sadness, surprise) as depicted in Figure 14, Figure 15, Figure 16, Figure 17, Figure 18 and Figure 19.
Figure 14- Different volunteers while performing the Fear recording task.
28
Figure 16 - Different volunteers while performing the Disgust recording task.
Figure 17- Different volunteers while performing the Joy recording task.
29
Figure 19- Different volunteers while performing the Surprise recording task.
As we can observe from the previous figures, some users show only subtle facial changes (also found in the speech signal), while others tend to exaggerate their expressiveness. This heterogeneity will be useful in increasing the diversity of emotional information that we can extract from the data collection participants, preparing the classification system for both situations. On the other hand, we can found some confusion between emotions like fear, surprise and anger and a lack of expressivity in the sadness emotion. The first aspect was somewhat expected, since these emotions are usually confused with each other. Regarding the sadness emotion, the volunteers had difficulties in acting this emotion essentially because it is hard to induce and hard to fake. They usually asked for time to change their state of mind before performing the task at hand and, even with that, they expressed some frustration after the completing the task. This may be due to the difficulty we have trying to hide the involuntary facial movements (micro expressions and subtle expressions) while performing some facial expression acting [75]. Some of the volunteers moved their body and their face while the acquisition was in process. This may cause some occlusion of the face and therefore, some of the visual features may have wrong representations. This can affect other stages of the system, although some level of robustness is already provided by the face-tracking solution of Kinect SDK.
31
4. Emotion Recognition System: Methods, Results and
Discussion
In this chapter we describe the experiments and results using the database described in Chapter 3.Using both unimodal and multimodal approaches we have applied different features (e.g. MFCC, Energy, etc.), as well as, different classifiers (e.g. NN, SVM and kNN).
4.1 Methodology
4.1.1 Performance Evaluation
We used leave-one-out cross-validation to obtain the accuracy of the classifiers. We used 16 volunteers for training and 1 for testing, 17 times (one for each volunteer). We then proceed to calculate the mean from all tests. We have 7 emotions (anger, disgust, joy, neutral, fear, sad, surprise) for each subject, and each emotion has 2 sentences (except neutral emotion, which has only 1 sentence) and we have 2 takes (recordings) of each sentence, which totals up to 416 samples for training and 26 for test (468 samples for 18 volunteers if we consider the whole dataset).
4.1.2 Feature Extraction
For the video features we extracted the AUs values given by Kinect SDK. For the audio features, we extracted MFCC, LPC, Energy (Root Mean Square (RMS)) and Pitch values. MFCC, LPC and RMS were extracted using algorithms from jAudio [76] and we used a Pitch extraction algorithm from Yin [77] [78].
In total we have 6 features for video data, and 24 features for audio data. For each video frame we extracted all 6AUs from Kinect SDK. For each audio frame of 50mswe extracted 24 features – 12 MFCC, RMS, Pitch and 10 LPC. The first MFCC coefficient is replaced by RMS. Figure 20 shows all the plotted features for one data sample and Figure 21 shows the AUs variations along with audio signal. We can clearly
32
Figure 20- Example figure of different features across time for one data sample – emotion anger, subject 1 and sentence 1. From top to bottom - a) AUs, b) Raw Audio Signal, c) Pitch, d) MFCC + RMS, e) LPC. Abscissa represents time in seconds.
Figure 21- AUs features across time for one data sample – emotion anger, subject 1, sentence 1. From top to bottom – a) AUs, b) Audio Signal. Abscissa represents time in seconds.
In this experiment we have 39587 video frames and 27118 audio frames available for the classifiers. The distribution of the samples per emotion is shown in Figure 22.
Figure 22 - Samples Distribution amongst Emotions.
0 0.5 1 1.5 2 2.5 3 3.5 4 -1 0 1 0 0.5 1 1.5 2 2.5 3 3.5 4 -0.1 0 0.1 0 0.5 1 1.5 2 2.5 3 3.5 4 0 200 400 0 0.5 1 1.5 2 2.5 3 3.5 4 -20 0 20 0 0.5 1 1.5 2 2.5 3 3.5 4 -1 0 1 0 0.5 1 1.5 2 2.5 3 3.5 4 -1 -0.5 0 0.5 1
AU0-Upper Lip Raiser AU1-Jaw Lowerer AU2-Lip Stretcher AU3-Brow Lowerer AU4-Lip Corner Depressor AU5-Outer Brow Raiser
0 0.5 1 1.5 2 2.5 3 3.5 4 -0.05 0 0.05 0.1 0.15 0 1000 2000 3000 4000 5000 6000 7000 8000 9000
anger disgust fear joy neutral sad surprise
Samples Distribution amongst Emotions
33 Not all classes have the same number of samples, so the dataset is unbalanced in that sense. Neutral emotion has half the observations of any other classes due to the fact that only 1 sentence was recorded for this emotion (versus 2 sentences for each emotion). When feature fusion was considered, we had to take into account that audio and video frame rates were different. Audio frames represent 50ms while video frames represent 33ms. To deal with this, considering that both signals are aligned, we extract the audio proportionally from one or more frames corresponding to the time frame of the video sequences.
4.1.3 Machine Learning Classifiers
We chose to use 3 classifiers so we could compare the results obtained in each experience and draw more solid conclusions about the experiments. For the experiments we employed Neural-Networks (NN), k-Nearest Neighbors (kNN) and Support Vector Machines (SVM), the most used classifiers for Emotion Recognition tasks [7]. We used available Matlab (NN) and OpenCV (SVM and kNN) implementations of such classifiers. We considered all frames to be an independent observation, without any relation to other frames.
4.2 Experiments
In this section we present some of the experiments made with this dataset. First we detail the setup of the classifiers. We then proceed to detail the 5 experiments carried with the collected dataset. In the first experiment we use the complete dataset. In the second experiment we used only audio features not affected by speech. In the third experiment we use try different combinations of audio features. The forth experiment is done using a sub-dataset of the users that better portrayed the emotions. The fifth and last experiment analyses features based on previously used features such as pitch.
The kNN classifier has k tuned to 6 for video (differs 1% from k = 20 and is less computationally expensive) and 12 for audio, as seen in Table 5.
34
Figure 23 - Accuracy results for different k values, unimodal video and unimodal audio.
SVM classifier uses a linear kernel, with penalty parameter of the error term set to 1. The Neural Network classifier uses Levenberg-Marquardt as the training function and mean-squared error for the performance function. The number of hidden nodes was set to 90, which maximizes the accuracy percentage, as pictured by Figure 24.
Figure 24 - Accuracy results for different values of hidden nodes, unimodal video and unimodal audio for NN. 15.00% 17.00% 19.00% 21.00% 23.00% 25.00% 1 2 3 4 5 6 7 8 9 10 11 12 13 14 15 16 17 18 19 20 Acc u ra cy % k
Prediction accuracy for test data
Unimodal Video Unimodal Audio 0.00% 10.00% 20.00% 30.00% 40.00% 50.00% 60.00% 10 20 30 40 50 60 70 80 90 100 Acc u ra cy %
number of hidden nodes
Prediction accuracy for test data
Unimodal Video Unimodal Audio
35
4.2.1 Experiment #1 – Full Dataset
For this experiment we used all features as described in section 4.1.2 Feature Extraction and the complete dataset. Results are presented on Table 5.
Modalities SVM kNN NN
Unimodal Video 19.29% ± 0.63 17.57% ± 0.55 33.99% ± 2.98 Unimodal Audio 27.18% ± 1.01 21.64% ± 1.0 35.08% ± 2.36
Multimodal - Decision Level 19.61% ± 0.83 19.24% ± 1.82 31.83% ± 2.61 Multimodal - Mixed Features 18.32% ± 0.67 18.42% ± 1.31 30.07% ± 2.96
Table 5 - Classification accuracy for experiment 1.
We can observe from the results that SVM outperforms kNN on unimodal data, while kNN slightly outperforms SVM on multimodal data. NN classifier outperforms both SVM and kNN in both multimodal and unimodal approaches. Unimodal audio data has the higher accuracy on the 3 classifiers. With multimodal data decision level we achieve better performance than with mixed features.
4.2.2 Experiment #2 – Video Features Experimentation
This experiment setup used only 2 AUs – the ones not perturbed by speech - for the video data. The selected AUs correspond to those outside the mouth region, AU 3 and AU 5. This was an attempt to reduce noise caused by speech during the simulation of an emotion. We believed that these AU’s could introduce noise in classification due to the fact that they represent the user speaking, instead of the user emoting. In this experiment we also used all the dataset. Results are shown on Table 6.
Test Data Accuracy SVM kNN NN
Unimodal Video 26.19% ± 2.7 17.84% ± 0.1 33.12% ± 2.67
Unimodal Audio 27.18% ± 1.01 21.64% ± 1.0 35.08% ± 2.36
Multimodal - Decision Level 15.23% ± 0.7 18.79% ± 0.1 45.88% ± 3.80
Multimodal - Mixed Features 14.17% ± 0.4 20.93% ± 0.15 36.82% ± 3.42
Table 6 - Classification results for experiment 2 (2 AUs), SVM and kNN Classifier.
As in Experiment 1, we can observe from the results that SVM outperforms kNN on unimodal data, while kNN outperforms SVM on multimodal data. The AU change introduced higher accuracy in unimodal video for SVM, remaining the same for the
36
kNN. For the multimodal approaches, kNN performed the same while SVM dropped its accuracy. NN classifier maintains same accuracy values when using all AU’s or just 2 AU’s and has an increase in accuracy for both multimodal approaches. SVM multimodal loses accuracy when using only 2 AU’s, compared to when using all the AU’s.
4.2.3 Experiment #3 – Audio Features Experimentation
For this experiment we used different combinations of features for the audio data, removing one feature type to understand its impact on the model accuracy and how each feature impacts the overall accuracy, in both multimodal and unimodal approaches. Results are shown on Table 7, Table 8 and Table 9.
kNN Unimodal Audio Multimodal Decision Level Multimodal Mixed Features
all features 21.64% ± 1.00 19.24% ± 1.82 18.42% ± 1.31
without MFCC 20.30% ± 0.08 19.38% ± 0.28 19.55% ± 0.17
without LPC 21.96% ± 0.14 19.99% ± 0.35 19.69% ± 0.14
without Pitch 21.85% ± 0.10 19.28% ± 0.25 19.47% ± 0.18
Table 7 – Classification results for experiment 3, kNN.
SVM Unimodal Audio Multimodal Decision Level Multimodal Mixed Features
all features 14.54% ± 0.12 21.55% ± 0.47 13.41% ± 0.32
without MFCC 15.10% ± 0.5 19.50% ± 0.68 12.92% ± 0.28
without LPC 13.50% ± 0.16 19.48% ± 0.67 15.06% ± 0.09
without Pitch 14.96% ± 0.32 18.38% ± 0.55 15.71% ± 0.29
Table 8 – Classification results for experiment 3, SVM.
NN Unimodal Audio Multimodal Decision Level Multimodal Mixed Features
all features 35.08% ± 2.36 31.83% ± 2.61 30.07% ± 2.96
without MFCC 25.05 % ± 1.61 32.78% ± 2.34 39.43% ± 3.94
without LPC 31.37% ± 2.48 33.15% ± 2.42 41.18% ± 3.70
without Pitch 32.68% ± 2.30 39.69% ± 3.66 33.33% ± 3.45
Table 9 - Classification results for experiment 3, NN.
Overall NN performed better than SVM or kNN. kNN performed better on unimodal data than SVM. Multimodal decision level was similar for SVM and KNN, while multimodal mixed features worked better with kNN than with SVM. For these two classifiers we cannot see clearly the impact of each audio feature. On unimodal audio, using all audio features yielded better accuracy results, while MFCC had the biggest
37 impact on the accuracy if we consider NN. Also for NN and multimodal decision level, removing pitch improved accuracy between 6 to 8 percent. Multimodal mixed features had the worst performance when using all audio features and removing MFCC or LPC improves overall accuracy on this multimodal classifier. Results indicate that there is not a common feature that has the same impact on all the modalities and classifiers.
4.2.4 Experiment #4 – Sub Dataset
To explore other characteristics of the data we decided to subsample the dataset. The idea was to reduce the noise (if any) on the full dataset and produce higher accuracy results. The sub dataset contains only Sentence_01 and the respective Take_01 of all emotions from subjects 1, 8, 9, 10, 13 and 16, subjects that portrayed better the emotions. Table 10 shows the results of this experiment. For comparison purposes, we have also included results with all subjects for Sentence_01 and Take_01.
Test Data Accuracy Unimodal Video Unimodal Audio Multimodal Mixed Features Multimodal Decision Level
kNN - all dataset 17.57% ± 0.55 21.64% ± 1.0 18.42% ± 1.31 19.24% ± 1.82 SVM - all dataset 19,29% ± 0.63 27.18% ± 1.01 18.32% ± 0.67 19.61% ± 0.83 NN - all dataset 33,99% ± 2.98 35.08% ± 2.36 30.07% ± 2.96 31.83% ± 2.61 kNN - sub dataset 11.90% ± 0.95 18.92% ± 0.27 23.80% ± 1.91 16.66% ± 1.76 SVM - sub dataset 30.95% ± 2.73 19.05% ± 1.2 25.23% ± 2.32 19.04% ± 2.42 NN - sub dataset 23.53% ± 5.34 47.06% ± 6.18 49.02% ± 6.53 58.94% ± 4.08
Table 10 - Classification results for experiment 4 using kNN, SVM and NN.
Using a sub dataset improves accuracy on SVM for unimodal video and for NN on unimodal audio. On multimodal modalities there is increase accuracy on mixed features while on decision level only NN shows increase accuracy for a sub dataset.
![Figure 1- Basic emotions as identified by Ekman and Friesen [13].](https://thumb-eu.123doks.com/thumbv2/123dok_br/19184906.947106/25.892.254.640.408.679/figure-basic-emotions-identified-ekman-friesen.webp)
![Table 1- Recognition of facial expressions can be achieved by categorizing a set of such predetermined features as in FACS [22]](https://thumb-eu.123doks.com/thumbv2/123dok_br/19184906.947106/26.892.175.719.711.1028/table-recognition-facial-expressions-achieved-categorizing-predetermined-features.webp)
![Table 3 - Taxonomy of features commonly used for acoustic and linguistic emotion recognition [57].](https://thumb-eu.123doks.com/thumbv2/123dok_br/19184906.947106/38.892.148.748.514.894/table-taxonomy-features-commonly-acoustic-linguistic-emotion-recognition.webp)
![Figure 9- Average pitch for male and female [61].](https://thumb-eu.123doks.com/thumbv2/123dok_br/19184906.947106/39.892.240.656.632.1001/figure-average-pitch-male-female.webp)
![Figure 11- Example of tracked points on Kinect (after feature selection) [47].](https://thumb-eu.123doks.com/thumbv2/123dok_br/19184906.947106/43.892.366.527.107.250/figure-example-tracked-points-kinect-feature-selection.webp)