Analyzing Chatbots Data with
Data Mining
Ana Catarina Dias Amaral
Mestrado Integrado em Engenharia Informática e Computação Supervisor: Carlos Soares
Co-Supervisor: Cláudio Sá
Data Mining
Ana Catarina Dias Amaral
Mestrado Integrado em Engenharia Informática e Computação
The use of chatbots in business contexts, as a way of communicating with customers is becoming more common nowadays. With this increasing use of machine-to-human contact as a means of connecting with customers, the problem arises of whether communication is being performed correctly. The quality of the questions may not be appropriate, there may be out-of-date questions and even questions that, while correct, may not contribute to the company’s goals.
The dialog flow in a chatbot conversation is not homogeneous and there might be a lot of implicit subjectivity. In this way, the analysis of conversations of chatbots is an opportunity to improve the quality of service. However, this task can be quite challenging and time-consuming, so there is a need to find methods to automate it. This information can help to promote the propensity to support the fostering of company sales and satisfaction of their clients.
This dissertation addresses this problem with a combination of two Data Mining topics: Sub-group Discovery and Sequential Pattern Mining. While Sequential Pattern Mining is concerned with finding frequent patterns in sequences, subgroup discovery is the discovery of patterns with unusual behaviour. A chatbot conversation can be represented as a sequence of interactions. In this way, in a context of chatbots, Sequential Pattern Mining can be used to discover sequences of interactions that users go through frequently. In the same context, Subgroup Discovery can be translated as the discovery of interactions between users and bots which are unusual in comparison to the population. By combining these two techniques, it was possible to find frequent unusual sequences, i.e., sequences that reveal unexpected behaviours. These unexpected behaviours can be either positive (i.e. interactions that exceeds expectations) or negative (i.e. interactions below expectations) in terms of business goals.
As a scientific contribution, two different approaches were developed to discover unusual pat-terns in sequential data. Furthermore, five distinct quality measures were also created. In addition to the scientific contribution, the work developed can also benefit organisations that use chatbots to communicate with their partners, such as customers. Chatbot design and marketing teams can use the results obtained to correct failures and implement the best practices found in other areas or components, both at the system level and at the business level. Within this dissertation, the ap-proaches developed allowed the discovery of several interesting behavioural patterns in chatbots users. Most of them corresponded to design errors in the chatbots under study.
Keywords: Chatbots analytics, Data analysis, Pattern mining, Sequential Pattern Mining, Subgroup discovery
A utilização de chatbots em contextos empresariais, como forma de comunicação entre cliente e empresa, é cada vez mais comum nos dias de hoje. Com o aumento da utilização deste tipo de interação surge o problema de se a comunicação está a ser efetuada corretamente. A qualidade das questões pode não ser a mais apropriada, podem existir questões deprecadas ou mesmo questões que, apesar de estarem corretas, podem não contribuir para os objetivos do negócio.
O fluxo de diálogo numa conversa de chatbot não é algo homogéneo e pode existir bastante subjetividade implícita. Desta forma, a análise de conversas de chatbots é uma oportunidade para melhorar a qualidade dos serviços. No entanto, esta tarefa pode-se tornar bastante desafiante e demorada, pelo que existe a necessidade de encontrar métodos de automatização da mesma. Este tipo de informações é algo que pode propiciar o progresso de uma organização e, ao mesmo tempo, a satisfação dos seus clientes.
Esta dissertação aborda este problema como uma combinação entre duas áreas de Data Mi-ning: Subgroup Discovery e Sequential Pattern Mining. Enquanto que Sequential Pattern Mining se preocupa com a descoberta de padrões frequentes em dados sequenciais, Subbroup Discovery tem como propósito a descoberta de padrões que revelem um comportamento fora do comum. Uma conversa de chatbot pode ser representada como uma sequência de interações. Desta forma, num contexto de chatbots, Sequential Pattern Mining pode ser usado para descobrir sequências de interações que os utilizadores atravessem frequentemente. No mesmo contexto, Subgroup Disco-verypode ser traduzido como a descoberta de interações entre utilizador e bot consideradas fora do comum quando comparadas com a população. A partir da combinação destas duas abordagens, será possivel encontrar sequências não usuais, ou seja, sequências que revelam comportamentos inesperados. Estes comportamentos podem ser tanto positivos (i.e. interações que excedem as ex-petativas) como negativos (i.e. interações que ficaram aquém do esperado) em termos de objetivos de negócio.
Como contribuição científica, foram desenvolvidas duas abordagens para descobrir padrões com um comportamento fora do comum em dados sequenciais. Para além disso, foram também criadas cinco medidas de qualidade. O trabalho desenvolvido, para além da contribuição científica, pode também beneficiar organizações que façam uso de chatbots como forma de comunicação com os seus parceiros, como clientes. Equipas de design de chatbots e equipas de marketing poderão usar os resultados obtidos para corrigir falhas e extender as melhores práticas encontradas a outras áreas ou componentes, tanto ao nível do sistema como do negócio. No âmbito desta dissertação, as abordagens desenvolvidas possibilitaram a descoberta de vários padrões comportamentais in-teressantes por parte de utilizadores de chatbots. A maior parte destes padrões corresponderam a erros de design nos chatbots sob estudo.
I would like to start this section by stating my gratitude to my supervisors, Carlos Soares and Cláudio Rebelo. Thanks for all the advice, for the many helpful comments and for the meetings that lasted more than an hour. Thanks also for the ones that did not last so long.
I would also like to thank all my friends, colleagues and teachers who worked with me and helped me throughout my academic path.
Finally, and most importantly, I would like to thank my dear family and my beloved boyfriend for withstanding my frequent absences and, above all, for the unconditional support throughout this journey.
It matters that you don’t give up.”
1 Introduction 1
1.1 Motivations and Objectives . . . 2
1.2 Structure of the Dissertation . . . 3
2 Literature Review and Background 5 2.1 Chatbots . . . 5
2.1.1 Chatbots Analytics . . . 6
2.2 Pattern Mining . . . 7
2.3 Sequential Pattern Mining . . . 7
2.3.1 Existing Algorithms . . . 9
2.4 Subgroup Discovery . . . 16
2.4.1 Main Elements of a Subgroup Discovery Algorithm . . . 17
2.4.2 Quality Measures . . . 18
2.4.3 Existing Algorithms . . . 22
2.5 Related Work . . . 28
3 Subgroup Discovery for Sequences 31 3.1 Business Problem . . . 31
3.2 Problem Formalisation . . . 32
3.3 Approaches . . . 33
3.3.1 Sequential Pattern Mining with Post Processing of Subgroups Discovery 34 3.3.2 Sequential Pattern Mining with Subgroups Discovery On the Fly . . . 36
3.4 Quality Measures . . . 37
3.4.1 Indicators of Interest . . . 38
3.4.2 Indicators of Dropout . . . 41
3.5 Preliminary Analysis with Artificial Data . . . 43
3.6 Summary . . . 48 4 Experimental Setup 51 4.1 Data . . . 51 4.1.1 Chatbot "Credit" . . . 52 4.1.2 Chatbot "Christmas" . . . 53 4.1.3 Chatbot "Employment" . . . 55 4.2 Hyperparameters . . . 56 4.3 Implementation . . . 56 4.4 Summary . . . 57
5 Results 59
5.1 Chatbot "Employment" . . . 59
5.1.1 Indicator of Interest & Global Reference . . . 60
5.1.2 Indicator of Interest & Local Reference . . . 62
5.1.3 Average Dropout & Global Reference . . . 64
5.1.4 Minimum Dropout & Global Reference . . . 65
5.1.5 Average Dropout & Local Reference . . . 66
5.2 Chatbot "Credit" . . . 67
5.3 Chatbot "Christhmas" . . . 68
5.4 Summary . . . 70
6 Conclusions & Future Work 73 6.1 Future Work . . . 74
References 77 A Literature Review and Background 83 B Data 87 B.1 Data Structure . . . 87
B.2 Information about the Provided Datasets . . . 89
C Chatbot "Credit" Results 93 C.1 Indicator of Interest & Global Reference . . . 93
C.2 Indicator of Interest & Local Reference . . . 96
C.3 Average Dropout & Global Reference . . . 98
C.4 Minimum Dropout & Global Reference . . . 99
C.5 Average Dropout & Local Reference . . . 100
D Chatbot "Christmas" Results 103 D.1 Indicator of Interest & Global Reference . . . 103
D.2 Indicator of Interest & Local Reference . . . 104
D.3 Average Dropout & Global Reference . . . 108
D.4 Minimum Dropout & Global Reference . . . 109
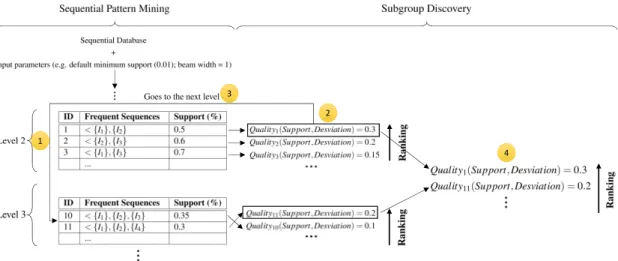
2.1 Illustrative example of the approach described [Lemmerich et al.,2016]. . . 29
3.1 Flow of the first approach implemented. . . 35
3.2 Flow of the second approach implemented. . . 37
3.3 Results obtained by the quality measure3.7with the test dataset ’test1’. . . 44
3.4 Results obtained by the quality measure3.9with the test dataset ’test1’. . . 45
3.5 Results obtained by the quality measure3.8with the test dataset ’test2’. . . 45
3.6 Results obtained by the quality measure3.7with the test dataset ’test3’. . . 46
3.7 Average dropout of chat and all nodes belonging to it. . . 47
3.8 Results obtained by the quality measures3.9 (above) and3.11(bellow) with the test dataset ’test4’. . . 47
3.9 Results obtained by the quality measure3.10with the test dataset ’test4’. . . 48
4.1 Interest indicators for chatbot "Credit". . . 53
4.2 Structure of the chatbot "Credit". . . 53
4.3 Interest indicators for chatbot "Christmas". . . 54
4.4 Structure of the chatbot "Christmas". . . 54
4.5 Interest indicators for chatbot "Employment". . . 55
4.6 Structure of the chatbot "Employment". . . 55
5.1 Most interesting pattern found for the indicators "postalcode" with the quality measure "Indicator of Interest & Global Reference" (Eq.3.7), regarding the chat-bot "Employment". . . 60
5.2 Most interesting pattern found for the indicator "address" with the quality mea-sure "Indicator of Interest & Global Reference" (Eq. 3.7), regarding the chatbot "Employment". . . 61
5.3 Most interesting patterns found with indicator "mail" with the quality measure "Indicator of Interest & Global Reference" (Eq. 3.7), regarding the chatbot "Em-ployment". . . 61
5.4 Most interesting patterns found with the indicator "phone" with the quality mea-sure "Indicator of Interest & Global Reference" (Eq. 3.7), regarding the chatbot "Employment". . . 61
5.5 Details about the first nodes of the chatbot "Employment". . . 63
5.6 Most interesting pattern found for the indicators "postalcode" and "address" with the quality measure "Indicator of Interest & Local Reference" (Eq.3.8), regarding the chatbot "Employment". . . 63
5.7 Most interesting pattern found for the indicator "mail" with the quality measure "Indicator of Interest & Local Reference" (Eq. 3.8), regarding the chatbot "Em-ployment". . . 63
5.8 Most interesting pattern found for the indicator "phone" with the quality measure "Indicator of Interest & Local Reference" (Eq. 3.8), regarding the chatbot
"Em-ployment". . . 64
5.9 Details about nodes 31 and 32 of the chatbot "Employment". . . 64
5.10 Most interesting pattern found for the indicator "phone" with the quality measure "Indicator of Interest & Local Reference" (Eq. 3.8), regarding the chatbot "Em-ployment". . . 64
5.11 Pattern with the highest score of the quality measure "Average Dropout & Global Reference" (Eq.3.9), regarding the chatbot "Employment". . . 65
5.12 Pattern with the highest score of the quality measure "Minimum Dropout & Global Reference" (Eq.3.10), regarding the chatbot "Employment". . . 66
5.13 Pattern with the highest score of the quality measure "Average Dropout & Local Reference" (Eq.3.11), regarding the chatbot "Employment". . . 66
5.14 Pattern with the highest value obtained with the quality measure "Average Dropout & Global Reference" (Eq. 3.9), regarding the chatbot "Credit". . . 67
5.15 Pattern with the highest value obtained with the quality measure "Average Dropout & Local Reference" (Eq. 3.11), regarding the chatbot "Credit". . . 67
5.16 Information about the nodes with the identifiers 2 and 3, regarding the chatbot "Credit". . . 68
5.17 Most interesting pattern found for the indicator "terms" with the measure "Indica-tor of Interest & Local Reference" (Eq. 3.8), regarding the chatbot "Christmas". . 68
5.18 Pattern with the highest score of the quality measure "Average Dropout & Global Reference" (Eq.3.9), regarding the chatbot "Christmas". . . 69
5.19 Pattern with the highest score of the quality measure "Minimum Dropout & Global Reference" (Eq.3.10), regarding the chatbot "Christmas". . . 70
B.1 Information about the nodes of the chat "Credit". . . 90
B.2 Some sessions of the chat "Credit". . . 90
B.3 Information about the bifurcations of the chat "Christmas". . . 91
C.1 Most interesting pattern found for the indicator "terms" with the quality mea-sure "Indicator of Interest & Global Reference" (Eq. 3.7), regarding the chatbot "Credit". These results were obtained with the second approach and with a beam width of 1. . . 94
C.2 Most interesting pattern found for the indicator "terms" with the quality mea-sure "Indicator of Interest & Global Reference" (Eq. 3.7), regarding the chatbot "Credit". These results were obtained with the second approach, with a beam width of 1 and remove flat patterns activated. . . 95
C.3 Most interesting pattern found for the indicators "birthdate", "email" and "phone" with the quality measure "Indicator of Interest & Global Reference" (Eq. 3.7), regarding the chatbot "Credit". . . 95
C.4 Most interesting pattern found for the indicator "terms" with the the quality mea-sure "Indicator of Interest & Local Reference" (Eq. 3.8), regarding the chatbot "Credit". . . 96
C.5 Most interesting pattern found for the indicator "birthdate" with the the quality measure "Indicator of Interest & Local Reference" (Eq.3.8), regarding the chatbot "Credit". . . 97
C.6 Most interesting pattern found for the indicator "email" with the the quality mea-sure "Indicator of Interest & Local Reference" (Eq. 3.8), regarding the chatbot
"Credit". . . 97
C.7 Most interesting pattern found for indicator "phone" with the the quality measure "Indicator of Interest & Local Reference" (Eq.3.8), regarding the chatbot "Credit". 97 C.8 Pattern with the highest value of interest. . . 99
C.9 Pattern with the highest deviation. . . 99
C.10 Patterns with the highest deviation and final score of the quality measure "Average Dropout & Global Reference" (Eq.3.9), regarding the chatbot "Credit". . . 99
C.11 Patterns with the highest value of deviation and interest relative to quality measure "Minimum Dropout & Global Reference" (Eq.3.10), regarding the chatbot "Credit". 99 C.12 Text shown to the user in interactions 10 and 11, regarding the chat "Credit". . . . 101
C.13 Pattern with the highest value obtained with the quality measure "Average Dropout & Local Reference" (Eq.3.11), regarding the chatbot "Credit". . . 101
C.14 Information about the nodes with the identifiers 2 and 3, regarding the chatbot "Credit". . . 101
D.1 Patterns with the maximum score found for the indicator "terms" (16) . . . 105
D.2 Patterns with the maximum score found for the indicator "birthdate" (20) . . . 105
D.3 Patterns with the maximum score found for the indicator "email" (22) . . . 105
D.4 Patterns with the maximum score found for the indicator "phone" (27) . . . 105
D.5 Patterns with the maximum score found for the quality measure "Indicator of In-terest & Global Reference" (Eq.3.7), regarding the chatbot "Christmas". . . 105
D.6 Most interesting pattern found for the indicator "terms" with the measure "Indica-tor of Interest & Local Reference" (Eq.3.8), regarding the chatbot "Christmas". . 106
D.7 Most interesting pattern found for the indicator "birthdate" with the measure "In-dicator of Interest & Local Reference" (Eq.3.8), regarding the chatbot "Christmas".107 D.8 Most interesting pattern found for the indicators "email" and "phone" with the measure "Indicator of Interest & Local Reference" (Eq.3.8), regarding the chatbot "Christmas". . . 107
D.9 Pattern with the highest score of the quality measure "Average Dropout & Global Reference" (Eq.3.9), regarding the chatbot "Christmas". . . 108
D.10 Pattern with the highest score of the quality measure "Minimum Dropout & Global Reference" (Eq.3.10), regarding the chatbot "Christmas". . . 109
D.11 Pattern with the highest score of the quality measure "Average Dropout & Local Reference" (Eq.3.11), regarding the chatbot "Christmas". . . 110
2.1 Example of a sequential database [Fournier-viger and Lin,2017]. . . 8
2.2 Features of the breadth-first search algorithms of SPM. . . 11
2.3 IDListof the item A of the database represented in Table2.1. . . 12
2.4 Features of the depth-first search algorithms of SPM. . . 15
2.5 Features of the pattern-growth algorithms of SPM. . . 16
2.6 Features of the pioneering algorithms for SD [Herrera et al.,2011]. . . 23
2.7 Features of algorithms of SD based on classification [Herrera et al.,2011]. . . 25
2.8 Features of algorithms of SD based on association [Herrera et al.,2011]. . . 27
2.9 Features of algorithms of SD based on evolutionary algorithms [Herrera et al.,2011]. 28 4.1 Variations in the hyperparameters of the approaches for the analysis of the results. 57 5.1 Probability of the indicators of interest for chat "Christmas" . . . 59
5.2 Constraints needed to obtain the most interesting pattern for all the indicators of interest of the chatbot "Employment" and quality measure "Indicator of Interest & Global Reference" (Eq. 3.7). . . 62
5.3 Constraints needed to obtain the most interesting pattern for all the indicators of interest of the chatbot "Employment" and quality measure "Indicator of Interest & Local Reference" (Eq.3.8). . . 65
5.4 Constraints required to obtain the most interesting pattern for the dropout indicator of the chatbot "Employment" and quality measure "Average Dropout & Global Reference" (Eq.3.9). . . 65
5.5 Constraints needed to obtain the most interesting pattern for the dropout indicator of the chatbot "Employment" and quality measure "Minimum Dropout & Global Reference" (Eq.3.10). . . 66
5.6 Constraints needed to obtain the most interesting pattern for the dropout indica-tor of the chatbot "Employment" and quality measure "Average Dropout & Local Reference" (Eq.3.9). . . 67
5.7 Set of general hyperparameters that allow the discovery of all the patterns men-tioned in Chapter5. . . 71
A.1 Features of Sequential Pattern Mining algorithms. . . 84
A.2 Features of Subgroup Discovery algorithms [Herrera et al.,2011]. . . 85
B.1 Format of the data present in the supplied CSV files. . . 89
C.2 Constraints needed to obtain the most interesting pattern for the indicators of in-terest of the chatbot "Credit" and quality measure "Indicator of Inin-terest & Global Reference" (Eq.3.9). . . 96
C.3 Constraints needed to obtain the most interesting pattern for the indicators of in-terest of the chatbot "Credit" and quality measure "Indicator of Inin-terest & Local Reference" (Eq.3.9). . . 98
C.4 Constraints needed to obtain the most interesting pattern for the dropout indicator of the chatbot "Credit" and quality measures "Average Dropout & Global Refer-ence" (Eq. 3.9) and "Average Dropout & Local Reference" (Eq.3.11). . . 100
C.5 Constraints needed to obtain the most interesting pattern for the dropout indicator of the chatbot "Credit" and quality measure "Minimum Dropout & Global Refer-ence" (Eq. 3.9). . . 101
D.1 Probability of the indicators of interest for chat "Christmas" . . . 103
D.2 Constraints needed to obtain the most interesting pattern for all the indicators of interest of the chatbot "Christmas" and quality measure "Indicator of Interest & Global Reference" (Eq. 3.9). . . 106
D.3 Constraints needed to obtain the most interesting patterns for all the indicators of interest of the chatbot "Christmas" and quality measure "Indicator of Interest & Local Reference" (Eq. 3.8). . . 108
D.4 Constraints needed to obtain the most interesting pattern for the dropout indica-tor of the chatbot "Christmas" and quality measure "Average Dropout & Global Reference" (Eq.3.9). . . 109
D.5 Constraints needed to obtain the most interesting pattern for the dropout indicator of the chatbot "Christmas" and quality measure "Minimum Dropout & Global Reference" (Eq.3.10). . . 110
D.6 Constraints needed to obtain the most interesting pattern for the dropout indica-tor of the chatbot "Christmas" and quality measure "Average Dropout & Local Reference" (Eq.3.11). . . 110
DM Data Mining PM Pattern Mining SM Sequence Mining
SPM Sequential Pattern Mining SD Subgroup Discovery EMM Exceptional Model Mining BFS Breadth-First Search DFS Depth-First Search
Introduction
Chatbots, or conversational agents, have been used in a variety of contexts. They have provided a natural language interface to their users with increased sophisticated design [Kerly et al.,2007]. Commerce, entertainment [Shawar and Atwell, 2007a], education [Jia, 2003], security training [Kowalski et al.,2009] and public sector [McNeal and Newyear,2013] are some examples where the use of chatbots has already been adopted. Chatbots are computer programs designed to simu-late conversation with human users using hearing or textual methods. The first chatbot developed was ELIZA in 1966 [Weizenbaum, 1966]. ELIZA analysed the input phrases and returned an output based on reassembly rules associated with the decomposition of the input provided. Its al-gorithm did not keep the interactions in memory and so it was not possible to develop some type of collaboration or negotiation. However, this algorithm was the first that produced a feeling of con-cern with users, as it was the first natural language processing computer program. Since ELIZA, many chatbots have been created. Some aimed at improving other algorithms, others developed from scratch. They are often integrated into multi-purpose dialogue systems, including consumer service, information acquisition or even language learning [Fryer and Carpenter,2006].
In this dissertation, the chatbots taken into account are inserted in a business context. The use of chatbots in business contexts, as a way of communicating with customers, is becoming more common nowadays [Anwar and Abulaish,2014b]. With this proliferation of machine-to-human contact and increase of complexity in dialogues, the question arises of whether communication is being performed correctly. A better understanding of customer needs and system performance is something that must be streamlined. This can lead to a better achievement of business goals and costumer needs.
The process of creating a chatbot encompasses the design, building, and monitoring of the system. However, many companies avoid the last phase or use poor analysis methods (e.g. number of users and how long a user takes during a session) that do not allow them to do an in-depth analysis and study of their chatbot.
Data mining is one of the scientific areas that can be used to address these types of problems. In particular, in this dissertation a data mining approach is used for the analysis of conversation data from chatbots.
1.1
Motivations and Objectives
The most successful chatbots are constantly adapting and revising their conversation flows in re-sponse to their users [Shawar and Atwell,2007b]. In this way, the analysis of chatbots’ conver-sations is an opportunity to improve the quality of services. However, building a bot that provide a good user experience during dialog is known to be a challenging task [AlHagbani and Khan,
2016]. The dialog flow in a chatbot conversation is not homogeneous (i.e. the flow of interactions of different users may not be the same, since users do not always have the same behaviour in a conversation) and there is a lot of implicit subjectivity. The quality of the questions may not be appropriate or the desired one, there may be out-of-date questions and even questions that, while correct, may not contribute to the company goals and costumer needs. Therefore, understanding the improvements that must be made, or identify the best practices that should be generalized, is of great importance. However, this task can be quite challenging and time-consuming, since the processing and analysis of large amounts of data can become quite complex. Therefore, there is a need to find methods to automate it.
The main objective of this dissertation is the development of an algorithm that allows the discovery of unexpected user behaviours in chatbot data. The flow of a chatbot conversation is represented as a sequence of questions and answers. In this way, a conversation is understood as a system consisting of questions and answers where the questions are asked by the bot and the answers given by the client. This dissertation addresses this problem as a combination of Subgroup Discovery and Sequential Pattern Mining techniques. While Sequential Pattern Mining is concerned with finding frequent patterns in sequences, Subgroup Discovery is the discovery of patterns with unusual behaviour. With this in mind, the purpose of this dissertation is to create a Subgroup Discovery algorithm, which allows the discovery of unexpected user behaviour. A user behaviour can be represented by a set of interactions. In this way, a behaviour can be interpreted as a pattern of interactions.
An unexpected behaviour can be either positive (i.e. interactions that exceeds expectations) or negative (i.e. interactions below expectations) in terms of business goals. A subgroup is evaluated according to the deviation from mean reference values. For example, a subgroup that has a higher than usual proportion of provided email address can be considered a positive subgroup. In the same context, a subgroup that has a proportion of provided email address lower than the average of the reference population can be considered a negative subgroup. The purpose of this dissertation is to find both types of subgroups.
From the business point of view, the main objective of this dissertation is to improve the interactions between company and client in a context of chatbots. This improvement is based on the behavioural patterns of chatbots users. The results from this dissertation can help foster the company’s sales and improve customer satisfaction, which can be translated into business success. On the one hand, the results obtained from the negative patterns can be used as decision support for corrections of system failures. On the other hand, the positive patterns found can lead to the discovery of best practices that can be further extended to other components or business areas.
These discoveries can lead companies to achieve, in a more precise and fast way, the increase of their sales and the improvement of the satisfaction of their customers.
1.2
Structure of the Dissertation
The present dissertation is subdivided into six chapters, beginning with the current chapter, the introduction, describing the context, motivation and objectives.
Chapter 2starts with the definition of a chatbot and a presentation of the different types of analytics in this field. Then, it introduces the concepts of Sequential Pattern Mining and Subgroup Discovery.
In chapter3the design and implementation of the various approaches developed to solve this problem are presented and described. This chapter also contains the different measures used to evaluate patterns as unusual or not. Finally, a preliminary analysis of the results with artificial data is presented.
Chapter4presents the experimental setup used to obtain and evaluate the results. Some im-plementation details are also mentioned.
In chapter5the results obtained within this dissertation are described and analysed.
In the last chapter, Chapter 6, the conclusions reached throughout this dissertation are de-scribed. Finally, the contributions of this project and some possibilities for future work are also presented.
Literature Review and Background
With the increase in the amount of data available, the interest and need for data mining and data analytics techniques is also growing.
Data Mining (DM) is the extraction of implicit, potentially useful, and previously unknown knowledge from data. It involves the development of computational systems capable of retrieving regularities and patterns from data. This collection process can be automatic or semiautomatic [Witten et al., 2017]. DM applications focus on knowledge acquisition and future predictions based on past data. The domain of these systems is quite extensive, both in scientific and business terms [Kaur and Wasan,2006].
Analytics is known as the area of discovery, interpretation and communication of patterns in data. Analytics forms an important part of Business Intelligence, which converts raw data into useful information. It is related to solving problems in business fields, enterprise decision manage-ment, sales force sizing and optimisation, price and promotion modelling, etc. The methodological foundations for analytics are statistics, mathematics, data mining, programming and operations research, as well as data visualisation in order to communicate insights learned to the relevant stakeholders. There are several branches or domains of analytics. Some examples are marketing analytics, people analytics, risk analytics and web analytics [El-Nasr et al.,2016].
From the definitions of both areas, it is possible to perceive that they are essentially equivalent terms. However, analytics is more encompassing and more popular in business than in academia.
This chapter presents the state of the art on the topics covered in this dissertation. The concept of chatbot and the type of analysis that exists nowadays are also presented. Finally, some Pattern Mining themes related to this dissertation are addressed, namely Sequential Pattern Mining and Subgroup Discovery.
2.1
Chatbots
A chatbot is known as a conversational agent that interacts with users using natural language [Shawar and Atwell,2003]. This interaction is performed taking into account a particular context or topic and can be done using visual and textual commands.
The first chatbot, short for the term chatterbot, was developed in the 1960s with the aim of impersonating a human and trying to deceive users about the identity of who would be interacting with them: a human or a machine [Shawar and Atwell,2007a]. Nowadays, chatbots are created for other purposes. Chatbots are present in several significant areas, as referred in Chapter1.
Nowadays, chatbots often start the dialogue by making themselves available on websites. Usu-ally, the conversation with a chatbot is initiated by a first approach made by the user. This can be the sending of a message, the click of a button, among others. This first approach indicates the intention of communication with the bot and triggers a response or comment of the bot, which consequently leads to the beginning of a dialog [Huang et al.,2007].
2.1.1 Chatbots Analytics
Chatbots can help brands maintain a high-quality omnichannel presence by guiding customers to the right information. Bot analytics can give marketers information they need to improve the cus-tomer experience by improving chatbot performance. Businesses are increasingly using chatbots as conversation interfaces to customers, so the value of chatbots analytics tools is likely to rise. Chatbots analytics is the area of analytics that addresses the problems more closely related to this dissertation. Analytics applied to chatbots is an area where there is not much research known so far. The most common type of statistics used for chatbots analysis are the number of users and how long a user takes during a session. It is an area where the first steps are still being taken, but it has been growing over time. A few analytics tools for chatbots are starting to emerge [CMSWire,
2018].
Recently, a new chatbot developed by Google was released. In November 2017, this company launched Chatbase [Google,2017], a dedicated chatbot analytics platform. This new tool allows visualisation of the flow of conversations to understand how effectively users interact with the bot. This company has also led the analytics charge years ago with the Google Analytics tool. The news was shared by the media.1 Chatbase allows visualisation of the flow of conversations to understand how efficiently users interact with the bot. It also provides information like number of daily sessions, daily sessions per user, sessions per user and user messages per session. Other metrics are the percentage of users who were present at the time of a given request, and agent response time, representing how long it took the bot to respond. In this way, the evaluation metrics in Chatbase are basically focused on usage volume and response times.
The evaluation metrics used so far do not address behavioural analyses regarding a specific interaction. In addition, the metrics that currently exist also do not allow understanding the be-havioural patterns of chatbots users based on their interactions with the bot. Measures that make it possible to discover unusual patterns in chatbots systems is something that is also missing. With this in mind, it is possible to realise that there is a gap in the existing analyses for chatbots.
In this dissertation the analytics applied to chatbots are based on their interactions. In the proposed approach, the behavioural analysis of users is made from the discovery of interesting patterns in the interactions between bot and users.
2.2
Pattern Mining
Pattern mining (PM) is a topic of Data Mining which focuses on the discovery of interesting, useful, and unexpected patterns in the data. The interest in pattern mining techniques comes from the ability to discover hidden patterns in large databases that are interpretable by humans and which prove to be useful for understanding data and for making decisions [Fournier-viger and Lin,2017].
PM has become very popular due to its applications in several fields. PM algorithms can be applied to various data types such as sequence databases, transaction databases [Fournier-viger and Lin,2017], graphs [Anwar and Abulaish,2014a], World Wide Web databases [Cooley et al.,
1997], among others. The topics of PM that will be addressed in this dissertation are:
• Sequential Pattern Mining - Frequent Pattern Mining is concerned with finding patterns with a frequency of occurrence greater than or equal to a certain value. Frequent patterns are item sets that appear in data with a frequency of occurrence not less than a user-specified threshold [Han et al.,2007]. Sequential pattern mining is concerned with the discovery of frequent patterns in sequential databases [Chand et al.,2012]. Data in the form of sequences can be found in many fields such as text analysis, market basket analysis, webpage click-stream analysis, bioinformatics, among others [Fournier-viger and Lin,2017] (Chapter2.3).
• Subgroup Discovery - Subgroup Discovery is concerned with finding rules describing sub-sets of the population that are sufficiently large and statistically unusual [Lavraˇc et al.,
2004b] (Chapter2.4).
2.3
Sequential Pattern Mining
Sequence Data Mining was first introduced in 1995 in the context of market analysis [Agrawal and Srikant,1995]. This area can be translated as Data Mining applied to sequences. In this way, the purpose of Sequence Mining problems is to get knowledge from sequential data.
Sequential Pattern Mining has emerged as the intersection between Pattern Mining and Se-quence Data Mining. It is a technique that aims to find interesting sequential patterns among large databases. Similarly to Frequent Pattern Mining, the patterns obtained are subsequences that occur with a frequency not less than a user-defined threshold [Chand et al.,2012].
Below, the fundamental concepts of the Sequential Pattern Mining problem, required for the understanding of this dissertation, are presented [Boghey and Singh,2013] [Chand et al.,2012]. Table2.1serves as an illustrative example for the following definitions.
Table 2.1: Example of a sequential database [Fournier-viger and Lin,2017]. Sequence ID Sequence 1 < {A, B}, {C}, {F, G}, {G}, {E} > 2 < {A, B}, {C}, {B}, {A, B, E, F} > 3 < {A}, {B}, {F, G}, {E} > 4 < {B}, {F, G} >
Let us consider I = {I1, ..., Im} a set of m distinct attributes called items. An itemset is defined
as a non-empty subset of items and an itemset with m elements is called a m-itemset. For example, in a supermarket sales context, considering that I = {A, B,C, D, E, F, G} represents all products in a supermarket, the set {A, B} represents an itemset with 2 products (items) of I. This itemset can represent a transaction.
A sequence is an ordered list of itemsets. A sequence S with length l is defined as < s1, s2, ..., sl>,
where each element of the sequence S (si) is an intemset. In this way, siis an element representing
a set of items. Since the order of items in a set is not relevant, then the order of the attributes in si
is also not relevant.
Each row in Table2.1is a sequence. In the same context of the previous paragraph, each line can be considered a customer and the set of transactions that each client has already performed. The length of a sequence is the number of transactions in it. A sequence with length l is a l-sequence. For example, the sequence < {B}, {F, G} > has length equal to 2, so it can be called a 2-sequence. Let S be a l-sequence and len(S) the length of the sequence, len(S) = l and the i-th itemset is defined as S[i]. An item can only exist once in an itemset, but can exist multiple times in various itemsets in a sequence.
A sequence Sa=< s1, s2, ..., sl > is a subsequence of a sequence Sb=< y1, y2, ..., ym> with
l≤ m and Sb is a supersequence of Sa if there exists integers 1 ≤ i1≤ i2≤ ... ≤ il ≤ m such
that s1 ⊆ yi1, s2 ⊆ yi2, ..., sl ⊆ yil. For example, in Table 2.1, the sequence < {B}, {F, G} > is
contained in the sequence < {A, B}, {C}, {F, G}, {G}, {E} > and the sequence < {B}, {G}, {F} > is not contained in the sequence < {A, B}, {C}, {F, G}, {G}, {E} >. This is due to the fact that each itemset of the sequence < {B}, {F, G} > (denominated Sc) is contained in an itemset of
the sequence < {A, B}, {C}, {F, G}, {G}, {E} > (denominated Sd), in the same order. In this way,
itemset{B} of sequence Scis contained in the itemset {A, B} of sequence Sdand the itemset {F, G}
of sequence Scis contained in the itemset {F, G} of sequence Sd. In addition, the corresponding
itemsetsof each sequence occur in the same order, which allows to conclude that the sequence Sc
is a subsequence of the sequence Sd. This does not happen with respect to the < {B}, {G}, {F} >
(denominated Se) and Sd sequences. All itemsets of the sequence Se are contained in itemsets of
the sequence Sd, however the order is not the same in both sequences. Taking this into account, Se
is not a subsequence of Sd.
Taking as an example a sequence C, which represents a customer’s purchase history, C can be define as < {bread}, {ham, cheese}, { f ruit} >. This sequence of transactions represents 3 purchases. In this way, it is possible to verify that the customer first bought bread, then made a
purchase where he bought ham and cheese and then another transaction where he bought fruit. The sequence Y =< {bread}, {ham, cheese} > is a subsequence of C, since the transactions of the sequence Y are contained in the transactions of C in the same order. However, the sequence Z=< {bread}, {ham} > is not contained in C, since there is no purchase with only ham after the transaction {bread}.
All Sequential Pattern Mining (SPM) algorithms use two types of basic operations for explor-ing the search space, s-extensions and i-extensions. The generation of an s-extension sequence Sa
of sequence Sbis made from the addition of a new itemset to Sbafter all existing itemsets. If si is
the new itemset, Sacan be defined as Sa= Sb∪ {si}. The generation of an i-extension sequence Sa
of sequence Sbis made from the addition of a new item to the last itemset of Sb. This new item is
added to the last position of the itemset [Fournier-Viger et al.,2017]. Being i the new item to be added and Ibthe last itemset of Sb, after the i-extension operation, Ibcan be defined as Ib= Ib∪ {i}.
When generating or discarding frequent sequential patterns, some types of constraints may be taken into account. The minimum and maximum length (length constraints) are constraints relative to the minimum and maximum number of itemsets of a sequence. Another example of constraints is the minimum support. This corresponds to the minimum number of times a pattern needs to occur to be considered frequent. There are also the gap constraints. These are relative to the minimum and maximum distance between two consecutive itemsets of a sequence. This distance is measured in itemsets. The above restrictions are some of the easiest and most beneficial to integrate in a pattern mining algorithm, as they can be used to prune the search space [ Fournier-Viger et al.,2017].
2.3.1 Existing Algorithms
Over the years there have been quite a few algorithms developed in the area of Sequential Pattern Mining. All Sequential Pattern Mining algorithms receive as input the sequence data from which patterns are to be discovered and a minimum support provided by the user. At the end, the al-gorithm returns the set of patterns found in the data that have a frequency of occurrence greater than or equal to the minimum support. It is important to note that there is always only one correct answer to a sequential pattern mining task (for a given sequence database and minimum support). Thus, the different SPM algorithms do not differ in their output. The difference between the various algorithms lies in the way they discover the sequential patterns and in the computational complexity. Various algorithms use different strategies and data structures to search for sequential patterns efficiently. As a result, some algorithms are more efficient than others [Fournier-Viger et al.,2017].
In general, SPM algorithms differ in search strategy, in the internal representation of the database, in the way they calculate the support of a given pattern, in the generation of patterns to be explored and in their constraints. In this section the advantages and limitations of the main Sequential Pattern Mining algorithms are presented, according to the mentioned characteristics. The SPAM algorithm will be described in more detail. This is due to the fact that this algorithm
was chosen as the base algorithm for the implementation of this dissertation. The reason for this choice is discussed in Section3.3.1.
In relation to the search strategy an algorithm can be categorised as using breadth-first or depth-first search.
2.3.1.1 Breadth-first Search Algorithms
Breadth-first search algorithms use an approach called a level-wise approach. This is due to the fact that this type of algorithm generates patterns in ascending order of their length. In this way, the database is initially scanned in order to find all the frequent patterns with length equal to 1. Subsequently, patterns with 2 items (length equal to 2) are generated using operations s-extensions and i-extensions. This generation of patterns with incremental size continues until it is not possible to generate more sequences [Fournier-Viger et al.,2017].
Below are the two most popular breadth-first search algorithms in the SPM area:
• AprioriAll [Agrawal and Srikant,1995] - The algorithm AprioriAll was one of the algo-rithms that served as the basis for many other algoalgo-rithms. This algorithm is based on the Apriori property. This property can also be called downward-closure property or anti-monotonicity. It states that if a sequence is not frequent, then all its extensions will not be either. This property also states that all non-empty subsequences of a given frequent se-quence are also frequent. This property is quite useful in pruning the search space. The generation of candidate sequences is done according to the Apriori-generate join procedure. Non-existent candidate patterns are generated and all candidate patterns are kept in memory. [Chand et al.,2012]. This algorithm applies a level-wise search strategy for finding frequent patterns. It uses a horizontal representation of the database. A horizontal representation of the database consists of a table, where for each sequence ID is obtained the entire sequence. Table2.1is an example of a horizontal representation of the database. This representation is made from multiple scans to the database. This means that the database is read multiple times. Initially, all 1-sequence patterns are discovered and stored in memory. Subsequently, the size of the frequent sequences to be discovered is increased. At each iteration a new scan is made to the database and the frequent patterns found are stored in memory. The fact that this algorithm performs several scans to the database and maintains the candidate patterns in memory significantly affects the performance. Another limitation of this algorithm is that it generates candidate patterns that may not exist. This limitation may also affect the speed of the algorithm.
• GSP (Generalized Sequential Patterns) [Srikant and Agrawal, 1996] - The authors of the algorithm AprioriAll then proposed an improved version called GSP. This algorithm intro-duced maximum and minimum interval constraints between two itemsets of a sequence (gap constraints).
Table 2.2: Features of the breadth-first search algorithms of SPM. Algorithm Search Strategy Database Rep-resentation Support Calculation Generation of Candi-date Sequences Constraints AprioriAll Breadth-first search Horizontal database Multiple scans to the database Apriori-Based (generate-candidate-and-testapproach) Minimum sup-port GSP Breadth-first search Horizontal database Multiple scans to the database Apriori-Based (generate-candidate-and-testapproach) Minimum sup-port; gap con-straints
2.3.1.2 Depth-first Search Algorithms
The difference between algorithms with a breadth-first search strategy and a depth-first search strategy lies in how the candidate sequences are generated. In algorithms that have a DFS strategy the generation of candidate patterns is made from the generation of super-sequences of a certain sequence until it is not possible to expand further. Only after all possible super-sequences of a given sequence (node) have been expanded it is possible to explore another node of the same level. In algorithms with a BFS strategy, first, all nodes of a certain level (all sequences with the same length) are exploited. Subsequently the sequences of the following nodes (sequences with larger sizes) are explored. DFS algorithms allow patterns with a larger size to be generated earlier. This leads to discarding more research paths. In this way, the number of candidate patterns that appear to be non-frequent generated is smaller compared to BFS algorithms [Chand et al.,2012].
Below are some well known depth-first search algorithms used in the SPM area:
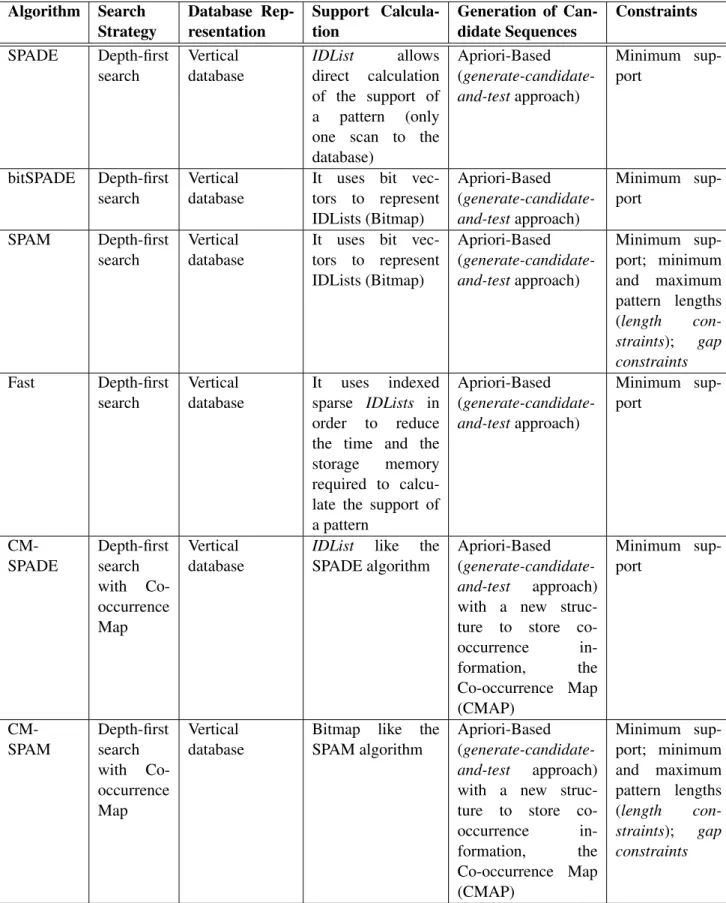
• SPADE (Sequential PAttern Discovery using Equivalence classes) [Zaki,2001] - This algo-rithm was created to correct the disadvantages of the GSP algoalgo-rithm. SPADE is based on a frequent itemset mining algorithm, Eclat [Zaki,2000]. It utilises a vertical database repre-sentation rather than a horizontal database reprerepre-sentation. The vertical reprerepre-sentation of a sequence database indicates the itemsets where each item appears in the sequence database. For a given item, this information is called the IDList of the item. This representation greatly facilitates the calculation of support of a sequence. Using a vertical representation of the database causes the database to be scanned only once. From the IDList of a given pattern it is possible to know the support of this pattern. This support is given by the number of dif-ferent sequence identifiers in the table (vertical table rows). Table2.3illustrates the vertical representation for item A (IDList of item A) of the database represented in the horizontal table2.1. Note that for the vertical representation of the entire database, a table is made for each item in table2.1. This new representation leads to an improvement in performance over BFS algorithms. A disadvantage of this algorithm in relation to GSP is the impossibil-ity of defining gap constraints. In this algorithm it is only possible to define the minimum support for the patterns found.
Table 2.3: IDList of the item A of the database represented in Table2.1. Sequence ID Itemsets 1 1 2 1, 4 3 1 4
exploits the search space with a DFS strategy. The entire database is scanned only once for the creation of IDLists for all items. Subsequently, to create the IDList of a pattern it is only necessary to join the items of the pattern. In previous algorithms, when an item appears in many sequences, its IDList was too long. This leads to the joining operation of two IDLists having a high cost. An improvement made by this algorithm was the use of bit vectors as a representation of IDLists (Bitmap). The pruning technique followed by this algorithm is based on the Apriori property, both for i-extentions and for s-extensions. Another advantage of this algorithm in relation to SPADE is that it is possible to define gap constraints and length constraints[Fournier-Viger et al.,2017].
Algorithm 1 illustrates the pseudocode of the SPAM algorithm. Initially, it is necessary to find all items with a support greater than or equal to the minimum support (minSup). The database is scanned to create the vertical representation of the database. From the vertical representation the frequent items are identified. Subsequently, for each sequence consisting of an itemset with an item belonging to the list of frequent items an DFS is done to find s-extensions and i-extensions. The process of generation s-extensions corresponds to the s-extension step (S-step in Algorithm 1) and the process of generating i-extensions corresponds to the i-extension step (I-step in Algorithm1). In this way, it is possible to associate with each sequence Seq =< s1, ..., s|Seq|>, where |Seq| represents the length of
the sequence Seq, two sets: SSSnnn, the set of candidate items that are considered for possible
S-step extensions of sequence Seq, and IIInnn, which identifies the set of candidate items that
are considered for a possible I-step extensions. In each sequence, the support of each s-extended child and each i-extended child is tested. If the support of a generated sequence Seq is greater than or equal to minSup, that sequence is saved and then the DFS (function DFS-Pruning in the Algorithm1) is repeated recursively on Seq. If the support of Seq is less than minSup, then it is not necessary to repeat the DFS on Seq by the Apriori property, since any child sequence generated from Seq will not be frequent. If none of the generated children are frequent, then the sequence is a leaf and we can backtrack up the tree [Ayres et al.,2002].
It should also be noted that in algorithm1, an item i is greater than an item j in case j occurs after i. As an example, in the sequence < {A, B,C}, {A,C} > B and C are greater than A and C greater than B. This is because B and C occur sequentially after A and C occur sequentially after B.
SPAM(Sequential Database, minSup)
Vertical Representation← Vertical Representation of the Sequential Database
Frequent Items← list of frequent items taking into account the Vertical Representation for each item i ∈ Frequent Items do
DFS-Pruning(< {i} >, Frequent Items, all elements in Frequent Items greater than s, minSup)
end
DFS-Pruning(Seq =< s1, ..., s|Seq|>, Sn, In, minSup)
Stemp= /0
Itemp= /0
for each item i ∈ Sndo
if < s1, ..., s|Seq|, {i} > is frequent then
Stemp= Stemp∪ {i}
end
for each item i ∈ Stempdo
DFS-Pruning(< s1, ..., s|Seq|, {i} >, Stemp, all elements in Stempgreater than i, minSup)
end
for each item i ∈ Indo
if < s1, ..., s|Seq|∪ {i} > is frequent then
Itemp= Itemp∪ {i}
end
for each item j ∈ Itempdo
DFS-Pruning(< s1, ..., s|Seq|∪ {i} >, Stemp, all elements in Itempgreater than i, minSup)
end
Algorithm 1: The pseudocode of the SPAM algorithm [Ayres et al.,2002].
• Fast [Salvemini et al.,2011] - Fast was inspired by the SPAM algorithm. This algorithm introduces the concept of indexed sparse IDLists. This new type of storage structure was introduced in order to reduce the time required to calculate the support of a pattern and the storage memory required.
• CM-SPADE (Co-occurrence MAP - SPADE) and CM-SPAM (Co-occurrence MAP - SPAM [Fournier-Viger et al.,2014]) - One of the disadvantages of SPAM and SPADE is that they follow a generate-candidate-and-test approach. In this way, the patterns are generated first and then tested, in order to verify if they are frequent or not. Although the generation of non-frequent candidates is less than in horizontal representations of the database, non-non-frequent patterns continue to be generated. As a way of trying to improve this,Fournier-Viger et al.
[2014] proposed a new approach. This new approach involves the creation of a new struc-ture to store co-occurrence information, the Co-occurrence Map (CMAP), which allows a better pruning of the search space. This new structure is created from the initial scan of the database. In this step all the sequences with the size of two (2-sequences) are saved. Subse-quently, for each pattern to be considered, it is checked if its last two items are frequent or not. If they are not, this pattern is no longer considered and is not generated [Fournier-Viger et al.,2017].
In Table2.4, the algorithms described above are summarised.
2.3.1.3 Pattern-growth Algorithms
In addition to the DFS and BFS algorithms, there are also the pattern-growth algorithms. One of the problems of the DFS and BFS algorithms is the generation of candidate sequences that may not exist in the database. These algorithms use a generate-candidate-and-test approach. Generating patterns is done by joining smaller patterns. This happens because the database is scanned only once. In this way, in the pattern generation phase it is not verified whether a pattern is possible or not. It is only in the testing phase that the invalid sequences are disregarded.
Pattern-growth algorithms are algorithms that have a depth-first search strategy and that at-tempt to solve the referred problem. These algorithms avoid the problem described above by recursively scanning the database to find larger patterns (divide-and-conquer approach). Thus, they only consider patterns actually appearing in the database. However, one disadvantage of this type of algorithm is the cost in terms of time and space, since many scans and database projec-tions are being made. A projection of the database for a sequential pattern S contains all and only the necessary information for mining the sequential patterns that can grow from S. In terms of memory, creating database projections can consume a huge amount of memory if it is naively implemented, as in the worst case it requires to copy almost the whole database for each database projection [Fournier-Viger et al.,2017].
Below are some relevant pattern-growth algorithms used in the SPM area:
• FreeSpan (Frequent pattern projected Sequential pattern mining) [Han et al., 2000a] -FreeSpan was developed to reduce the cost associated with the generation of non-frequent candidate patterns, which was based on the Apriori property. This algorithm performs sev-eral projections of the database recursively from the existing frequent items. From each projection several subsequences are formulated. In this way, the size of the projections of the databases is decreasing. Given this, the tests to be performed are also becoming more and more specific as several subsequences are being created. The disadvantage of this algo-rithm is the amount of repeated patterns it can generate [Chand et al.,2012]. Moreover, in terms of runtime, performing multiple scans to the database leads to a high cost [ Fournier-Viger et al.,2017].
• PrefixSpan (Prefix-projected Sequential pattern mining) [Pei et al.,2004] - This algorithm was based on the FPGrowth algorithm [Han et al.,2004], proposed in the area of itemset mining. Prefix-Span comes as an optimized version of the FreeSpan algorithm. As with FreeSpan, Prefix-Span only scans existing patterns in the database. However, FreeSpan has a high cost associated with performing multiple scans in the database. As a way of trying to improve runtime, this algorithm introduces the concept of pseudo-projection. This concept is based on the projection of the database from a set of pointers to the initial database [Fournier-Viger et al.,2017].
Table 2.4: Features of the depth-first search algorithms of SPM. Algorithm Search Strategy Database Rep-resentation Support Calcula-tion Generation of Can-didate Sequences Constraints SPADE Depth-first search Vertical database IDList allows direct calculation of the support of a pattern (only one scan to the database) Apriori-Based (generate-candidate-and-testapproach) Minimum sup-port bitSPADE Depth-first search Vertical database
It uses bit vec-tors to represent IDLists (Bitmap) Apriori-Based (generate-candidate-and-testapproach) Minimum sup-port SPAM Depth-first search Vertical database
It uses bit vec-tors to represent IDLists (Bitmap) Apriori-Based (generate-candidate-and-testapproach) Minimum sup-port; minimum and maximum pattern lengths (length con-straints); gap constraints Fast Depth-first search Vertical database It uses indexed sparse IDLists in order to reduce the time and the storage memory required to calcu-late the support of a pattern Apriori-Based (generate-candidate-and-testapproach) Minimum sup-port CM-SPADE Depth-first search with Co-occurrence Map Vertical database
IDList like the SPADE algorithm
Apriori-Based (generate-candidate-and-test approach) with a new struc-ture to store co-occurrence in-formation, the Co-occurrence Map (CMAP) Minimum sup-port CM-SPAM Depth-first search with Co-occurrence Map Vertical database
Bitmap like the SPAM algorithm
Apriori-Based (generate-candidate-and-test approach) with a new struc-ture to store co-occurrence in-formation, the Co-occurrence Map (CMAP) Minimum sup-port; minimum and maximum pattern lengths (length con-straints); gap constraints
In Table2.5, the algorithms described above are summarised.
Although this type of algorithm only generates existing patterns in the database, its runtime is not very good. Algorithms like the CM-SPADE proved to be faster [Fournier-Viger et al.,2017].
Table 2.5: Features of the pattern-growth algorithms of SPM.
Algorithm Search Strategy Database Rep-resentation Support Calculation Generation of Candi-date Sequences Constraints FreeSpan Depth-first search Database pro-jections Elaborates several pro-jections of the database Pattern-Growth-Based (divide-and-conquer approach) Minimum sup-port PrefixSpan Depth-first search Pseudo-projections Elaborates several pseudo-projections of the database Pattern-Growth-Based (divide-and-conquer approach) Minimum sup-port; maximum pattern length
TableA.1lists all Sequential Pattern Mining algorithms mentioned.
2.4
Subgroup Discovery
Subgroup discovery is a data mining technique that aims to discover interesting relationships be-tween objects relative to a particular property or variable. The patterns found are called subgroups and are usually represented in the form of rules. These patterns combine a component of interest relative to a certain value and another component related to the frequency of occurrence of the pattern. The interest component of a pattern is associated with its deviation from the population.
The concept of finding interesting subgroups in data was first introduced in the 1990s as Data Surveying. According toHerrera et al.[2011], Subgroup Discovery can be defined as:
In subgroup discovery, we assume we are given a so-called population of individuals (objects, customers, ...) and a property of those individuals we are interested in. The task of subgroup discovery is then to discover the subgroups of the population that are statistically “most interesting”, i.e. are as large as possible and have the most unusual statistical (distributional) characteristics with respect to the property of interest.
A rule R, that represent a subgroup, can be defined as [Lavraˇc et al.,2004a]:
R: Con junction → TargetClass (2.1)
The antecedent of the rule R, Conjunction, is a conjunction of features that represents pairs of attributes and values. The consequent of the rule, TargetClass, is the target class that represents the
As an example, let D be a dataset with three variables: Age = {Less than 25, 25 to 60, More than 60}, Sex = {M, F} and Country = {Spain,U SA, France, German},and a variable of interest target variable Money = {Poor, Normal, Rich}. Some possible rules containing subgroup descrip-tions are:
R1: (Age = Less than 25 AND Country = German) → Money = Rich (2.2)
R2: (Age = More than 60 AND Sex = F) → Money = Normal (2.3)
Rule R1 (Eq. 2.2) represents a subgroup of german people with less than 25 years old for
which the probability of being rich is unusually high with respect to the rest of the population. According to rule R2 (Eq. 2.3), women with more than 60 years old are more likely to have a
normal economy than the rest of the population.
Subgroup Discovery is based on local exceptionality detection. In this way it seeks to know how locally exceptional a subgroup is relative to a target population. The target population is usually the total population. An area that also aims to detect this type of locally interesting patterns in contrast to global models is Local Pattern Mining [Atzmueller,2015].
2.4.1 Main Elements of a Subgroup Discovery Algorithm
Subgroup Discovery (SD) takes into account several elements when applying an SD approach. These elements are related to the characteristics of the problem and the algorithm. It is possible to refer as main elements of an SD approach the following aspects [Herrera et al.,2011]:
• Type of the Target Variable - The analysis of the problem depends on the nature of the variable. The variables under study in an SD problem can have different types: binary, numerical or nominal or categorical.
In case of a binary problem, the variables will have only two values (True or False). In this case it will only be necessary to find a subgroup for each of the two values, since the task is focused on providing interesting subgroups for the possible values, True or False.
A Nominal problem is treated in the same way as a Binary problem, but with the dif-ference that the target variable can have a undetermined number of values.
The numerical problem is a bit more complex than the previous ones. In this case, the variable can be studied in different ways such as dividing the variable in two ranges with respect to the average, discretizing the target variable in a determined number of intervals [Moreland and Truemper,2009], or searching for significant deviations of the mean, among others.
• Description Language - The description language refers to how the subgroups or rules are represented. These should be simple and suitable for obtaining interesting rules. Therefore,
these are represented as attribute-value pairs in conjunctive or disjunctive normal form in general. A formula is in conjunctive normal form if it is a conjunction of one or more clauses, where a clause is a disjunction of literals. It can also be described as an AND of ORs. A literal is an atomic formula (atom) or its negation. A logical formula is considered to be in disjunctive normal form if and only if it is a disjunction of one or more conjunctions of one or more literals. It can also be described as an OR of ANDs.
• Quality measures - A quality measure of an SD algorithm is an evaluation measure of some particular aspect of a subset of individuals in relation to the total population. These measures represent the parameters for the evaluation and extraction of the rules. Furthermore, they provide the expert with the importance and interest of the subgroups obtained. A quality measure is a function that assigns a numeric value to a subgroup taking into account specific parameters [Duivesteijn and Knobbe,2011]. There is no consensus about the best quality measures for SD, since different measures represent different types of interest. Some of the most commonly used quality measures in SD are presented in Chapter2.4.2.
• Search strategy - The number of features and values to be considered in a subgroup discov-ery algorithm has an exponential relation with the dimension of the search space. With this in mind, the search strategy is something important that should be taken into account. The different search strategies and the implemented algorithms are presented in Chapter2.4.3.
2.4.2 Quality Measures
Following are the most commonly used quality measures in Subgroup Discovery. These are classi-fied according to their main purpose such as complexity, generality, precision and interest. There are also the hybrid measures, which aim to achieve a tradeoff between distinct types of quality measures.
The notation used in this section follows the notation used in Formula2.1. In addition, nTotal
represents the total number of examples in the database and nVariablesthe total number of existing
variables.
Measures of Complexity
These measures are related to the simplicity and interpretability of the problem. These measures include [Herrera et al.,2011]:
• Number of rules - Number of rules induced from the problem.
• Number of variables - Number of possible variables in the antecedent of the rule.
Measures of Generality
The measures of generality are used to quantify the quality of individual rules according to the individual patterns of interest covered. Some quality measures for this purpose are:
• Coverage - This measure represents the percentage of examples covered by a rule [Lavraˇc et al.,2004b]. It can be defined as:
Coverage(R) =n(Con junction) nTotal
(2.4)
In this formulation, n(Conjunction) is the number of examples that verify the conditions determined by the antecedent of the rule and nTotal, as mentioned earlier, is the total number
of examples.
• Support - The support of a rule measures the frequency (percentage) of correctly classified examples covered by the rule (True Positives) [Lavraˇc et al.,2004b]. The true positives are the examples that verify the condition and that are correctly labeled by the classifier. This can be computed as:
Support(R) =n(TargetValue×Con junction) nTotal
(2.5)
In the above formula, n(TargetValue× Con junction) is the number of examples that satisfy
the condition and that belong to the value of the target variable. nTotalhas the same meaning
as in Eq.2.4.
Measures of Precision
These quality measures show the precision of the subgroups and are widely used in the extrac-tion of associaextrac-tion rules and classificaextrac-tion. They are related to the precision of the subgroups in terms of tradeoff between correctly and not correctly classified examples or examples that satisfy or not satisfy a rule, totally or partially. Within this group can be found:
• Confidence - It measures the relative frequency of examples that satisfy the complete rule among those satisfying only the antecedent [Herrera et al.,2011]:
Con f idence(R) =n(TargetValue×Con junction)
n(Con junction) (2.6)
The necessary definitions for the understanding of this equation are mentioned in Eq. 2.4
and Eq.2.5.
• Precision measure Qg - It measures the tradeoff of a subgroup between the number of ex-amples classified correctly and the unusualness of their distribution [Herrera et al.,2011]. This can be computed as:
Qg(R) = T P FP+ g =
n(TargetValue×Con junction)
n(TargetValue×Con junction) + g
TP is the number of true positives2.5, and FP is the number of false positives. The negative negatives are the ones that do not verify the antecedent of the rule and that were incor-rectly labeled. The variable g is used as a generalisation parameter. It is usually configured between 0.50 and 100.
Measures of Interest
Measures of interest are intended for selecting and ranking patterns according to their potential interest to the user. These measures aim to select and rank the patterns found [Herrera et al.,2011].
• Interest - It evaluates the interest of a rule taking into account its antecedent and consequent. It can be formulated as:
Interest(R) = ∑
nVariables
i=1 Gain(Ai)
nVariables. log2(|TargetValue|)
(2.8)
Gain(Ai)is the information gain relative to the number of values or ranges of the variable Ai
[Herrera et al.,2011]. The Information Gain function has its origin in Information Theory [Cover and Thomas,2012]. It is based on the notion of entropy, which characterises the impurity of an arbitrary set of examples [Raileanu and Stoffel,2004]. This measure is used to reduce a bias towards attribute values. The variable nVariablesrepresents the total number
of variables and |TargetVariable| is the cardinality of the target variable.
• Novelty - This measure detects the interestingness or unusualness of a rule. Since the in-terestingness of a group depends both on its unusualness and size, this measure combines both factors. In this way, the unusualness of a rule is obtained from the difference between the number of examples that satisfy the condition and that belong to the value of the target variable and the examples that satisfy the condition or that belong to the value of the target variable. It can be computed as:
Novelty(R) = n(TargetValue×Con junction) − (n(TargetValue) × n(Con junction)) (2.9)
The variable n(TargetValue) is the total number of examples of the target variable. The
remaining definitions are mentioned in Eq.2.4and Eq.2.5
• Significance - This measure indicates the significance of a finding, if measured by the like-lihood ratio of a rule [Lavraˇc et al.,2004b]. This measure can be formulated as:
Signi f icance(R) = 2×
nVariables
∑
k=1
n(TargetValue×Con junction)×log
n(TargetValueK×Con junction)
n(TargetValue) × p(Con junction)


![Table 2.6: Features of the pioneering algorithms for SD [Herrera et al., 2011].](https://thumb-eu.123doks.com/thumbv2/123dok_br/19178661.944301/45.892.146.828.178.433/table-features-pioneering-algorithms-sd-herrera-et-al.webp)
![Table 2.7: Features of algorithms of SD based on classification [Herrera et al., 2011].](https://thumb-eu.123doks.com/thumbv2/123dok_br/19178661.944301/47.892.150.814.176.453/table-features-algorithms-sd-based-classification-herrera-et.webp)
![Table 2.8: Features of algorithms of SD based on association [Herrera et al., 2011].](https://thumb-eu.123doks.com/thumbv2/123dok_br/19178661.944301/49.892.156.857.177.738/table-features-algorithms-sd-based-association-herrera-et.webp)
![Table 2.9: Features of algorithms of SD based on evolutionary algorithms [Herrera et al., 2011].](https://thumb-eu.123doks.com/thumbv2/123dok_br/19178661.944301/50.892.103.793.177.494/table-features-algorithms-sd-based-evolutionary-algorithms-herrera.webp)
![Figure 2.1: Illustrative example of the approach described [Lemmerich et al., 2016].](https://thumb-eu.123doks.com/thumbv2/123dok_br/19178661.944301/51.892.154.775.336.533/figure-illustrative-example-approach-described-lemmerich-et-al.webp)