Sofia Alexandra Pereira Messias
Licenciada em Ciências da Engenharia Química e Bioquímica
Electrochemical Reduction of Carbon
Dioxide dissolved in ionic liquids
Dissertação para obtenção do Grau de Mestre em Engenharia
Química e Bioquímica
Orientador: Manuel Nunes da Ponte, Professor
Catedrático, FCT/UNL
Co-orientador: Ana Reis Machado, PhD, Omnidea
Júri:
Presidente: Professora Doutora Maria Ascensão Carvalho Fernandes Miranda Reis
Arguente: Professor Doutor Carlos Manuel Barros Henriques Vogais: Professor Doutor Manuel Luís Magalhães Nunes da Ponte
Doutora Ana Staack Reis Machado
Sofia Alexandra Pereira Messias
Licenciada em Ciências da Engenharia Química e Bioquímica
Electrochemical Reduction of Carbon
Dioxide dissolved in ionic liquids
Dissertação para obtenção do Grau de Mestre em Engenharia
Química e Bioquímica
Orientador: Manuel Nunes da Ponte, Professor
Catedrático, FCT/UNL
Co-orientador: Ana Reis Machado, PhD, Omnidea
Copyright @ Sofia Alexandra Pereira Messias, FCT/UNL, UNL
A Faculdade de Ciências e Tecnologia e a Universidade Nova de Lisboa têm o direito, perpétuo
e sem limites geográficos, de arquivar e publicar esta dissertação através de exemplares
Agradecimentos
Em primeiro lugar, gostaria de agradecer ao Professor Doutor Manuel Nunes da Ponte e à Doutora Ana Reis Machado orientadores desta tese. Tenho a agradecer-lhes a excelente oportunidade que me deram de participar deste projeto, mostrando sempre muita disponibilidade, simpatia e incentivo ao longo destes meses. Além disso, tenho também a agradecer-lhes todos os conhecimentos que me foram transmitindo durante a realização da minha tese, que para mim foram muito enriquecedores.
Ao Professor Doutor Luís Branco por toda a simpatia e disponibilidade demonstrada.
Aos meus pais João e Alcina Messias pelo apoio incondicional, por todas as oportunidades e ensinamentos que me deram ao longo da minha vida, sem eles não seria possível alcançar esta etapa da minha vida.
Aos restantes elementos da minha família por todo o apoio e encorajamento.
A todos os meus amigos pela paciência e apoio demonstrados ao longo deste período da minha vida.
Abstract
The present work studies a method of electrochemical reduction of CO2 for the production
of methane and methanol. Thus, a high pressure facility was assembled and tested for this goal. Some cyclic voltammetry experiments were carried out in order to study the electrochemical window of the electrolyte (the ionic liquid [bmim][BF4] plus water). After the initial tests several
electrolysis were performed with various electrode materials (copper, nickel, brass and carbon), at different pressures, reaction times and applied potential to study the influence of these parameters in the electrochemical reduction of CO2. The principal product resulting from the
electrochemical reduction of CO2 was methane and hydrogen resulting from the electrolysis of
water.
Resumo
O presente trabalho estuda um método para a redução eletroquímica de CO2 para a
produção de metano e de metanol. Assim, uma instalação de alta pressão foi montada e testada para esse objetivo. Algumas experiências de voltametria cíclica foram realizadas de forma a estudar a janela eletroquímica do eletrólito (líquido iónico [bmim][BF4] mais água). Após
os ensaios iniciais várias eletrólises foram realizadas com vários materiais como elétrodo (cobre, níquel, latão e carbono), a diferentes pressões, tempos de reação e potencial aplicado para estudar a influência destes parâmetros na redução eletroquímica de CO2. O principal
produto resultante da redução eletroquímica de CO2 foi o metano e também se obteve
hidrogênio resultante da eletrólise da água.
Table of contents
1. Introduction... 1
1.1. Carbon dioxide ... 1
1.1.1. Carbon dioxide capture ... 1
1.1.2. Reduction of CO2 ... 3
1.2. Ionic liquids ... 4
1.3. Electrochemistry ... 5
1.3.1. Cyclic voltammetry ... 5
1.3.2. Electrolysis ... 7
1.4. State of the Art ... 8
2. Experimental Method ... 11
2.1. Reagents and Materials ... 11
2.2. Description of the high pressure facility ... 11
2.3. Calibration Procedure ... 12
2.4. Electrolysis Procedure ... 14
2.5. Electrochemical Characterization by Cyclic Voltammetry ... 15
2.6. Water control (Karl Fischer) ... 15
2.7. Analytical methods (GC and Headspace) ... 15
2.8. Spectroscopic methods (NMR) ... 16
3. Results and Discussion ... 17
3.1. Electro-reduction of CO2 ... 17
3.1.1. Copper electrode ... 17
3.1.2. Nickel electrode ... 22
3.1.3. Brass electrode ... 27
3.1.4. Carbon electrode ... 30
3.1.5. Electrodes coated with Nanoparticles of copper and nickel. ... 33
3.2. Electrodes comparison ... 36
4. Conclusion... 37
5. References ... 39
List of Figures
Figure 1.1 – Schematic diagram of possible CO2 capture and storage systems. Adapted [4] .... 2
Figure 1.2 – CO2 capture systems. Adapted [4] ... 3
Figure 1.3 – Selected major reaction products and intermediates for CO2 reductions with their associated free energies and standard potentials. Adapted [3] ... 3
Figure 1.4 – Molecular structure of 1-Butyl-imidazolium-tetrafluoroborate ... 4
Figure 1.5 – Overall view of the cyclic voltammetry experiment. [14] ... 5
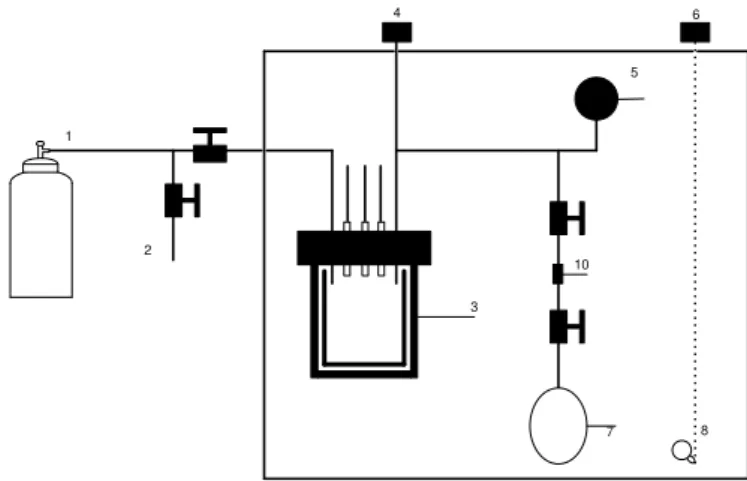
Figure 2.1 - High pressure facility; (1) CO2 inlet; (2) Reactor with electrochemical cell; (3) Digital Pressure Meter; (4) Digital Temperature Meter; (5) Infrared lamp; (6) Potentiostat; (7) Pressure Meter; (8) Expansion zone vessel; (9) cooling mixture; (10) Nut; (11) Smpling vessel; (12) Insulated box ... 11
Figure 2.2 – High pressure facility ... 12
Figure 2.3 - Calibration of High Pressure facility, reactor sector; (1) Argon inlet; (2) Argon output and vacuum line; (3) Reactor; (4) Digital Pressure Meter; (5) Precision Digital Pressure Meter; (6) Digital Temperature Meter; (7) Calibration vessel; (8) Infrared lamp; (9) Box; (10) Nut ... 12
Figure 2.4 – Calibration of High Pressure facility, reactor sector. ... 13
Figure 2.5 - Calibration of Expansion vessel; (1) Argon inlet, output and vacuum line; (2) Expansion vessel; (3) Pressure Meter; (4) Precision Digital Pressure Meter; (5) Nut; (6) Calibration balloon ... 13
Figure 2.6 - Calibration of Collecting vessel; (1) Argon inlet, output and vacuum line; (2) Collecting vessel; (3) Pressure Meter; (4) Precision Digital Pressure Meter; (5) Nut; (6) Calibration balloon ... 14
Figure 2.7 - Structure of the high-pressure electrochemical cell: (1) gas inlet; (2) gas out; (3) quasi-reference electrode; (4) cathode: working electrode; (5) anode: counter electrode; (6) Teflon packing; (7) glass beaker; (8) stirrer. Adapted [7] ... 14
Figure 2.8 – Headspace Gas Chromatography ... 16
Figure 3.1 – Cathodic Curve 1st cycle with scan rate of 20 mV/s ... 17
Figure 3.2 - Anodic Curve 1st cycle with scan rate of 20 mV/s ... 17
Figure 3.3 – Headspace gas chromatogram of blank sample (ionic liquid plus water) ... 19
Figure 3.4 – Headspace gas chromatogram of CO2 electrolysis carried out with an applied potential of -1.8V vs. Ag/Ag+, at a temperature of 45ºC, at a pressure of 60 bar and 1 hour reaction time (reaction 1) ... 19
Figure 3.5 - Headspace gas chromatogram of CO2 electrolysis carried out with an applied potential of -1.8V vs. Ag/Ag+, at a temperature of 45ºC, at a pressure of 66.5 bar and 30 minutes reaction time (reaction 2) ... 20
Figure 3.6 – Molecular structure of [bmim]+ ... 20
Figure 3.7 - Proton NMR spectrum of the ionic liquid [bmim][BF4]... 21
Figure 3.8 – Proton NMR spectrum of the electrolyte of the electrolysis carried out with an applied potential of -1.8V vs Ag/Ag+, at a temperature of 45ºC, at a pressure of 60 bar and 1 hour reaction time (reaction 1). ... 22
Figure 3.9 - Cathodic Curve 1st cycle with scan rate of 20 mV/s ... 22
Figure 3.10 - Anodic Curve 1st cycle with scan rate of 20 mV/s ... 23
Figure 3.11 - Headspace gas chromatogram of CO2 electrolysis carried out with an applied potential of -2.4V vs. Ag/Ag+, at a temperature of the 45ºC, at a pressure of 86 bar and 3 hours reaction time (reaction 7). ... 24
Figure 3.12 - Headspace gas chromatogram of CO2 electrolysis carried out with at an applied potential of -1.8V vs. Ag/Ag+, at a temperature of 45ºC, at a pressure of 85.5 bar and 1 hour reaction time (reaction 8). ... 25
Figure 3.14 - Proton NMR spectrum of the electrolyte of the electrolysis carried out with at an applied potential of -1.6V vs. Ag/Ag+, at a temperature of 45ºC, at a pressure of 85.3 bar and 1 hour reaction time (reaction 9) ... 26 Figure 3.15 - Cathodic Curve 1st cycle with scan rate of 20 mV/s ... 27 Figure 3.16 – Anodic Curve 1st cycle with scan rate of 20 mV/s ... 27 Figure 3.17 - Headspace gas chromatogram of CO2 electrolysis carried out with an applied
potential of -1.8V vs. Ag/Ag+, at a temperature of 45ºC, at a pressure of 62.9 bar and 30 minutes reaction time (reaction 12). ... 28 Figure 3.18 - Proton NMR spectrum of the electrolyte of the electrolysis carried out with an applied potential of -1.8V vs. Ag/Ag+, at a temperature of 45ºC, at a pressure of 62.9 bar and 30 minutes reaction time (reaction 12). ... 29 Figure 3.19 - Cathodic Curve 1st cycle with scan rate of 20 mV/s ... 30 Figure 3.20 – Anodic Curve 1st cycle with scan rate of 20 mV/s ... 30 Figure 3.21 - Proton NMR spectrum of the electrolyte of the electrolysis carried out with an applied potential of -1.8V vs. Ag/Ag+, at a temperature of 45ºC, at a pressure of 85.3 bar and 1 hour reaction time (reaction 14). ... 32 Figure 3.22 - Proton NMR spectrum of the electrolyte of the electrolysis carried out with an applied potential of -2.4V vs. Ag/Ag+, at a temperature of 45ºC, at a pressure of 62.5 bar and 1 hour reaction time (reaction 15). ... 33 Figure 3.23 – Headspace gas chromatogram of CO2 electrolysis carried out with an applied
potential at -1.8V vs. Ag/Ag+, at a temperature of 45ºC, at a pressure of 64.1 bar and 30 minutes reaction time (reaction 17). ... 34 Figure 3.24 – Headspace gas chromatogram of CO2 electrolysis carried out with an applied
potential at -1.8V vs. Ag/Ag+, at a temperature of 45ºC, at a pressure of 62.5 bar and 1 hour reaction time (reaction 18). ... 34 Figure 3.25 – Headspace gas chromatogram of CO2 electrolysis carried out with an applied
potential at -1.8V vs. Ag/Ag+, at a temperature of 45ºC, at a pressure of 66.3 bar and 1 hour reaction time (reaction 19). ... 35 Figure 6.2 – Calibration Certificate of hydrogen ... 41 Figure 6.3 – Calibration certificate for hydrocarbons ... 42 Figure 6.4 – Channel 1 of the Gas chromatogram of CO2 electrolysis carried out with an applied
potential at -1.8 V vs. Ag/Ag+, at a temperature of 45ºC, at a pressure of 60 bar and 1 hour reaction time (reaction 1) ... 43 Figure 6.5 – Channel 2 of the Gas chromatogram of CO2 electrolysis carried out with an applied
potential at -1.8 V vs. Ag/Ag+, at a temperature of 45ºC, at a pressure of 60 bar and 1 hour reaction time (reaction 1) ... 43 Figure 6.6 – Channel 1 of the Gas chromatogram of CO2 electrolysis carried out with an applied
potential at -1.8 V vs. Ag/Ag+, at a temperature of 45ºC, at a pressure of 66.5 bar and 30 minutes reaction time (reaction 2) ... 44 Figure 6.7 – Channel 2 of the Gas chromatogram of CO2 electrolysis carried out with an applied
potential at -1.8 V vs. Ag/Ag+, at a temperature of 45ºC, at a pressure of 66.5 bar and 30 minutes reaction time (reaction 2 ) ... 44 Figure 6.8 – Channel 1 of the Gas chromatogram of CO2 electrolysis carried out with an applied
potential at -1.8 V vs. Ag/Ag+, at a temperature of 45ºC, at a pressure of 64.5 bar and 13 minutes reaction time (reaction 3) ... 45 Figure 6.9 – Channel 2 of the Gas chromatogram of CO2 electrolysis carried out with an applied
potential at -1.8 V vs. Ag/Ag+, at a temperature of 45ºC, at a pressure of 64.5 bar and 13 minutes reaction time (reaction 3) ... 45 Figure 6.10 – Channel 1 of the Gas chromatogram of CO2 electrolysis carried out with an
Figure 6.11 – Channel 2 of the Gas chromatogram of CO2 electrolysis carried out with an
applied potential at -1.8 V vs. Ag/Ag+, at a temperature of 45ºC, at a pressure of 85 bar and 30 minutes reaction time (reaction 4). ... 46 Figure 6.12 – Channel 1 of the Gas chromatogram of CO2 electrolysis carried out with an
applied potential at -1.3 V vs. Ag/Ag+, at a temperature of 45ºC, at a pressure of 66.3 bar and 30 minutes reaction time (reaction 5). ... 47 Figure 6.13 - Channel 2 of the Gas chromatogram of CO2 electrolysis carried out with an
applied potential at -1.3 V vs. Ag/Ag+, at a temperature of 45ºC, at a pressure of 66.3 bar and 30 minutes reaction time (reaction 5). ... 47 Figure 6.14 – Channel 1 of the Gas chromatogram of CO2 electrolysis carried out with an
applied potential at -0.5 V vs. Ag/Ag+, at a temperature of 45ºC, at a pressure of 63.1 bar and 30 minutes reaction time (reaction 6) ... 48 Figure 6.15 – Channel 2 of the Gas chromatogram of CO2 electrolysis carried out with an
applied potential at -0.5 V vs. Ag/Ag+, at a temperature of 45ºC, at a pressure of 63.1 bar and 30 minutes reaction time (reaction 6) ... 48 Figure 6.16 – Channel 1 of the gas chromatogram of CO2 electrolysis carried out with an
applied potential at -2.4 V vs. Ag/Ag+, at a temperature of 45ºC, at a pressure of 86 bar and 3 hours reaction time (reaction 7)... 49 Figure 6.17 – Channel 2 of the gas chromatogram of CO2 electrolysis carried out with an
applied potential at -2.4 V vs. Ag/Ag+, at a temperature of 45ºC, at a pressure of 86 bar and 3 hours reaction time (reaction 7)... 49 Figure 6.18 – Channel 1 of the gas chromatogram of CO2 electrolysis carried out with an
applied potential at -1.8 V vs. Ag/Ag+, at a temperature of 45ºC, at a pressure of 85.5 bar and 1 hour reaction time (reaction 8). ... 50 Figure 6.19 – Channel 2 of the gas chromatogram of CO2 electrolysis carried out with an
applied potential at -1.8 V vs. Ag/Ag+, at a temperature of 45ºC, at a pressure of 85.5 bar and 1 hour reaction time (reaction 8). ... 50 Figure 6.20 – Channel 1 of the gas chromatogram of CO2 electrolysis carried out with an
applied potential at -1.6 V vs. Ag/Ag+, at a temperature of 45ºC, at a pressure of 85.3 bar and 1 hour reaction time (reaction 9). ... 51 Figure 6.21 – Channel 2 of the gas chromatogram of CO2 electrolysis carried out with an
applied potential at -1.6 V vs. Ag/Ag+, at a temperature of 45ºC, at a pressure of 85.3 bar and 1 hour reaction time (reaction 9). ... 51 Figure 6.22 – Channel 1 of the gas chromatogram of CO2 electrolysis carried out with an
applied potential at -1.8 V vs. Ag/Ag+, at a temperature of 45ºC, at a pressure of 61.1 bar and 1 hour reaction time (reaction 10). ... 52 Figure 6.23 – Channel 2 of the gas chromatogram of CO2 electrolysis carried out with an
applied potential at -1.8 V vs. Ag/Ag+, at a temperature of 45ºC, at a pressure of 61.1 bar and 1 hour reaction time (reaction 10). ... 52 Figure 6.24 – Channel 1 of the gas chromatogram of CO2 electrolysis carried out with an
applied potential at -2.4 V vs. Ag/Ag+, at a temperature of 45ºC, at a pressure of 63.3 bar and 2 hours reaction time (reaction 11)... 53 Figure 6.25 – Channel 2 of the gas chromatogram of CO2 electrolysis carried out with an
applied potential at -2.4 V vs. Ag/Ag+, at a temperature of 45ºC, at a pressure of 63.3 bar and 2 hours reaction time (reaction 11)... 53 Figure 6.26 – Channel 1 of the gas chromatogram of CO2 electrolysis carried out with an
applied potential at -1.8 V vs. Ag/Ag+, at a temperature of 45ºC, at a pressure of 62.9 bar and 30 minutes reaction time (reaction 12). ... 54 Figure 6.27 – Channel 2 of the gas chromatogram of CO2 electrolysis carried out with an
Figure 6.28 – Channel 1 of the gas chromatogram of CO2 electrolysis carried out with an
applied potential at -1.8 V vs. Ag/Ag+, at a temperature of 45ºC, at a pressure of 63.6 bar and 1 hour reaction time (reaction 13). ... 55 Figure 6.29 – Channel 2 of the gas chromatogram of CO2 electrolysis carried out with an
applied potential at -1.8 V vs. Ag/Ag+, at a temperature of 45ºC, pressure of 63.6 bar and 1 hour reaction time (reaction 13). ... 55 Figure 6.30 – Channel 1 of the gas chromatogram of CO2 electrolysis carried out with an
applied potential at -1.8 V vs. Ag/Ag+, at a temperature of 45ºC, at a pressure of 85.3 bar and 1 hour reaction time (reaction 14). ... 56 Figure 6.31 – Channel 2 of the gas chromatogram of CO2 electrolysis carried out with an
applied potential at -1.8 V vs. Ag/Ag+, at a temperature of 45ºC, at a pressure of 85.3 bar and 1 hour reaction time (reaction 14). ... 56 Figure 6.32 – Channel 1 of the gas chromatogram of CO2 electrolysis carried out with an
applied potential at -2.4 V vs. Ag/Ag+, at a temperature of 45ºC, at a pressure of 62.5 bar and 1 hour reaction time (reaction 15). ... 57 Figure 6.33 – Channel 2 of the gas chromatogram of CO2 electrolysis carried out with an
applied potential at -2.4 V vs. Ag/Ag+, at a temperature of 45ºC, at a pressure of 62.5 bar and 1 hour reaction time (reaction 15). ... 57 Figure 6.34 – Channel 1 of the gas chromatogram of CO2 electrolysis carried out with an
applied potential at -2.4 V vs. Ag/Ag+, at a temperature of 45ºC, at a pressure of 84.7 bar and 3 hours reaction time (reaction 16)... 58 Figure 6.35 – Channel 2 of the gas chromatogram of CO2 electrolysis carried out with an
applied potential at -2.4 V vs. Ag/Ag+, at a temperature of 45ºC, at a pressure of 84.7 bar and 3 hours reaction time (reaction 16)... 58 Figure 6.36 – Channel 1 of the gas chromatogram of CO2 electrolysis carried out with an
applied potential at -1.8 V vs. Ag/Ag+, at a temperature of 45ºC, at a pressure of 64.1 bar and 30 minutes reaction time (reaction 17). ... 59 Figure 6.37 – Channel 2 of the gas chromatogram of CO2 electrolysis carried out with an
applied potential at -1.8 V vs. Ag/Ag+, at a temperature of 45ºC, at a pressure of 64.1 bar and 30 minutes reaction time (reaction 17). ... 59 Figure 6.38 – Channel 1 of the gas chromatogram of CO2 electrolysis carried out with an
applied potential at -1.8 V vs. Ag/Ag+, at a temperature of 45ºC, at a pressure of 62.5 bar and 1 hour reaction time (reaction 18). ... 60 Figure 6.39 – Channel 2 of the gas chromatogram of CO2 electrolysis carried out with an
applied potential at -1.8 V vs. Ag/Ag+, at a temperature of 45ºC, at a pressure of 62.5 bar and 1 hour reaction time (reaction 18). ... 60 Figure 6.40 – Channel 1 of the gas chromatogram of CO2 electrolysis carried out with an
applied potential at -1.8 V vs. Ag/Ag+, at a temperature of 45ºC, at a pressure of 66.3 bar and 1 hour reaction time (reaction 19). ... 61 Figure 6.41 – Channel 2 of the gas chromatogram of CO2 electrolysis carried out with an
List of Tables
Table 3.1 – Reactions performed with copper electrode and GC results ... 18
Table 3.2 – Reactions conditions performed with nickel electrode and GC results ... 23
Table 3.3 – Reactions conditions performed with brass electrodes and GC results ... 28
Table 3.4 – Reactions conditions performed with carbon electrodes and GC results ... 31
List of Symbols and Abbreviations
ILs – Ionic Liquids[bmim][BF4] – 1-Butyl-imidazolium-tetrafluoroborate
WE – Working Electrode
CE – Counter Electrode
RE – Reference Electrode
GC – Gas Chromatography
HS-GC – HeadSpace-Gas Chromatography
1. Introduction
The growing concern with environmental problems, especially those related to carbon dioxide emissions has led to a growing demand for methods that reduce these emissions. Although it led to an increase of investment and development of low-carbon energy alternatives and renewable energies, predictions that the consumption of fossil fuels will grow significantly, due to increased global energy and electricity demand, caused by the emergence of new economic powers in the world. [1] One possible partial solution would be to chemically transform emitted carbon dioxide and recycle it as fuels or organic chemicals. [2]
The present work was carried out in the framework of a FP7 a research program that studies a method of electrochemical reduction of CO2 for the production of methane and
methanol. Thus, a high pressure facility was assembled and tested for this goal. Firstly some tests were performed to verify that the electrochemical cell was working properly, and some cyclic voltammetry experiments were also carried out in order to study the electrochemical window of the electrolyte. After the initial tests several electrolysis were performed, with various electrode materials, at different pressures, reaction times and applied potential, to study the influence of these parameters in the electrochemical reduction of CO2. The different materials
tested as working electrodes will be used as catalyst supports and/or catalyst supports. The information provided in this work will be used to develop further effective catalysts and cathodes for the electrochemical reduction of CO2.
1.1. Carbon dioxide
Carbon dioxide is a colorless and inodorous gas with a low toxicity. Its solid form sublimes at 195 K, at atmospheric pressure.
Since the Industrial Revolution, greenhouse gas emissions, mostly CO2, have been thrown
into the atmosphere, due to the burning of fossil fuels. The increase of CO2 in the atmosphere,
which is claimed to be one the major contributors to the greenhouse effect, is expected to increase the temperature at the troposphere, the precipitation, and the sea level. Reducing these emissions has been recognized as essential in oreder to avoid potentially catastrophic climate changes [3].
1.1.1. Carbon dioxide capture
Figure 1.1– Schematic diagram of possible CO2 capture and storage systems. Adapted [4]
The main purpose of CO2 capture is to produce a concentrated stream of CO2 at high
pressure that can readily be transported to a storage place. There are four basic systems for capturing CO2 from the use of fossil fuels and/or biomass:
Capture from industrial process streams: examples of the CO
2capture from process
streams are the purification of natural gas and the production of hydrogen-containing
synthesis gas for the manufacture of ammonia, alcohols and synthetic liquid fuels.
Most of the techniques are similar with those used in pre-combustion capture. [4]
Pre-combustion capture: involves reacting to a fuel with oxygen or air and/or steam to
give mainly a “synthesis gas” or “fuel gas” composed of carbon monoxide and
hydrogen. The carbon monoxide is reacted with steam in a catalytic reactor, called a
shift converter, to give CO
2and more hydrogen. CO
2is then separated, usually by a
physical or chemical absorption process, resulting in a hydrogen-rich fuel which can be
used in many applications. [4]
Post-combustion capture: capture of CO
2from flue gases produced by combustion of
fossil fuels and biomass in air. Instead of being discharged directly to the atmosphere,
flue gas is passed through equipment which separates most of the CO
2. The CO
2is fed
to a storage reservoir and the remaining flue gas is discharged to the atmosphere. [4]
During the past years, absorptive post-combustion capture has become an emergent
technique for greenhouse gas sequestration. The main reasons for the employment of
absorptive post-combustion capture are the large scale availability, the very little
impact on combustion/production process and CO
2stream with high purity. The
disadvantage of this concept is its high energy consumption. [5]
Oxy-fuel combustion capture: nearly pure oxygen is used for combustion instead of air,
resulting in a flue gas that is mainly CO
2and H
2O. If fuel is burnt in pure oxygen, the
flame temperature is excessively high, but CO
2and/or H
2O-rich flue gas can be
Figure 1.2 shows these systems in a simplified form.
Figure 1.2 – CO2 capture systems. Adapted [4]
1.1.2. Reduction of CO2
The conversion and use of CO2 is an important subject in modern chemistry, because CO2
is an abundant, economical, non-toxic and recyclable carbon source [6]. Many methods can be used to convert CO2 gas into fuels, for example photosynthesis, photocatalysis and
electro-reduction [3]. Electro-reduction of CO2 is believed to be one the most appropriate methods to
convert CO2 into organic compounds [7]. Electrochemical reduction of CO2 gas may produce
gases, such as methane, ethylene gases, as well as small organic molecules, such as formic acid and alcohols, [8] [3] as shown in Figure 1.3.
Figure 1.3 – Selected major reaction products and intermediates for CO2 reductions with their associated free
Some of the reactions reported in the literature [8] [9] for the electrochemical reduction of CO2 can be expressed as follows:
(1)
(2)
(3)
(4)
(5)
The reactions correspond, respectively, to the formation of (1) ethylene, (2) methane, (3) carbon monoxide, (4) formic acid and (5) methanol.
1.2. Ionic liquids
Ionic liquids (ILs) are composed entirely of ions and exist in the liquid state below 100 ºC. As a class, ILs typically contains a bulky organic cation that is weakly coordinated to an organic or inorganic anion [10].
Figure 1.4 – Molecular structure of 1-Butyl-imidazolium-tetrafluoroborate
An increasing attention has been paid to the molten salts with melting points close to room temperature because they have many attractive properties: non-volatility, non-flammability, low vapor pressure, high conductivity. They are excellent solvents for both organic and inorganic substances and they are able to act as catalysts and wide electrochemical potential windows [7] [6] [11] [10]. The unique properties of ILs make them more environmentally attractive solvents; the ILs can replace the conventional toxic and volatile solvents [7] [6].
This work is related to the use of ILs as a solvent for electrochemistry. High conductivity and wide electrochemical windows make ILs very useful electrolytes with wide potential applications. ILs have been used in many electrochemical applications, as electrolytes in batteries, photo electrochemical cells, fuel cells and solvents in electrochemical experiments [7] [12] [10]. Another important aspect is the solubility of the CO2 in ILs, previous studies found that the anion
predominantly determines the solubility of CO2 in ILs. ILs with fluorous anions, for example,
bis(trifluoromethylsulfonyl)amide ([Tf2N
-]), tetrafluoroborate ([BF4
-]), and hexafluorophosphate ([PF6
-]) show the highest CO2 solubility. The solubility of CO2 in an ILs is less strongly influenced
by the type of the cation. However, the CO2 solubility in ILs having fluorinated cations is higher
1.3. Electrochemistry
Electroanalytical techniques are related to the interaction between electricity and chemistry, i.e. in the relationship of chemical parameters with the electrical quantities as the potential, current or charge. Electroanalytical techniques have been used in many applications, such as environmental monitoring, industrial quality control, among others [14]
There are two main types of electroanalytical measurements: potentiometric and potentiostatic. In both cases the electrochemical cell should be composed of at least two electrodes (conductors) and a contact solution (electrolyte). These cells can be classified according to the consumption or production of energy, that is, when they consume electricity from an external source, they are classified as electrolytic: if they are used for the production of electrical energy, they are classified as galvanic. [14]
1.3.1. Cyclic voltammetry
In order to obtain qualitative and quantitative information on electrochemical reactions, cyclic voltammetry is generally the most used technique, as it provides quick and effective, information about the thermodynamics of redox processes, kinetics of electron transfer reactions in the electrode-solution interface, as well as the kinetics and mechanisms of chemical reactions initiated by heterogeneous electronic transfer. [14] [15]
Cyclic voltammetry is an electrochemical technique where it is possible to control the applied potential. By making a cyclical scanning of the potential, you can see what is the current produced, through the registration of current versus potential curves. These curves are made through a potentiostat system that will define the parameters of control. The aim is to impose a cyclic linear potential sweep on the working electrode and to output the resulting current-potential curve. This sweep is described in general by its initial (Ei), switching (Es), final (Ef)
potentials, and sweep (or scan) rate (ν, in V/s). You can perform multiple cycles, but in most cases these will not be more informative than the single cycle. [14]
The electrochemical cell is usually made up of three electrodes, as shown in figure 1.5, the working electrode (WE), where the electrochemical reaction of interest occurs, an auxiliary electrode (AE) or “counter electrode” (CE) and a reference electrode (RE) and a solution (electrolyte) where the electrodes are immersed. The electrochemical reaction takes place because of the passage of an electrical current, also called faradic current, which is due to the electron transfer in WE. The potentiostat will operate the CE to balance the faradic process, with an electron transfer in the opposite direction, i.e., if the reduction takes place in WE the oxidation takes place at CE. Usually the processes that take place in CE are not of great interest and in most experiments the small currents observed mean that the electrolytic products formed in the CE do not influence the processes performed in WE. The faradic current in the WE is expressed by the output potential with a selected sensitivity, and is demonstrated in ampere per volt. [14]
There are still important aspects to be taken into account. At the beginning of the experiment, the cell contains solvent (electrolyte), one or more principal electroactive species, and possibly additional reagents that will be submitted to reactions with electrolytic products. Before starting the experiment it is necessary to remove the dissolved oxygen, which has a cathodic signal that can interfere with the observed current response. [14]
One of the aspects of great importance is the choice of solvent, where several factors must be taken into account, such as the conductance, the solubility of electrolyte and electroactive substance, and the reactivity with electrolytic products. [14] In recent years, ionic liquids have been studied as green solvents (electrolytes) in electrochemistry. Schröder and coworkers studied electrochemical properties of room temperature ionic liquids, BMMIMBF4, BMMIMPF6 and MDIMBF4 as solvents, using micro-samples, with a volume of 10 μl of ionic liquid under vacuum conditions and under conditions with controlled gas and moisture supplies. They studied the impact of water absorbed by the Ionic liquid in a controlled manner from the gas phase on the voltammetry of redox systems and ionic liquids potential window. The diffusion coefficients for three representative redox system, the oxidation of neutral N,N,N’,N’ -tetramethyl-p-phenylenediamine (TMPD), the reduction of cationic methyl viologen (MV2+) and reduction of anionic hexacyanoferrate(III), Fe(CN)6
3-, were determined as a function of the water content of the ionic liquids. They have shown that traces of water can have a dramatic effect on the electrochemical characteristics and the rate of diffusion observed voltammetrically in ionic liquid media. In particular, the contrast in the effect of water on the diffusion coefficient for neutral and for ionic species suggests that wet ionic liquids may not be regarded as homogeneous solvents, but have to be considered as nano-structured with polar and non-polar regions. [16]
have been found to be similar to those reported in conventional solvents. The voltammetry is characterized by extremely slow rates of diffusion, and a decrease in the rate of heterogeneous electron transfer kinetics has been reported. The presence of a solute also may alter the double layer and hence background current more frequently than occurs in molecular solvents with added electrolyte. As a result of these findings, it may be appropriate to assume that RTILs do not behave in a fully analogous manner to traditional molecular solvents with bulk added supporting electrolyte but that they should be treated as a separate class of solvent. [17]
1.3.2. Electrolysis
Electrolysis is the process in which electrical energy is used to force the occurrence of a chemical reaction that is not spontaneous. [18]
The physical-chemist Michael Faraday (1791-1867) studied quantitative aspects of electrolysis conducting various experiments. Through these experiments, he concluded that the mass of product formed (or the consumed reagent) in an electrode is proportional to the quantity of electricity transferred at the electrode and the molar mass of the substance, i.e. the higher the intensity of the electrical current in electrolysis, the bigger the mass of the formed product. [18] The electric charge is defined by the following expression:
Where i is the intensity of the electric current (the SI unit is the ampere (A), defined as coulomb per second (C/s)) and Δt is the time interval.
In 1909, the American physicist Robert Andrews Millikan (1868-1953) determined the amount of charge carried by a mole of electrons, called Faraday constant, which has a value of 96500 C (1F). [18] Therefore, by knowing the amount of charge provided in electrolysis, it is possible to predict the amount of substance that is produced in this process. It is possible to set the 1st and 2nd Faraday's law.
1st Faraday’s law– the mass that forms in an electrode is directly proportional to the amount of charge flowing through the circuit. This law is expressed by the following equation: [19]
Where m is the mass of the substance produced, k1 is the constant of proportionality and Q
the electrical charge in C.
2nd Faraday’s law - The mass of different substances liberated by the same quantity of electric charge is proportional to their chemical equivalents. This law is expressed by the following equation: [19]
Where m is the mass of substance produced and E is the chemical equivalent that is the mass that an element loses or gains in mole of electrons.
Faradaic efficiency is calculated using the theoretical charge of the substance i (QT (i)), and
the total charge passed (ƩQp), through the following expression. [7]
1.4. State of the Art
In recent years, several researchers have been studying the electrochemical reduction of CO2, initially using aqueous solutions and later using organic solvents. Hori et al. studied the electroreduction of CO2 at Cu in aqueous inorganic electrolytes and verified that the CO is formed as an intermediate from the CO2, being adsorbed on the copper electrode where is then reduced to hydrocarbons and alcohols. [21] Hara et al. studied the electrochemical reduction of carbon dioxide under high pressure on various electrodes in an aqueous electrolyte. They found that the main products on Ag, Au, Zn, Pb and In electrodes were formic acid and/or CO, as at CO2 pressure of 1 atm. On group 8 -10 metals, such as Fe, Co, Rh, Ni, Pd and Pt, the main
reduction products were formic acid and/or Co under high pressure. [22]
Saeki and coworkers studied the electrochemical reduction of CO2 with high current density
in a CO2+methanol medium, at various metal electrodes; they verify that the most electrodes
gave the same main product in this system an in aqueous system. At W, Ti an Pt electrodes, CO2 reduction was inefficient. Sn and Pb electrodes were active in formate production.
However, CO was formed much more efficiently in this system than in the aqueous system. Hydrocarbon formation at Cu electrode was less efficient when compared with aqueous system, but in the Ni electrode hydrocarbon was formed efficiently. [23]
Kaneco et al. investigated the electrochemical reduction of high pressure CO2 at a Cu
electrode in cold methanol and found that the main products formed were methane, ethylene, carbon monoxide and formic acid. In the electrolysis of high pressure CO2 at low temperature,
the reduction products were formed in the order of carbon monoxide, methane, formic acid and ethylene. [24]
Due to the excellent proprieties of ionic liquids as electrolytes and as solvents for CO2 in
recent years, the first studies using ionic liquids for electrochemical reduction of CO2 have
appeared. Zhao and coworkers investigated the electrochemical reduction of CO2 in ionic liquid;
they use 1-N-butyl-3-methylimidazolium hexafluorophsphate as a solvent and electrolyte, supercritical CO2, and water were successfully electrolyzed, and the products were CO, H2 and
small amount of formic acid. [7]
Feng et al. studied a Nanoporous copper incorporated platinum composites for electrocatalytic reduction of CO2 in ionic liquid [bmim][BF4]. The electrochemical behavior of this
electrode for electrocatalytic reduction CO2 in ionic liquid, had been studied by cyclic voltammogram and electrochemical impedance spectroscopy with a reduction peak at −2.24 V (vs. Ag) which was more positive 180 mV than that obtained on a pure platinum electrode. The electrolyses experiments were carried out in an undivided cell under mild conditions without any toxic solvents, catalysts and supporting electrolytes, affording the dimethyl carbonate in a good yield (81%). [6]
Further studies have been made in different ionic liquids such as Laura Barrosse-Antle and Richard Compton who studied the CO2 reduction in 1-butyl-3-methylimidazolium acetate. Where
CO2 was reduced via a chemically irreversible, one electron transfer to the radical anion CO2 ●
Another study was carried out by Snuffin et al. investigated the catalytic electrochemical reduction of CO2 in ionic liquid EMIMBF3Cl. A novel ionic liquid EMIMBF3Cl that contains a
BF3Cl
anion has been synthesized. This is the first report of an ionic liquid with a BF3Cl- anion. It was found that CO2 gas can be dissolved and electrochemically reduced at ambient pressure,
and room temperature in the ionic liquid EMIMBF3Cl. The reduction of CO2 occurred at a
relatively less negative electrode potential of -1.8 V versus silver wire, compared to previous reported values that are between -2.4 and -2.0 V. The reduction current density can be as high as an approximately 5.7 mA/cm2. The BF3Cl
anion may catalyze the CO2 reduction by forming
a Lewis acid-base adduct BF3
2. Experimental Method
2.1. Reagents and Materials
Carbon dioxide and Argon were supplied by Air Liquid with a stated purity of 99.98%.
The copper foil and nickel foil working electrodes used were supplied by Alfa Aesar. The materials has the following characteristics, copper foil: 0.5 mm (0.02 in) thick, puratronic 99.998% (metals basis), oxygen free around 11.2g/50x50mm; nickel foil: 1.0mm (0.04 in) thick, 99.5% (metals basis), oxygen free around 22.3g/50x50mm. Copper foam was purchased from Metafoam technologies ref. Cu std MP-004. Its porosity was 89.2% and the pore size was 550 µm. A commercial alloy 67% copper, 33% zinc microstructured in the form of a foil 1mm of thickness was also used as working electrode. A carbon cloth type B1 was purchased from Clean Fuel Cell Energy Lt. and tested as working electrode. A commercial zinc foil 0.05mm of thickness was used as sacrificial electrode. A silver rod with a purity > 99% was used as quasi-reference electrode.
The ionic liquid [bmim][BF4] it was synthesized by the Solchemar.
2.2. Description of the high pressure facility
The high pressure facility used, as shown in figure 2.1, can be divided in three sectors: The reaction sector, the expansion sector and the sampling sector. This pressure facility is operated in batch mode. The reaction sector consists in one 150 cm3 stainless steel reactor placed inside one insulated box (thermostatic air bath), where the heating is provided by an infrared lamp and the temperature is controlled by a temperature controller (Fluke 2100, Hart scientific). The reactor is equipped with a pressure controlled (Omron K3JT by OMRON corporation) and ¼ tubing for gas inlet and discharge of the gaseous reaction mixture into the expansion zone. Electric connections of the electrodes go through one 10 mm stainless tube with a conax pressure fitting. Outside the reactor the electric wires are connected to a potenciostat. Inside the stainless steel reactor there is a glass beaker. The electrolyte is placed in this beaker together with a magnetic stirring bar and the electrodes are immersed in the electrolyte. The expansion and sampling sectors lie outside the air bath. The stainless steel expansion vessel has a volume of 150 cm3 and the stainless steel sampling vessel has a volume of 50 cm3.
2 5 4 1 3 12 6 8 9 7 10 7 11
Figure 2.1 - High pressure facility; (1) CO2 inlet; (2) Reactor with electrochemical cell; (3) Digital Pressure Meter;
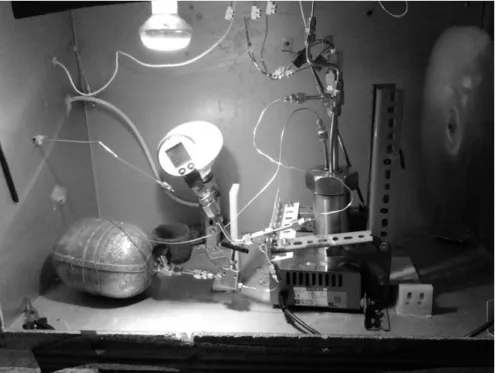
Figure 2.2 – High pressure facility
2.3. Calibration Procedure
The calibration is very important because we need to know the volume occupied by the gas in different areas to be able to quantify the process. The calibration was performed using the following procedure
First of all, a calibrated vessel was assembled as shown in figure 2.3, 2.5 and 2.6. The calibrated vessel valves are opened and the temperature is let to stabilize. Argon is introduced with a pressure less than 2.5 bar. When the pressure was stable it was measured using a precision Keller manometer and all valves are closed. Then the area to be calibrated is evacuated. Next, the vaccum pump is turned off and the pressure is measured. Finally the valves of the calibration vessel are opened and the pressure is measured when it stabilizes. The calibrated volume of the facility is calculated through the ratio pressure values.
1
10 5
7 3
2
4
8 6
Figure 2.3 - Calibration of High Pressure facility, reactor sector; (1) Argon inlet; (2) Argon output and vacuum line; (3) Reactor; (4) Digital Pressure Meter; (5) Precision Digital Pressure Meter; (6) Digital Temperature Meter;
Figure 2.4 – Calibration of High Pressure facility, reactor sector.
1
3
5 4
2
6
3
5 1
4
2
6
Figure 2.6 - Calibration of Collecting vessel; (1) Argon inlet, output and vacuum line; (2) Collecting vessel; (3) Pressure Meter; (4) Precision Digital Pressure Meter; (5) Nut; (6) Calibration balloon
2.4. Electrolysis Procedure
The Electrolysis was carried out according to the following procedure:
First of all, the electrochemical cell was assembled, Figure 2.7 shows a schematic representation of the electrochemical cell. The cell was sealed and, at the same time, the three electrodes were immersed into IL. After the reactor was connected to the facility, CO2 was
charged into the cell up to 30 bar, and then the reactor was purged at least three times, to remove the oxygen in the system. When the temperature of the air bath and the pressure of the cell stabilizes at the desired values for the experiment the power source is turned on and the electrolysis is carried out with the programme “CONTROL” as a function of square wave, where the working pulses duration is 900 seconds and the cleaning pulses 10 seconds. The power source was built by Omnidea Lda.
Figure 2.7 - Structure of the high-pressure electrochemical cell: (1) gas inlet; (2) gas out; (3) quasi-reference electrode; (4) cathode: working electrode; (5) anode: counter electrode; (6) Teflon packing; (7) glass beaker; (8)
stirrer. Adapted [7]
After running the program, it is necessary to make vacuum in the expansion zone. The valve at the entrance of this zone is opened, keeping the reactor outlet valve closed. When the pressure is the same in reactor and in the expansion zone, sampling collecting vessel is connected to the expansion zone vessel and the sampling zone is evacuated. The expansion vessel is placed in a cooling mixture of water, salt and N2 liquid, and the pressure goes down
and stabilizes. After the pressure stabilizes the valve which connects the sampling vessel and the expansion zone vessel is connected, until the pressure in the manometer is 2 bar. Finally the sampling vessel is disconnected and is ready for GC analysis.
1 3 4 5 2
7
2.5. Electrochemical Characterization by Cyclic Voltammetry
The Cyclic Voltammetry was made according to the following procedure:
First of all, the electrochemical cell was assembled, Figure 2.7 shows a schematic representation of the electrochemical cell. The cell was sealed and, at the same time, the three electrodes were immersed into IL. After the reactor was connected to the facility CO2 was
charged into the cell up to 30 bar, and then the reactor was purged at least three times remove the oxygen in the system. When the temperature of the air bath and the pressure of the cell stabilizes at the desired values for the experiment the power source is turned on and the cyclic voltammetry is carried out with the programme “NOVA” with a scan rate of 20 mV/s. The power source was AUTOLAB 84469.
2.6. Water control (Karl Fischer)
Karl Fischer titration is a classic method in analytical chemistry, which uses coulometric or volumetric titration to determine quantities of water in a sample. In this work, this technique was used to check the amount of water present in ionic liquid [bmim][BF4] (electrolyte) before and
after the reaction. In all electrolysis experiments the same quantity of water was added. The water content of the electrolyte samples analyzed before the reactions was in the range of 16-19%.
2.7. Analytical methods (GC and Headspace)
Gas products were collected in a collection vessel and analyzed by gas chromatography. An Agilent Micro GC 3000 was used equipped with a backflush 1 µl injector. The separation of the compounds present in the gas current was done in two columns. One of the columns was a MolSieve 5A 10 m x 0.32 mm with Plot U 3 m x 0.32 mm pre-column, with argon as carrier gas (Channel 1). The other column is a Plot U 8 m x 0.32 mm column with a Plot Q 1 m x 0.32 mm pre-column with helium as carrier gas (Channel 2). After separation on the column the sample gas flows through a thermal conductivity detector (TCD). On channel 1 is possible to observe the peaks relating to inorganic compounds and methane, on channel 2 it is possible to observe the peaks to heavier compounds and CO2.
The micro GC instrument conditions is: Injector temperature at 90ºC for both Channels; Column temperature at 100ºC and 60ºC for channel 1 and 2 respectively; Sampling time is 10s for both channels; Injection time for channel 1 and 2 is 200ms; Run time is 180s to the channel 1 and 2; Column pressure 30psi and Pressure equilibration time is 10s for both channels; For channel 1 the Post-run pressure is 40psi and for channel 2 is 32psi; Detectos sensitivity is standard to channel 1 and High to channel 2; Detector data rate is 50Hz, Baseline off set is 0mV and Backflush time is 9.5s for the two Channels.
The qualitative identification of the products in the ionic liquid [bmim]BF4 was carried out by
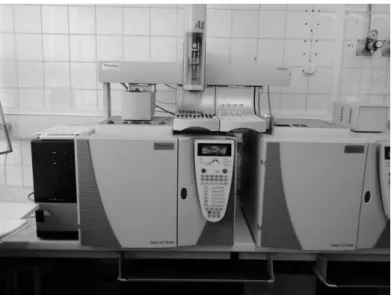
Figure 2.8 – Headspace Gas Chromatography
2.8. Spectroscopic methods (NMR)
3. Results and Discussion
3.1. Electro-reduction of CO2
In this chapter the influence of working electrode composition, CO2 pressure voltage applied
and electrolysis time in the electrochemical reduction of CO2 using the ionic liquid [bmim][BF4]
with 16-19% water as electrolyte and zinc as an sacrificial anode will be studied.
The calculated values for concentrations of methane and hydrogen presented must be considered with care, as the calculation were based in a single concentration (one point calibration). Thus, for concentrations that are considerably different from the calibration concentration, the estimated concentration may be a very rough estimation involving a significant error (10%).
3.1.1. Copper electrode
3.1.1.1. Voltammetry
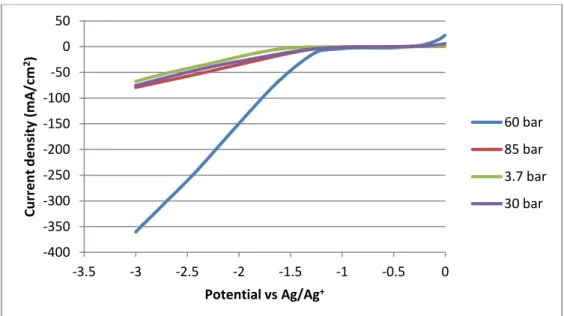
Figure 3.1 – Cathodic Curve 1st cycle with scan rate of 20 mV/s
-400 -350 -300 -250 -200 -150 -100 -50 0 50
-3.5 -3 -2.5 -2 -1.5 -1 -0.5 0
Cu rr e n t d e n si ty (m A /c m 2)
Potential vs Ag/Ag+
60 bar 85 bar 3.7 bar 30 bar -400 -350 -300 -250 -200 -150 -100 -50 0 50
-3.5 -3 -2.5 -2 -1.5 -1 -0.5 0
Cu rr e n t d e n si ty (m A /c m 2)
Potential vs Ag/Ag+
60 bar
85 bar
3.7 bar
Figure 3.1 shows the cathodic curve at the Cu electrode in ionic liquid [bmim][BF4] with
16-19% water as electrolyte, it was measured at 318 K and at different pressures. Argon was used as reference at a pressure of 3.7 bar, CO2 was used for the other pressures. Comparing the
voltammetric curves at different pressures with the reference pressure, it is observed that the highest currents are obtained for the electrolysis carried out at 60 bar. This may be explained by equilibrium between CO2 inflow to the electrode and less sites available for hydrogen adsorption. The current starts to increase at a potential of -1.3 V vs Ag/Ag+ quasi-reference electrode. For the other pressures, currents of the same order of magnitude as for argon were obtained.
Figure 3.2 shows the anodic curve of the same electrode in the same conditions, and it is possible to observe an oxidation wave at 60 bar pressure. No oxidation waves are observed at the other pressures.
3.1.1.2. Analysis of the gas phase
Electrolysis experiments were carried out as described in the experimental section 2.6. Electrolysis were performed potentiostatically and under stirring in the conditions presented in table 3.1.The analysis of the gas phase was done by GC as described in the experimental section. The chromatograms are presented in Annex 3.
Table 3.1 –Reactions performed with copper electrode and GC results
Reaction WE CE Applied Potential
(V) vs. Ag/Ag+ Conditions Detection
Concentration (ppm)
1 Cu
(2 cm2) Zn -1.8
Pressure: 60 bar Temperature: 45ºC
Time: 1 hour
CH4 H2
CH4: 889 H2: 2655
2 Cu
(1.7 cm2) Zn -1.8
Pressure: 66.5 bar Temperature: 45ºC Time: 30 minutes
CH4 H2
CH4: 996 H2: 2673
3 Cu foam
(1.2 cm2) Zn -1.8
Pressure: 64.5 bar Temperature: 45ºC Time: 13 minutes
CH4 H2
CH4: 4832 H2: 19601
4 (2.1 cmCu 2) Zn -1.8
Pressure: 85 bar Temperature: 45ºC
Time: 30 minutes
CH4 H2
CH4: 1624 H2: 2321
5 Cu
(1.8 cm2) Zn -1.3
Pressure: 66.3 bar Temperature: 45ºC Time: 30 minutes
CH4 H2
CH4: Traces H2: 1588
6 Cu
( cm2) Zn -0.5
Pressure: 63.1 bar Temperature: 45ºC Time: 30 minutes
H2 H2: 387
According to the data presented in table 3.1, methane starts to be produced significantly at voltages higher than -1.3 V vs Ag/Ag+ at 60 bar pressure. At the same pressure at -0.5 V vs Ag/Ag+ no CO2 reduction products were detected. Comparing for example the methane
concentrations obtained in reaction 2 and 4 it can be verified that an increase in pressure increases significantly the concentration of methane in the reaction mixture and consequently the yields of methane. The best result for methane conversion in the conditions studied was obtained when a Cu foam was used, even with the shortest experiment time. This type of structure has a larger surface area (much higher than the electrode nominal area).
3.1.1.3. Analysis of the liquid phase
plus water). The observed increase in the base line in the chromatograms is due to the water present in the ionic liquid. This is a serious drawback of this analysis method because compounds with boiling points close to the boiling point of water (such as formic acid) cannot be detected as they co-elute with the water present in the sample.
In the chromatogram of the electrolyte after reaction 1 with Cu (2 cm2), shown in figure 3.4, it is possible to observe a peak at 6.09 minutes, in the case of the reaction 2 with Cu (1.7 cm2), shown in figure 3.5, no peaks other than the peaks of the blanks are observed.
Figure 3.3 – Headspace gas chromatogram of blank sample (ionic liquid plus water)
Figure 3.4 – Headspace gas chromatogram of CO2 electrolysis carried out with an applied potential
Figure 3.5 - Headspace gas chromatogram of CO2 electrolysis carried out with an applied potential
of -1.8V vs. Ag/Ag+, at a temperature of 45ºC, at a pressure of 66.5 bar and 30 minutes reaction time (reaction 2)
The results do not allow us to conclude which compounds are present in the sample, 1HNMR spectroscopy of some samples was performed. As the solvent used in the reactions was the IL [bmim] [BF4], it is important to first identify the peaks corresponding to the protons of the IL. In order to facilitate the analysis was assigned a number to each proton.
Figure 3.6 – Molecular structure of [bmim]+
The 1HNMR spectrum of the ionic liquid [bmim][BF4] exhibts a triplet at 0.9, which
Figure 3.7 - Proton NMR spectrum of the ionic liquid [bmim][BF4]
The solvent used to perform the NMR was deuterated chloroform, the peak corresponding to the proton of this solvent is a singlet at 7.26 ppm. The sample contains water and has a peak at 1.5ppm, which is a singlet assigned to the water protons. The peak that appears in all of the samples at 2.2 ppm was assigned to the acetone used in the washings of the NMR tubes.
From the NMR spectrum of figure 3.8, it was possible to identify the peaks corresponding to the Ionic Liquid, solvent used CDCl3, water and acetone used in the washing of the NMR tubes,
but besides these peaks more peaks are observed in figure 3.8. These peaks are:
δ = 2.9 (s); δ = 3.8 (s); δ = 4.75 (s); δ = 8.7 (s).
The peaks that appear in the range of 2-3 ppm, might be assigned to acids formed during the reduction of CO2, such as formic acid. The peak at 3.8 ppm may be assigned to methanol.
Fulmer at al., assigned the signal at 3.42 ppm to methanol when CDCl3 is used as a solvent.
Figure 3.8 – Proton NMR spectrum of the electrolyte of the electrolysis carried out with an applied potential of -1.8V vs Ag/Ag+, at a temperature of 45ºC, at a pressure of 60 bar and 1 hour reaction
time (reaction 1).
3.1.2. Nickel electrode
3.1.2.1. Voltammetry
Figure 3.9 - Cathodic Curve 1st cycle with scan rate of 20 mV/s
-100 -90 -80 -70 -60 -50 -40 -30 -20 -10 0 10
-3.5 -3 -2.5 -2 -1.5 -1 -0.5 0
Cu rr e n t d e n si ty (m A /c m 2)
Potential vs Ag/Ag+
30 bar
60 bar
7.6 bar
Figure 3.10 - Anodic Curve 1st
cycle with scan rate of 20 mV/s
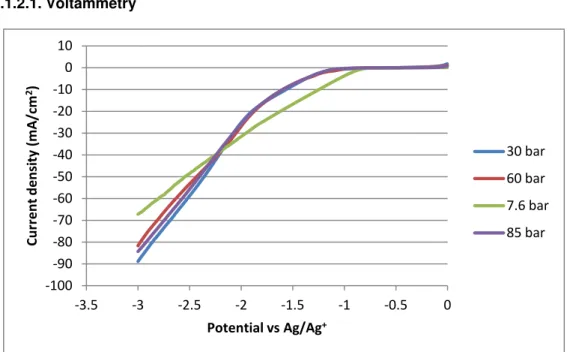
Figure 3.9 shows the cathodic curve at the Ni electrode in ionic liquid [bmim][BF4] with
16-19% water as electrolyte, it was measured at 318 K and at different pressures. Argon was used as reference with a pressure 7.6 bar, CO2 was used for the other pressures. In this the currents
on Ni are practically the same for the three pressures studied, the onset potential was around -1.2 V vs. Ag/Ag+ for the 30 bar, 60 bar and 85 bar pressures, but it is possible to observe a decrease in current between the potential -1V and -2.4V vs. Ag/Ag+ when compared with the reaction carried out in argon. For applied potentials more negative than -2.4 V vs. Ag/Ag+ the currents for the reactions in CO2 are higher than in argon.
Figure 3.10 shows the anodic curve of the same electrode in the same conditions, and the curves of the three pressures are very similar, as all have the oxidation wave for an applied potential of -1V vs. Ag/Ag+.
3.1.2.2. Analysis of the gas phase
Electrolysis experiments were carried out using [bmim][BF4] with 16-19% water as
electrolyte as described in the experimental section 2.6. Electrolysis were performed potentiostatically and under stirring in the conditions described in Table 3.2. The analysis of the gas phase was done by GC. The chromatograms are presented in Annex 4.
Table 3.2 – Reactions conditions performed with nickel electrode and GC results
Reaction WE CE Applied Potential (V) vs. Ag/Ag+ Conditions Detection Concentration (ppm)
7 (2.1 cmNi 2) Zn -2.4
Pressure: 86 bar Temperature: 45ºC
Time: 3 hours
CH4 H2
CH4: 2276 H2: outside of the
calibration zone
8 Ni
(1.8 cm2) Zn -1.8
Pressure: 85.5 bar Temperature: 45ºC
Time: 1 hour
CH4 H2
CH4:641 H2: 606
9 Ni
(2.4 cm2) Zn -1.6
Pressure: 85.3 bar Temperature: 45ºC
Time: 1 hour
CH4 H2
CH4: traces H2: 1877
10 Ni
(1.8 cm2) Zn -1.8
Pressure: 61.1 bar Temperature: 45ºC
Time: 1 hour
CH4 H2
CH4: 1771.5 H2: 5027
-100 -80 -60 -40 -20 0 20
-3.5 -3 -2.5 -2 -1.5 -1 -0.5 0
Cu rr e n t d e n si ty (m A /c m 2)
Potential vs Ag/Ag+
30 bar
60 bar
7.6 bar
Methane was the only gaseous CO2 reduction product detected. The largest methane
production was obtained at the potential of -2.4 V vs. Ag/Ag+. This result could be expected from the analysis of the cathodic curve for the Ni electrode.
Contrary to what could be expected, the concentration of methane in reaction 8 at higher pressure is lower than the concentration of methane in reaction 10. This experiment will be repeated to confirm this result.
3.1.2.3. Analysis of the liquid phase
Some samples of the liquid phase (electrolyte) were analysed by headspace-chromatography. In the chromatogram of the electrolyte after reaction 7 with Ni (2.1 cm2), no peaks other than the blank can be observed. In the case of reaction 8 shown in figure 3.12 it is possible to observe a peak at 6.45 minutes and one peak in the beginning of the chromatogram assigned to a column impurity.
Figure 3.11 - Headspace gas chromatogram of CO2 electrolysis carried out with an applied
Figure 3.12 - Headspace gas chromatogram of CO2 electrolysis carried out with at an applied
potential of -1.8V vs. Ag/Ag+, at a temperature of 45ºC, at a pressure of 85.5 bar and 1 hour reaction time (reaction 8).
As happened with copper, this results do not allow us to conclude which are the compounds present in the sample, so an 1HNMR spectroscopy was performed.
In the NMR spectra represented below, it is possible to identify the following peaks:
Peaks assigned to the IL:
δ
= 8.8 (1H,s,3);
δ
= 7.4 (1H,s,5);
δ
= 7.3 (1H,s,6);
δ
= 4.2 (2H,
t,J=6Hz,7);
δ
= 4 (3H, s,1);
δ
= 1.8 (2H, mult,8);
δ
= 1.3 (2H, mult,9);
δ
= 0.9 (3H,
t,J=6Hz,10);
Peaks assigned to the CDCl
3: 7,26 (1H,s)
Peaks assigned to the H
2O: 1,52 (2H,s)
Peaks assigned to the acetone: 2.2 (s)
In the figure 3.13 are still observed the following peaks:
δ = 4.75 – 5.75.
and in the figure 3.14:
δ = 2.8 (s); δ = 3.8 (s); δ = 8.6 (s).
Figure 3.13 - Proton NMR spectrum of the electrolyte of the electrolysis carried out with an applied potential of -1.8V vs. Ag/Ag+, at a temperature of 45ºC, at a pressure of 85.5 bar and 1 hour
reaction time (reaction 8 )
Figure 3.14 - Proton NMR spectrum of the electrolyte of the electrolysis carried out with at an applied potential of -1.6V vs. Ag/Ag+, at a temperature of 45ºC, at a pressure of 85.3 bar and 1 hour
3.1.3. Brass electrode
3.1.3.1. Voltammetry
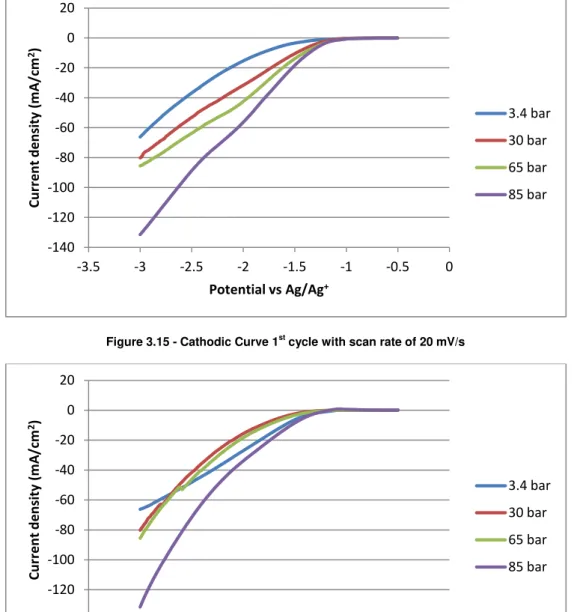
Figure 3.15 - Cathodic Curve 1st cycle with scan rate of 20 mV/s
Figure 3.16 – Anodic Curve 1st
cycle with scan rate of 20 mV/s
Figure 3.15 shows the cathodic curve at the brass electrode in ionic liquid [bmim][BF4]
with 16-19% water as electrolyte, it was measured at 318 K and at different pressures. Argon was used as reference at a pressure of 3.4 bar, CO2 was used for the other pressures.
Observing figure 3.15 it turns out that current increases with increasing CO2 pressure. The
curve for the pressure of 85 bar is the one that differs most from the reference curve. For all the pressures the onset potential for current increase was around -1.2 V vs.Ag/Ag+.
Figure 3.16 shows the anodic curve of the same electrode in the same conditions, it is observed that there aren’t oxidation waves for any of the pressures.
-140 -120 -100 -80 -60 -40 -20 0 20
-3.5 -3 -2.5 -2 -1.5 -1 -0.5 0
Cu rr e n t d e n si ty (m A /c m 2)
Potential vs Ag/Ag+
3.4 bar 30 bar 65 bar 85 bar -140 -120 -100 -80 -60 -40 -20 0 20
-3.5 -3 -2.5 -2 -1.5 -1 -0.5 0
Cu rr e n t d e n si ty (m A /c m 2)
Potential vs Ag/Ag+
3.4 bar
30 bar
65 bar
3.1.3.2. Analysis of the gas phase
Electrolysis experiments were carried out using [bmim][BF4] with 16-19% water as
electrolyte as described in the experimental section 2.6. Electrolysis was performed potentiostatically and under stirring. The analysis of the gas phase was done by GC. The chromatograms can be observed in Annex 5.
Table 3.3 – Reactions conditions performed with brass electrodes and GC results
Reaction WE CE Applied Potential
(V) vs. Ag/Ag+ Conditions Detection
Concentration (ppm)
11 (1.7 cmBrass 2) Zn -2.4
Pressure: 63.3 bar Temperature: 45ºC
Time: 2 hours
CH4 H2
CH4: 5502 H2: 41053
12 Brass
(1.7 cm2) Zn -1.8
Pressure: 62.9 bar Temperature: 45ºC Time: 30 minutes
CH4 H2
CH4: 2128 H2: 1858
In the case experimental conditions of reaction 11 methane and another unidentified gaseous product were detected (see channel 2 chromatogram in annex 5 reaction 11). This additional CO2 reduction product appears with retention times close to hydrocarbons with two carbon
atoms, such as ethylene and ethane. Additional experiments must be carried out to confirm the formation and to identify a possible second CO2 gaseous reduction product.
Also additional electrolysis conditions are necessary to characterize the behavior of brass towards CO2 electrochemical reduction.
3.1.3.3. Analysis of the liquid phase
A sample of the electrolyte after reaction 12 with Brass (1.7 cm2), was analysed by headspace chromatography and the chromatogram is shown in figure 3.17. It is possible to observe a peak at 2.19 minutes.
Figure 3.17 - Headspace gas chromatogram of CO2 electrolysis carried out with an applied
Again, the results do not allow us to conclude which are the compounds present in the sample, so 1HNMR spectroscopy was performed.
In the NMR spectrum presented below, it is possible to identify the following peaks:
Assigned to the IL:
δ
= 8.8 (1H,s,3);
δ
= 7.4 (1H,s,5);
δ
= 7.3 (1H,s,6);
δ
= 4.2 (2H,
t,J=6Hz,7);
δ
= 4 (3H, s,1);
δ
= 1.8 (2H, mult,8);
δ
= 1.3 (2H, mult,9);
δ
= 0.9 (3H,
t,J=6Hz,10);
Assigned to the CDCl
3: 7,26 (1H,s)
Assigned to the H
2O: 1,52 (2H,s)
Assigned to the acetone: 2.2 (s)
In the spectrum of figure 3.18 are still observed the following peaks:
δ =2.8 (s); δ =3.8 (s); δ =4.75 (s); δ =8.6 (s).
Again these peaks may be assigned acids formed by electrochemical reduction of CO2 and
to methanol, but without additional tests their presence cannot be confirmed.
Figure 3.18 - Proton NMR spectrum of the electrolyte of the electrolysis carried out with an applied potential of -1.8V vs. Ag/Ag+, at a temperature of 45ºC, at a pressure of 62.9 bar and 30 minutes
![Figure 1.1 – Schematic diagram of possible CO2 capture and storage systems. Adapted [4]](https://thumb-eu.123doks.com/thumbv2/123dok_br/16481245.732418/22.892.189.707.105.457/figure-schematic-diagram-possible-capture-storage-systems-adapted.webp)