Vânia Alexandra Fernandes Lourenço
Graduated in Chemical and Biochemical Engineering
Evaluation of ecotoxicological properties of
industrial wastewater after photocatalytic
treatment
This dissertation is submitted to the degree of
Master in Chemical and Biochemical Engineering
Supervisor: María Concepción Ovín Ania, CEMHTI, CNRS,
Orleáns, France
Second Supervisor: Isabel Maria de Figueiredo Ligeiro da
Fonseca, Univ. Nova de Lisboa, Lisbon, Portugal
Jury:
President: Prof. Dra Maria Madalena Alves Campos de Sousa Dionísio Andrade
Arguing: Prof. Dra Maria Manuel Serrano Bernardo Vowel: Prof. Dra Isabel Maria de Figueiredo Ligeiro da Fonseca
I
Avaliação de propriedades ecotoxicológicas de águas industriais após o tratamentofotocatalítico
Copyright © Vânia Alexandra Fernandes Lourenço, Faculdade de Ciências e Tecnologia, Universidade Nova de Lisboa, e às orientadoras da dissertação (Dr. Ania, CEMTHI, CNRS, UPR 3079, France, e Dr. Fonseca, Universidade Nova de Lisboa).
A Faculdade de Ciências e Tecnologia e a Universidade NOVA de Lisboa têm o direito, perpétuo e sem limites geográficos, de arquivar e publicar esta dissertação através de exemplares impressos reproduzidos em papel ou de forma digital, ou por qualquer outro meio conhecido ou que venha a ser inventado, e de a divulgar através de repositórios científicos e de admitir a sua cópia e distribuição com objetivos educacionais ou de investigação, não comerciais, desde que seja dado crédito ao autor e editor.
Evaluation of ecotoxicological proprieties of industrial waste water after photocatalytic
treatment
Copyright © Vânia Alexandra Fernandes Lourenço, Faculdade de Ciências e Tecnologia, Universidade Nova de Lisboa, and the supervisors of the master thesis (Dr. Ania, CEMTHI, CNRS, UPR 3079, France, and Dr, Fonseca, Universidade Nova de Lisboa).
III
“Remember Who You Are”
VII
AGRADECIMENTOS
Estes seis meses não deram apenas frutos a um nível cientifico, mas também a um nível pessoal. Aprendi como é viver noutro país, viver sozinha e a comunicar diariamente numa língua não materna, foi um enorme processo de crescimento. Mas tudo isto não foi conseguido sem ajuda, a todas as pessoas que se seguem quero dar o meu sincero agradecimento:
Á minha orientadora Doutora Maria Conchi Ania pela sua disponibilidade, compreensão, esclarecimento de duvidas e orientação, mas acima de todo isto, pelos ensinamentos, pois sem a sua ajuda, a realização deste trabalho não seria possível e por fim pela confiança depositada em mim.
Á minha co-orientadora, Doutora Isabel Fonseca, o meu eterno Obrigada, pois toda esta experiencia não teria um final tão maravilhoso sem a sua cooperação, estimulo, prontidão e disponibilidade. A sua ajuda na seleção do tema de dissertação, local e orientação foram cruciais.
Ao Consejo Superior de Investigaciones Científicas (CSIC) por autorizar a realização deste
trabalho no Instituto Nacional del Carbón.
À bolsa atribuída no âmbito do Programa Erasmus+ para realização da mobilidade.
Ao Doutor José Parra por estar sempre disponível a ensinar, partilhar conhecimentos e pela constante boa disposição. Durante o período que estive no INCAR não existiu ninguém mais humano e prestável.
Aos amigos que fiz no final deste percurso por tudo o que me ensinaram sobre as Asturias e o que é ser asturiano. Por escutarem todos os meus ‘protestos’ (que não foram poucos) e por acreditarem em mim mais do que eu mesma: Muchas gracias: Doutora Isabel Alonso-Buenaposada, Doutor Luis Adrián Montoya, Héctor García Álvarez, Doutora Ana Más, Marc Escamilla, Ivan Sainz, Laura Florentino Lopez, Luis Fernández e Rebecca García Valcárcel. Á Sofia Rebocho e Carolina Nunes por estarem ao meu lado sempre que precisei, por serem as irmãs que não tive, mas pude escolher.
Ao David Liebermann, Tiago Melo, Marta Faria, Duarte Silva, Tiago Alves, Justine Gouvenaux e muitos mais por fazerem o meu percurso universitário memorável.
À Andreia Sousa, minha coordenadora em todos estes anos em que fui trabalhadora estudante, que me flexibilizou horários, férias e licenças sem vencimento para que conseguisse terminar tanto a licenciatura como o mestrado.
VIII
neste sonho, apoiou-me e acompanhou-me até ao final: és incansável.Ao João Beirão, meu cunhado, pela ajuda, pelas palavras encorajamento, amizade e por me aturar diariamente.
Á Helena Fernandes e Pedro Candeias, mãe e padrasto, porque quando precisei estavam lá para contribuir de diferentes formas para este objetivo comum.
Sem querer esquecer toda a família Beirão e Baptista, em especial ao Engenheiro Eduardo Beirão.
IX
RESUMO
A fotocatálise heterogénea é uma das tecnologias mais promissoras para a degradação de poluentes emergentes em corpos hídricos, devido à ampla disponibilidade de fotocatalisadores de baixo custo e de elevada eficiência. O desafio, no entanto, é aumentar a exploração da luz solar através do uso de fotocatalisadores com atividade melhorada sob irradiação solar. A maioria dos estudos sobre este tópico concentra-se no aumento do rendimento da fotodegradação pela incorporação dos aditivos de carbono. No entanto, o impacto do aditivo carbonáceo sobre a toxicidade do efluente final é pouco abordado e pouco se sabe sobre a natureza dos intermediários formados quando se modifica a via da fotooxidação.
Neste contexto, o objetivo deste trabalho foi avaliar o impacto da incorporação de carbonos nanoporosos (como fotocatalisadores ou aditivos para semicondutores) em termos de avaliação de risco da ecotoxicidade usando fenol como poluente orgânico modelo.
Neste trabalho foram utilizados como catalisadores TiO2, CQ e compósitos de TiO2/CQ. Foi
medida a ecotoxicidade das amostras após 1,3 e 6 horas de fotodegradação para amostras sintéticas de fenol e amostras reais de um efluente de origem industrial.
Os resultados são interpretados em termos de ecotoxicidade das soluções obtidas após os ensaios fotocatalíticos, utilizando a inibição de bioluminescência da bactéria Vibrio fischeri, comparando com as características dos componentes de carbono (estrutura, textura) sobre o desempenho dos fotocatalisadores de semicondutores/carbono, usando como semicondutores TiO2.
Para as amostras de águas sintéticas e reais, os valores de ecotoxicidade mais baixos foram alcançados após 6 horas de fotorradiação com o CQ como catalisador.
Os resultados com amostras reais também mostraram que os ensaios de fotodegradação realizados com catalisadores de carbono nanoporosos/semicondutores híbridos podem ser mais efetivos que os semicondutores isolados ou a fotólise.
XI
ABSTRACT
Heterogeneous photocatalysis is one of the most promising technologies for an advanced degradation of emerging pollutants in water bodies, due to the widespread availability of low-cost and efficient photocatalysts. The challenge, however, is to boost the exploitation of solar light through the use of photocatalysts with improved activity under sun irradiation. Most studies on this topic focus on the enhanced photodegradation yields achieved by the incorporation of the carbon additives. However the impact of the carbonaceous additive on the toxicity of the final effluent is scarcely addressed and little is known on the nature of the intermediates formed when the photooxidation pathway is modified. In this context, the aim of this work was to evaluate the impact of the incorporation of nanoporous carbons (either as photocatalysts or additives to semiconductors) in terms of an ecotoxicity risk assessment using phenol as a model organic pollutant.
In this work it was used as catalysts TiO2, CQ and composites of TiO2 with CQ. It was measured the
ecotoxicity of samples after 1, 3 and 6h of photodegradation for synthetic samples of phenol and wastewater from industrial origin.
The results are interpreted in terms of the ecotoxicity of the solutions obtained after the photocatalytic assays by using the bioluminescence inhibition of the bacterium Vibrio fischeri, while exploring the role of the carbon component features (i.e. structure, texture) on the performance of the semiconductor/carbon photocatalysts, TiO2 using semiconductors.
For both synthetic and real wastewater samples the lower ecotoxicity values were achieved after 6 hours of irradiation with the CQ as catalyst.
The results with real samples have also shown that photodegradation assays performed with hybrid semiconductor/nanoporous carbon catalysts can be more effective than the semiconductors alone or photolysis.
XIII
TABLE OF CONTENTS
AGRADECIMENTOS ... VII
RESUMO ... IX
ABSTRACT ... XI
LIST OF FIGURES ... XV
LIST OF TABLES ... XVII
LIST OF ABBREVIATIONS ... XIX
1. Introduction ... 1
1.1. Water Pollution ... 3
1.2. Water world distribution and use ... 4
1.3. Water quality ... 6
1.4. Phenol as a contaminant ... 8
1.5. Water Treatment Technologies ... 10
Heterogeneous Photocatalysis ... 10
The use of nanoporous carbons in photocatalysis ... 12
1.6. Ecotoxicity ... 12
Bioluminescence inhibition assays ... 14
Phenol ecotoxicity ... 15
2. Objective ... 17
3. Experimental ... 21
3.1. Materials ... 23
Semiconductors ... 23
Pollutants ... 23
3.2. Characterization ... 24
Textural characterization ... 24
Adsorption of gases ... 24
BET equation ... 26
Dubinin-Radushkevich equation (DR) ... 28
XIV
Elemental analysis ... 29
Point of zero charge (PZC) ... 29
UV-Vis diffuse reflectance spectroscopy (DRS) ... 29
X-Ray diffraction spectroscopy (XRD) ... 30
Scanning electron microscopy (SEM) ... 31
3.4. Photocatalytic degradation reactions ... 31
3.5. Ecotoxicity measurements ... 32
Ecotoxicity data treatment ... 34
4. Results and Discussion ... 35
4.1. Characterization ... 37
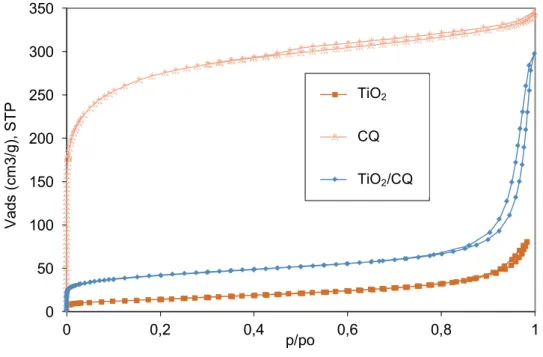
Adsorption of gases ... 37
4.2. Optimization of the experimental protocol ... 41
pH adjustment ... 41
Selection of time exposure ... 42
Aging of the solution ... 42
Electrolyte concentration ... 43
Optimized parameters for phenol ... 43
4.3. Ecotoxicity of phenol degradation intermediates ... 44
4.4. Ecotoxicity measurements of synthetic solutions ... 46
Synthetic solutions ... 46
4.5. Ecotoxicity measurements of industrial wastewater ... 56
5. Conclusions ... 61
6. References ... 65
7. Annex A ... 75
XV
LIST OF FIGURES
Figure 1.1- Water that covers the planet earth, adapted from [UNESCO, 2015] ... 3
Figure 1.2 – Water consumption distribuition by regions and use, adapted from [SSWM, 2012] ... 4
Figure 1.3 – Global population and water withdrawal over time, adapted from [AQUASTAT, 2016] ... 5
Figure 1.4 - Emissions corresponding to phenol discharges to water bodies in Europe adapted from [E-PRTR, 2015] ... 9
Figure 1.5 - Phenol Discharge to water in Spain, data of 2015 adapted from [PRTR-ES, 2015] a) main polluting sectors and b) main geographical areas ... 9
Figure 1.6 - Scheme of the mechanism for n-type semiconductor [Pelizzetti, 1989] ... 11
Figure 3.1- IUPAC classification of adsorption isotherms. Adapted from [Thommes et al., 2015] ... 26
Figure 3.2 - Emission spectrum of a high-pressure mercury lamp. Irradiation below 360 nm was cut-off with a pyrex filter ... 32
Figure 3.3 – Microtox - Model 500 ANALIZER from [Microbics Corporation, 2010] ... 32
Figure 4.1 – Nitrogen adsorption/desorption isotherms at -196ºC of the studied photocatalysts. ... 37
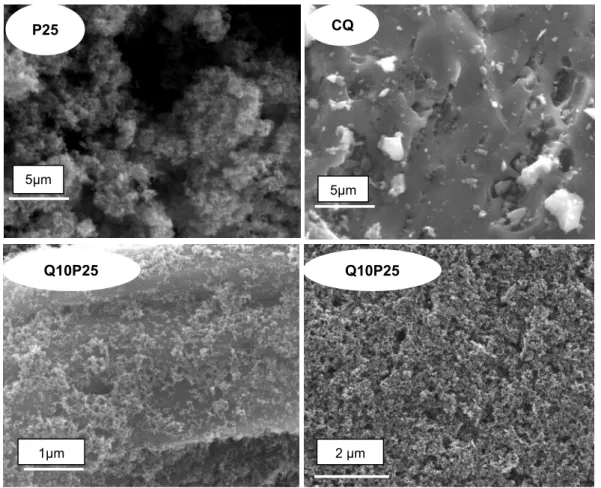
Figure 4.2 - SEM micrographs of the studied photocatalysts. ... 38
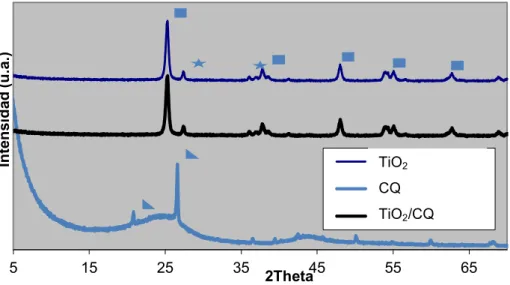
Figure 4.3 - X-ray diffraction patterns of the P25, carbon Q and composites studied. Peak marking correspond to: anatase; rutile; SiO2 ... 39
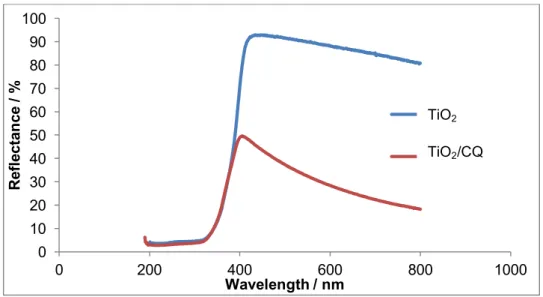
Figure 4.4 - UV-visible Diffuse Reflectance patterns of the studied photocatalysts. ... 40
Figure 4.5 - EC50 5’ and EC50 15’ for p-benzoquinone 0.023-0.026 mg/L. ... 45
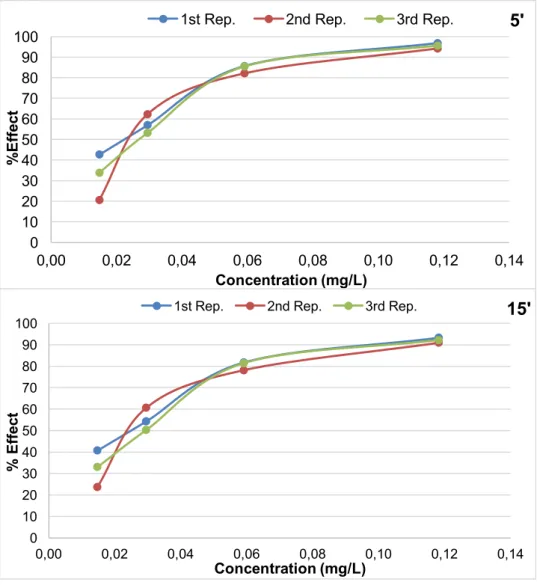
Figure 4.6 - Repetitions made for the ecotoxicity measurements for each catalyst ... 46
Figure 4.7 - Loss of bioluminescence signal after 5 and 15 min of incubation for the photolytic degradation of phenol at various irradiation times (ca. 1, 3 and 6 h). ... 47
Figure 4.8 - Evolution of phenol and intermediates concentration in solution after the photolytic degradation. ... 48
Figure 4.9 - Loss of bioluminescence signal after 5 and 15 min of incubation for the photodegradation of phenol using TiO2 as photocatalyst, at various irradiation times (ca. 1, 3 and 6 h). ... 49
XVI
Figure 4.11 - Loss of bioluminescence signal after 5 and 15 min of incubation for the photodegradationof phenol using TiO2/CQ hydrib composite as photocatalyst, at various irradiation times (ca. 1, 3 and 6
h). ... 51
Figure 4.12. Comparison of the performance of the studied catalysts after various irradiation times. .. 52
Figure 4.13. Evolution of phenol and intermediates concentration in solution after the photolytic
degradation using TiO2/nanoporous carbon composite as photocatalyst. ... 53
Figure 4.14 - Evolution of phenol concentration in solution under dark conditiosn with 3 studied
catalysts, to evalute the amount of phenol removed by adsorption. ... 54
Figure 4.15. Evolution of phenol intermediates concentration in solution after the degradation using
TiO2 (empty symbols) and TiO2/nanoporous carbon composite (filled symbols) as photocatalysts. ... 54
Figure 4.16 - Loss of bioluminescence signal after 5 and 15 min of incubation for the photodegradation
of phenol using carbon CQ as photocatalyst at various irradiation times (ca. 1, 3 and 6 h). ... 56
Figure 4.17 Loss of bioluminescence signal after 5 and 15 min of incubation in the as-received
wastewater. ... 57
Figure 4.18 - Comparative loss of bioluminescence signal after 5 min of incubation for the
photodegradation of the industrila wastewater using different photocatalyst and at various irradiation
times (ca. 1, 3 and 6 h). ... 58
Figure A7.1 .Representation of the four methods used for the calculation of the EC50 value. ... 78
Figure B8.1 - Loss of bioluminescence signal after photolysis in 5’ and 15’ of incubation.. ... 83
Figure B8.2 - Loss of bioluminescence signal after photocatalysis with TiO2 in 5’ and 15’ of incubation..
... 83
Figure B8.3 - Loss of bioluminescence signal after photocataltysis with CQ in 5’ and 15’ of incubation..
... 83
Figure B8.4 - Loss of bioluminescence signal after photocatalysis with TiO2/CQ in 5’ and 15’ of
XVII
LIST OF TABLES
Table 1.1 - Total water abstraction, share of surface water abstraction, by activity. Data since 2006 to
2011, adapted from [Whelminger, 2014] ... 5
Table 1.2 - Association between water use and quality requirements, adapted from [Sperling, 2007] ... 7
Table 1.3 - Substances present in industrial effluents adapted from Bond R.G. and Straub C.P.1974
[Sperling, 2007; Pérez, 2014; WWAP, 2017] ... 8
Table 1.4 - Disadvantages versus advantages of Microtox [Microbiology, 1994; AZUR Environmental,
1998; Blaise, Férard and Paul, 2005; ModerWater, 2012] ... 15
Table 1.5 – Ecotoxicity of phenolic compounds reported in the literature [Blum and Speece, 1991; Boyd
et al., 1997; Hoeben, 2000; Santos et al., 2004; MERK, 2010; Bendary et al., 2013; Acros Organics
BVBA, 2015] ... 16
Table 3.1 -physicochemical parameters of the real wastewater ... 23
Table 4.1 - Main textural parameters of the studied photocatalysts obtained from the analysis of the N2
adsorption data ... 38
Table 4.2 - Chemical analysis (wt.%) of the nanoporous carbon on a dry basis. ... 39
Table 4.3 – Effect of pH on the ecotoxicity expression (EC50 t’) of an aqueous phenol solution at
various exposures times -t- between 5 and 60 min. ... 41
Table 4.4 – Effect of incubation time on the EC50 t’ of phenol ... 42
Table 4.5 - Effect of aging of the sample on the EC50 t’ of phenol ... 43
Table 4.6 - Effect of NaCl as diluent electrolyte on the EC50-t’ of phenol. ... 43
Table 4.7 – EC50 values of phenol aromatic intermediates ... 45
Table A7.1 – Calculation of p-benzoquinone concentration for cuvettes A and B ... 77
Table A7.2 – Data treatment calculations of p-benzoquinone for Microtox equipment ... 77
Table A7.3 – EC50 average values for three repetitions using 4 different methods (green minimum and
XIX
LIST OF ABBREVIATIONS
ADPOR – Group of Adsorption and environmental protection on porous solids (www.incar.csic.es/adpor)
AOP - Advanced Oxidation Processes BC – Before Christ
BET - Brunauer Emmett Teller CB - Conduction band
CQ – Commercial activated carbon (brand name Aquasorb 2000) CSIC – Consejo Superior de Investigaciones Científicas
DNA – Deoxyribonucleic acid DR - Dubinin-Radushkevich
DRS - Diffuse reflectance spectroscopy EC50- Half maximal effective concentration
Eg - Band gap energy
E-PRTR - European Pollutant Release and Transfer Register FAO - Food and Agriculture Organization of the United Nations INCAR - Instituto Nacional del Carbon
IPCC - Intergovernmental Panel on Climate Change IUPAC - International Union of Pure and Applied Chemistry LD50 - Median lethal dose
OAS - Osmotic adjustment solution
PRTR-ES - Spanish Pollutant Release and Transfer Register PZC - Point of zero charge
XX
SSWM - Sustainable sanitation and water managementTEXP – Time of exposure
UNESCO - United Nations Educational, Scientific and Cultural Organization UV-Vis - Ultraviolet-visible
VB - Valence band
1
Chapter
3
1.1. Water Pollution
Water, a simple molecule composed of an oxygen atom and two hydrogen atoms linked by a covalent bond, is a colorless/transparent, odorless and tasteless substance essential for all living organisms on Earth. Despite two thirds of the planet are covered by water, freshwater accounts only to a small fraction – about 2.5 % – mostly located in polar icecaps, glaciers and permanent snow Figure 1.1. Thus, less than 0.7 % of freshwater (contained in rivers, lakes and groundwater) can be directly used [Alyssa, 1997], and its availability is strongly dependent on the water cycle -use and sanitation- [Kay, 1999].
Figure 1.1- Water that covers the planet earth, adapted from [UNESCO, 2015]
Water also plays a crucial role in sustaining a high quality of life, with unquestionable impact on human health (on average, an adult body is constituted by ca. 60% of water). The demand for food, drinkable water and industrialization makes water the most used natural resource, followed by oil and natural gas. So, water has a key role in the world economy, aside from being the basis of life [Ruz, 2011].
This natural resource, with no substitute, has become increasingly scarce and rainfall is its ultimate source. In the last 15 to 20 years, non-governmental organizations intensified the awareness about the abusive use of water, but water consumption is still growing every year. According to the Intergovernmental Panel on Climate Change (IPCC) the four main factors responsible for the aggravating water shortage are population growth, the increasing number and size of urban areas in developing countries, overconsumption and climate changes [Spencer, 2010].
Besides these factors, it is important to recall that the demand for water continues to increase at an alarming rate with global consumption, increasing twice as fast as population growth [WWAP, 2009]. According to UNESCO, about 1.2 billion people lack access to safe drinking water, ca. 2.6 billion have little or no sanitation, causing the transmission of lethal diseases through unsafe water or human excreta [Shannon, 2008]. These numbers are expected to increase, for which water will soon become the subject of international conflicts. Indeed, in 2025, the FAO (Food and Agriculture Organization of the United Nations) has estimated that at least 1.8 billion people will be living in regions with severe water scarcity [WWAP, 2015].
1% 30%
69%
Lakes
Glaciers
Groundwater 3%
4
1.2. Water world distribution and use
The main uses of water are: domestic supply, breeding of aquatic species, industrial supply, generation of electricity, irrigation, navigation, animal supply, landscape harmony, preservation of aquatic life and dilution and transport of wastes.
Domestic consumption accounts for the smallest fraction of the total water consumption (Figure 1.2), and it is mainly dedicated to clean, cook, and toilet discharges. The biggest waster footprint is the agriculture sector, followed by industry [Sperling, 2007]. The demand of agriculture is also rising rapidly, since the demand for food from the world’s population has tripled since the 20th century (Figure 1.3). Additionally, within the next fifty years, the world population is expected to increase by another 40 to 50% [Margaux, 2012], thus contributing to create water tensions.
Figure 1.2 – Water consumption distribution by regions and use, adapted from [SSWM, 2012]
Furthermore, the consumption of water per capita varies significantly among countries and continents, ranging from ca. 10 to approximately 600 L/day[Idowu, 2009; Lips, 2010].In contrast, 50 L/day is the recommended value to assure basic hygiene and food needs [Allard, 1991; Falkenmark, 2004; Lehr, 2005].
As mentioned before, the industry is the second largest consumer of water, since industrial revolution water is mainly used to produce electricity, cooling systems or as a solvent. These first two activities account for more than 50 % of the total gross water withdrawal (i.e., taken from source), surface and groundwater, in most EU countries. Figure 1.3 also shows that the amount of water withdrawal by the industry remained almost unchanged since mid-80’s, demonstrating that the concept of water recycling within factory’s processes is viable [WWAP, 2017].
0% 10% 20% 30% 40% 50% 60% 70% 80% 90% 100%
Europe China US India
5
Figure 1.3 – Global population and water withdrawal over time, adapted from [AQUASTAT, 2016]The amount of water used for construction and other industrial activities also varies significantly between countries. As shown in Table 1.1, the highest values of water consumption per capita are used for the production of electricity, and other manufacturing processes. However, it is important to point out that the amount and quality of water needed in industry depend on the nature of the activity itself and the technological processes applied.
Table 1.1 - Total water abstraction, share of surface water abstraction, by activity. Data since 2006 to 2011, adapted from [Whelminger, 2014]
Manufacturing industry Production of electricity - Cooling
Total water abstraction (m3/inhabitant)
Share of surface water abstraction (%)
Total water abstraction (m3/inhabitant)
Share of surface water abstraction
(%)
Belgium 101.3 93.9 380.2 100
Bulgaria 18.5 46.8 512.5 99.9
Czech Republic 22.3 89 65 100
Denmark 6 0.3 0.3 0
Germany 57 83.6 243.8
Estonia 15.7 71.4 757.8 100
Greece 9 73.3
Spain 10.9 65.1 135.5 100
France 41.2 60.3 339.1 99.9
Croatia 7.4 74.5 27.2 99.1
Latvia 11.1 44.9 1 86
Lithuania 9.3 86 87.8 100
Hungary 8.1 48.5 432.9 99
Netherlands 186.9 95.1 343.7 99.9
Poland 12.3 66.5 178.8 99.8
Romania 36.6 84.9 165.5 99.7
0 2000 4000 6000 8000 0 1000 2000 3000 4000 5000
1950 1960 1970 1980 1990 2000 2010
Po p u la ti o n ( m il li o n ) Wa te r w it hdr a w a l (k m 3 /y e a r) Years
agriculture industry domestic use
6
1.3. Water quality
Water treatment technology has been identified as a high priority research area due to the overwhelming impacts of water scarcity, lack of adequate sanitation systems in human needs, and lately, the fear generated upon the possibility of water contamination. Consequently, the need for the development of smart and integrated response strategies to guarantee water quality protection against current threats is most urgent.
Historically, the answer to water scarcity has been boosting new sources of water supply however, this strategy no longer guarantees the water security and Europe must look at new tactics, such as water conservation, water-use efficiency improvements and water recycling. Special attention is nowadays being paid to the reutilization of poor quality water, including treated wastewater -already used for irrigation purposes in some countries-. However, the implementation of wastewater reuse in Europe faces quite a few challenges, related to the presence of pollutants, the low coverage of water sanitation and low social acceptance. If this strategy is to be extended for human consumption resources, a precise control of water quality is essential. In this regard, the quality of water and treated water is different depending on the end-user and/or reutilization purposes.
Table 1.2 presents water general and specific uses as well as the main quality requirements for each use [Sperling, 2007]. As seen, domestic water supply is the most demanding sector that requires the fulfillment of several quality standards. In the case of water bodies with multiple uses, the final quality must also satisfy multiple requirements. It should also be pointed out that reaching zero levels of certain contaminants may not be feasible (or even necessary), for certain final reutilization proposes. Besides domestic effluents, the dawn of the industrial revolution in the eighteenth century in the now developed countries pointed out the beginning of society’s dilemma with the fate of wastewaters originated from industrial activities [WWAP, 2017]. Then and now, industrial effluents have been discharged into natural streams (rivers, lakes), with the misguided belief that ‘the solution to pollution is dilution’.
An additional challenge is the fact that quality of industrial watercourses is completely dependent of the nature and size of the industry and manufacturing process, and little is known about the pool of pollutants for different processes. To overcome this issue, some developed countries have started to compile and make accessible solid information about wastewater volumes and toxicity.
7
Table 1.2 - Association between water use and quality requirements, adapted from [Sperling, 2007].Table 1.3 compiles selected pollutants usually present on industrial wastewater, along with their corresponding sources. Other examples of toxic organic pollutants in industrial effluents are: methyl chloride, 1,1,1-trichloroethane, toluene, ethyl benzene, trichloroethylene, tetrachloroethylene, chloroform, bis-2-ethyl-hexyl phthalate, 2,4-dimethyl phenol, naphthalene, butylbenzylphthalate, acrolein, xylene, cresol, acetophenone, methyl-sobutyl-acetone, diphenylamine, aniline and ethyl acetate, among most representatives [Sperling, 2007].
General USE Specific USE Quality requirements
Domestic
supply -
- Free from chemical substances and organisms harmful to health
- Low aggressiveness and hardness
- Aesthetically pleasant (low turbidity, color, taste and odor; absence of macro-organisms)
Industrial supply
Water incorporated into the product (e.g. food, drinks,
medicines)
- Free from chemical substances and organisms harmful to health
- Aesthetically pleasant (low turbidity. color. taste and odor; absence of macro-organisms)
Water that enters in
contact with product - Variable with the product Water that does not
enter in contact with product (e.g. refrigeration units, boilers)
- Low hardness - Low aggressiveness
Irrigation
Horticulture. products ingested raw or with skin
- Free from chemical substances and organisms harmful to health
- Non-excessive salinity
Animal water
supply -
- Free from chemical substances and organisms harmful to animal’s health
Preservation of
aquatic supply -
- Variable with the environmental requirements of the aquatic species to be preserved
Recreation and leisure
Direct contact with liquid medium: e.g. bathing, swimming, water-skiing, surfing
- Free from chemical substances and organisms harmful to health
- Low levels of suspended solids, oils and grease.
Transport - - Low presence of course material that could be
dangerous to vessels
Energy generation
Hydroelectric power plants
- Low aggressiveness Nuclear or
thermoelectric power plants (e.g. cooling towers)
8
Table 1.3 - Substances present in industrial effluents adapted from Bond R.G. and StraubC.P.1974 [Sperling, 2007; Pérez, 2014; WWAP, 2017]
Substances Source
Ammonia Gas. coke and chemical manufacture
Cyanides Gas and coke manufacture. plating and metal cleaning
Formaldehyde Synthetic resins and penicillin manufacture
Organic acids Distilleries and fermentation plants
Phenols Gas and coke manufacture, chemical plants, textile
Sulfides Textile industry. tanneries and gas manufacture
Zinc Galvanizing zinc planting and rubber process
1.4. Phenol as a contaminant
Phenol is the parent substance of a homologous series of compounds containing a hydroxyl group bound directly to an aromatic ring, being the simplest aromatic member of alcohol. From a chemical point of view, the hydroxyl group of phenol determines its acidity whereas the benzene ring characterizes its basicity. It is a clear, colorless compound in the molten state, with a low melting point and characteristic odor. Phenol is quite soluble in water and most organic solvents (aromatic hydrocarbons, alcohols, ketones, ethers, acids, halogenated).
Known to be one of the most versatile organic chemicals, phenol has achieved considerable importance as the starting material for numerous intermediates and final products. Until World War II, it was essentially produced by extraction of natural resources (coal-tar and lignin). Because its consumption rose significantly, the extractive methods were replaced by synthetic methods such as the low-temperature carbonization of wood, and the Hock process starting from cumene. It is also formed during petroleum cracking.
Phenol was first used as a disinfectant for sterilizing wounds, surgical dressings and instruments, and household antiseptic. However, it has limited use in pharmaceuticals or household applications due to its toxicity, well documented in the literature. It is known to cause skin caustic burns, dyspnea, cyanosis, lung edema, severe damage to inner organs (kidneys, liver, spleen, lungs) [Rappoport, 2003; Zazo, 2006]. According to some reports [Baruah, 2011], phenol has cytotoxic effect on skeletal muscle, and his derivatives also cause inhibition of DNA synthesis in the human cells, inducing of gene mutations. The LD50 of phenol is 1g/L for humans.
Phenol is presented in wastewaters from pharmaceutical, chemical and paper mills with concentrations ranging between 35 and 400 mg/L. It may be also generated from the natural degradation of organic wastes including benzene [Germán, 2009]. In some extreme cases, such as in wastewater from petrochemical, it can reach values of 30 to 50 g/L [Olguin-Lora, 2003].
9
Figure 1.4 - Emissions corresponding to phenol discharges to water bodies in Europe adaptedfrom [E-PRTR, 2015]
In Spain, the Spanish Pollutant Release and Transfer Register (PRTR-ES) reported 82 t/discharged in 2015 (of which 5 t accidental), most of them associated to the energy sector and to accidental spills from urban wastewater treatment plants (WWTP) and the Catalonia Region ranked 1st polluting area in Spain (Figure 1.5), in 2015 [PRTR-ES, 2015].
Figure 1.5 - Phenol Discharge to water in Spain, data of 2015 adapted from [PRTR-ES, 2015] a) main polluting sectors and b) main geographical areas
Such high concentrations of phenol in industrial wastewater make the treatment with biological processes non-viable, as it is also known to inhibit the microorganisms activity [Germán, 2009]. Phenol is fast degraded on air, 14.6 hours, by a radical reaction, but may persist in water for a longer period [Crawford, 2006]. Researchers have been using many technologies for phenolic wastewater treatment, such as biological treatment, chemical precipitation or oxidation, ion exchange, adsorption on activated carbons, among others [Khehra, 2006; Zazo, 2006; Lucas, 2007; Raghu, 2007; Wongsarivej, 2009]. Among different alternatives, Advanced Oxidation Processes (AOP) and particularly heterogeneous photocatalysis based on semiconductors has been widely studied for the degradation of phenol and derivatives from water streams.
0% 10% 20% 30% 40% 50% 60%
United Kingdom Norway Spain France Romania Poland Germany Czech Republic Croatia Hungary Portugal 59% 16% 11%
6%5% 3%
b) Catalonia Aragon Andalusia Asturias Basque Country Other regions 47% 31% 7% 6% 9%
a) Energy sector
WWTP
10
1.5. Water Treatment Technologies
For millennia, wastewater has been managed in many ways, but still evolving and it’s believed to be a non-stopping development. In the past, the first ‘sewers’ were created in the seventh century BC, in Rome. Around the second and first centuries BC, that same sewers, had an additional system becoming the most complex among the many wastewater collectors at the time. First it was built as an open freshwater canal and second modified into a monumental underground tunnel, with tuff and vaults. Besides the first sewers, Romans were also pioneers on the creation of an economic system around the sanitation services. To use the public latrines or rent chamber pots, it was charged a small fee to keep and expand the sanitation services. Although it is not exactly the same, but these systems (sewage and economic) aren’t so different from what is used today [Biscarini, 2017].
Nowadays water treatment varies a lot worldwide, but before the water is re-used or discharged, it generally involves, two or three stages [Wilson, 2016]:
• Primary Treatment: removal of solids using filters, screens, sedimentation tanks and dissolved
air flotation tanks;
• Secondary: biological treatment to remove dissolved organic matter through techniques such
as an aeration tank, trickling filter and activated sludge process, followed by settling tanks;
• Tertiary (advanced treatment): Additional treatment to remove nutrients, such as nitrogen,
phosphorous and suspended solids, through technologies including sand filtration or membrane filtration. Disinfection is often the final step before discharge.
Tertiary treatments are less implemented, although the purpose of these final treatments is to further improve the effluent quality before its discharge to sensitive or fragile receiving environments. Tertiary treatments gather different technologies, and usually involve disinfection with ultraviolet radiation, ozone or chlorine and/or advanced water treatment technologies, as is the case of activated carbons adsorption and AOPs. The effluents from a tertiary treatment may be sufficiently clean to become a reclaimed water source which may be reused.
Heterogeneous Photocatalysis
Heterogeneous photocatalysis has become one of the most popular and promising AOP for the degradation of recalcitrant pollutants in air, water and wastewater. Photocatalysis is defined as a change in the rate of a chemical reaction or its initiation under the action of ultraviolet, visible or infrared radiation in the presence of a substance −the photocatalyst− that absorbs light and is involved in the chemical transformation of the reaction partners [Braslavsky, 2007]. The incident light acts as an activating or promoting agent in the reaction, but not as catalyst since it is consumed during the process.
11
bands (Figure 1.6): occupied energy states that corresponds to the valence band (VB, upper edge), whereas the unoccupied energy level is the conduction band (CB, lower edge). The difference between those two levels is known as the energy band gap Eg of the semiconductor.Figure 1.6 - Scheme of the mechanism for n-type semiconductor, adapted from [Pelizzetti, 1989].
The mechanism of light absorption in a wide band gap n-type semiconductor −such as titanium dioxide− is based on interband electron transitions between the VB and the CB that may generate a series of chain oxidative-reduction reactions. When semiconductor particles are irradiated with photons with energy equal to or higher than its band gap, electrons (e-) are excited from the VB into the unoccupied CB, whereas positive holes (h+) are created in the VB (reaction 1.1). The photogenerated charge carriers (e-/h+) can recombine radiatively (photoluminescence) or non-radiatively (dissipating the energy as heat), or migrate to the surface reaction sites and get scavenged to react with electron donors or acceptors near the photocatalyst surface (typically water and/or oxygen). The competition between these processes determines the overall efficiency of the photocatalytic process. Subsequent chemical events at the liquid-semiconductor interface between e-/h+ pairs and species in solution also determine the efficiency of the photocatalytic reaction. In the case of TiO2, most common reactions involve the formation of radicals (hydroxyl radicals, superoxide)
according to:
Semiconductor + hν ⟶ e1+ h2 (reaction 1.1)
H4O + h2⟶ HO•+ H2 (reaction 1.2)
O4+ e1 ⟶ O4•1 (reaction 1.3)
The major drawback of most semiconductors is their low photonic efficiency under sunlight. As an example, the benchmark material, TiO2, does not absorb photons with wavelength longer than 387 nm
12
The use of nanoporous carbons in photocatalysis
Triggered by the rising interest in heterogeneous photocatalysis for environmental remediation or energy conversion, numerous approaches have been established to improve the photocatalytic activity of semiconductors. Most approaches focus on the development of new materials with improved activity in the visible region [Malinkiewicz, 2013; Green, 2014; Stranks, 2015], the incorporation of metallic dopants to modify the band gap of the semiconductor, surface sensitization, and the immobilization of the photoactive material on appropriate substrates [Minero, 2000; Cho, 2001; Han, 2009; Maçaira, 2013; Cordero-Garcia, 2016].
Extensive work has also been carried out on the use of carbon materials for this purpose, particularly on the use of different forms of carbons as additives to semiconductors for enhancing the spectral response in the UV and visible light range [Matos, 1998; Tryba, 2008; Faria, 2009; Matos, 2010; Leary, 2011]. Enhancement of the photocatalytic response of such carbon/semiconductor composites has been traditionally attributed to either the strong interfacial electronic effects provided by the carbon matrix, and/or improved mass transfer effects when nanoporous carbons are used as non-photoactive supports.
In 2010, the pioneering studies carried out in the ADPOR group of Dr. Ania (supervisor of this master thesis) have reported the self-photochemical activity of nanoporous carbons under UV-Vis irradiation in the absence of semiconductors [Velasco, 2010]. These studies showed an improvement in photo-oxidation of phenol in aqueous solution by irradiation of an nanoporous carbon (compared to both the photolytic breakdown and the use of either bare or carbon-immobilized titania), demonstrating the effect of the carbon material beyond the synergistic effect of the porosity [Andrade, 2015; Carmona, 2015, 2016; Gomis-Berenguer, 2016].
The combination of photocatalytic runs with electronic spin resonance spectroscopy and electrochemical tools demonstrated the ability of theses nanoporous carbons to generate radical species when irradiated in aqueous environments -although this was not an intrinsic property of all carbon materials- [Velasco, 2013; Velasco, 2014; Gomis-Berenguer, 2017]. As a result, the photodegradation of the target pollutant was enhanced due to the photochemical activity of the nanoporous carbons when irradiated alone, or to its contribution when using semiconductor/nanoporous carbon hybrid photocalysts [Velasco, 2012; Andrade, 2014; Gomis-Berenguer, 2016].
1.6. Ecotoxicity
13
specific information on toxicity and ecotoxicity, allowing the incorporation of toxicity parameters in environmental regulation.Paracelsus told us: Sola dosis facit venenum, meaning that all things are toxic and the dosage makes it “toxicant”. In this context, Gallo in 1995, reinforced by asking two questions: what is it? And how much? In other words, that a toxicant must be defined both qualitatively and quantitatively.
The term ecotoxicology was introduced by René Truhaut in 1969, and reflects the concern about the chemical effects on the environment and in non-human species. Nowadays is defined as the study of the adverse effects of chemicals on ecosystems [Klaassen, 2012; Walker, 2012]. Toxicological bioassays were based upon an experimental design of five elements: the sample, the biota, the duration, the endpoint, and the dose response [Wells, 1998]. The most usual measurement is the endpoint which is usually the death of the biota. The main goal is the use of more sophisticated indices, avoiding death [Walker, 2012].
Various terms are used depending on the exposure time between the organism and the chemical agent. Acute exposure refers to organisms are exposed to a chemical agent in a single event or in multiple events occurring in a short period of time, usually ranging from hours to days. In contrast, chronic exposure refers to organisms exposed to low concentrations of a toxic agent released continuously or with some periodicity over a long period of time (weeks, months or years).
Many methods have been development over the years to monitor and assess the toxicity of the pollutants discharged to water bodies. Traditionally, crustaceans, fish and algae were used for aquatic toxicity measurement, but the tests based on microorganisms have been gaining popularity in the last decades. Animal and plant bioassays typically have good sensitivity and permit real-time analysis. Their main disadvantages are associated to standardization issues of the organisms, the requirement of special equipment and skilled operators, and the lack of reproducibility of the bioassays. On the other hand, bacterial bioassays are rapid, cost effective and more reproducible [Gomes, 2007].
14
Bioluminescence inhibition assays
Bacterial bioassays are thus among most widely used test for evaluating the ecotoxicity, either based on bacteria population growth, substrate consumption, respiration, luminescence or bioluminescence inhibition assays. The growing interest in bacterial bioassays, and particularly bioluminescence one, is due to the fact that, despite the existence of different toxicity mechanisms for various organisms of different species, a substance that is toxic for an organism often demonstrates similar toxic effects on other organisms [Kaiser, 1998]. Thus, luminescence inhibition in bacteria may also indicate toxic effects on higher organisms. The test species used for bioluminescence inhibition assay includes mainly Vibrio fischeri/Photobacterium phosphoreum, Vibrio harveyi and Pseudomonas fluorescens. Among bacterial bioassays, Vibrio fischeri luminescence inhibition test is the most common one. Vibrio
fischeri, is a marine gram negative non-pathogenic bacterium belonging to the Vibrionaceae family,
that poses a flexible metabolism [Gomes, 2007]. Several commercial test kits (i.e., Microtox, LUMIStox, ToxAlert) are available in the market [Parveza, 2006].
The reaction is based on the luminescence decay of this bacterium when it is exposed to a chemical agent. The bioluminescence is directly proportional to the metabolic activity of the bacterial population, thus any inhibition of enzymatic activity corresponding to a lethal or sub-lethal response results in a decrease in the bioluminescence signal. The protocol for the measurement of the toxicity has been reported by [Kahru, 1996], and consists basically on exposing a culture suspension with a certain volume of the test chemical agent in an inert electrolyte (typically NaCl) at controlled temperature (ca. near ambient condition) and measure the decrease in the bacterial luminescence due to presence of the toxic compound after a certain time of exposure. The concentration of the pollutant that causes a 50% reduction in light after exposure is designated as the EC50.
Several factors may influence the toxicity and endpoint during the bioassay, such as pH, turbidity, exposure and aging times, and incubation temperature. For instance, solution pH is usually controlled between 6-8 in standardized analysis methods (even although the vibrio fishery can live between pH 4-9) to assure reproducibility. As for the exposure time, based on the literature Vibrio fischeri inhibition test requires only 5–30 min for toxicity prediction. However, this parameter strongly depends on the substance being tested, thus it is important to optimize it. Another parameter to be considering are the aging of the sample itself, and the fact that Vibrio fischeri bacteria are commercialized in a lyophilized state, so need to be reconstituted for its use. Reconstituted bacteria should be used within the next three hours (as the results may be compromised afterwards).
15
Table 1.4 - Disadvantages versus advantages of Microtox [Gaudet, 1994; AZUR Environmental, 1998;Blaise, 2005; ModerWater, 2012]
Advantages Disadvantages
- does not take up much laboratory space -marine bacteria may have little biological significance
- does not require high skilled workers - the need to increase the salinity of some samples to a level compatible with the requirements of the bacteria used, which may favor the precipitation of heavy metals - it is a low cost, simple and reproducible
method
-bioluminescence of bacteria decreases over time, requiring precise control over the duration of the test (thus limiting the number of samples processed simultaneously) - it only requires 2.0 ml of sample and the
bacteria are easy to obtain and store
- the color and turbidity of the effluent to be tested influences the extent of light emitted. - variety of solid and liquid samples can be
tested, including turbid and colored substances, and the quick response to that vast number of substances;
- can be used as an early warning system detecting toxins in an aquatic environment
Phenol ecotoxicity
Phenol is a high toxic pollutant frequently found in wastewaters of various origins, thus its ecotoxicity in aquatic environments has been widely reported in the literature for various species. Table 1.5 collects data corresponding to values of EC50 after 5 and 15 min using the Vibrio fischeri luminescence
inhibition test. Values showed quite a large variability, with EC50-5’ ranging between 10-35.8 mg/L.
16
Table 1.5 – Ecotoxicity of phenolic compounds reported in the literature [Blum, 1991; Boyd,1997; Hoeben, 2000; Santos, 2004; Merck, 2010; Bendary, 2013].
EC50 -5`(mg/L) EC50 -15`(mg/L
Phenol
10-30 20 17 20.19 13-26 21.1-35.8
15.1
20 25.61 21.36 21
Catechol
32 7
8.32 2.7
Hydroquinone 0.079
0.042
0.04 0.041
Resorcinol
375 310 370
265 (30 min) 264 (30 min)
Benzoquinone
0.0085 0.020
0.08 1.4
17
Chapter
19
The main goal of this master thesis was to evaluate the impact of the incorporation of nanoporous carbons (either as photocatalysts or additives to semiconductors) on the ecotoxicological properties of the treated water after the photocatalytic treatment, using phenol as a model organic pollutant commonly present in industrial wastewaters. The specific objectives followed to achieve the main purpose of this thesis were:• To optimize and validate an experimental protocol based on the inhibition luminescence of Vibrio
Fisheri bacterium for the evaluation of the ecotoxicity of synthetic aqueous solutions containing
phenolic derivatives, as well as in real wastewater from industrial origin.
• To analyze the ecotoxicity of solutions after photocatalytic degradation using TiO2 nanopowders as
benchmark photocatalyst using simulated solar light.
• To analyze the ecotoxicity of solutions after photocatalytic degradation using a nanoporous carbon either as photocatalyst or additive to TiO2, using simulated solar light.
The research described in this master thesis has been performed in Oviedo, Spain, within a research internship in the framework of the Eramus+ Program agreement reference PLISBOA03 between Universidad Nova de Lisboa in Portugal and Universidad de Oviedo in Spain. The activities of the internship were carried out at Instituto Nacional del Carbon (INCAR, belonging to Agencia Estatal CSIC) in Oviedo, under the supervision of Dr. Ania (Tenured Scientist of CSIC in Spain -currently in absence leave-, and Directeur de Recherche of CNRS in France -current affiliation-) according to the agreement Universidad de Oviedo-CSIC for education and scientific activities (BOPA núm. 139 de 17-vi-2013).
The results obtained so far in this master thesis have been presented in a poster communication at the conference SECAT (see details below):
21
Chapter
23
3.1. Materials
Semiconductors
Commercially available titanium dioxide powders manufactured by Degussa (Evonik, brand name P25) were selected as semiconductor. This material is widely used both in academia and industry, and has become a benchmark for photocatalytic applications.
We have selected a commercial activated carbon (CQ) (supplier Agrovin SA, Spain; brand name Aquasorb 2000) obtained from the physical activation of bituminous coal with CO2. A particle size of
0.212-0.710 mm was selected for all the experiments. Before usage, the carbon was washed in distilled water at 60 ºC, dried at 110 ºC overnight and kept in a desiccator until use. This carbon is characterized by low oxygen content (ca. 2.1 wt.%), a basic nature (point of zero charge of 9.2 pH units).
For the preparation of the composites, a weight ratio of 10% was selected based on our previous studies [Haro, 2012]. The semiconductor/carbon composites were prepared by physical mixture of commercial titanium oxide (P25) and the activated carbon in a mortar.
Pollutants
Synthetic solutions were made using phenol, catechol, resorcinol, hydroquinone and benzoquinone (purity at least 99 % Sigma-Aldrich and Merck reactives). Initial concentration of the synthetic solutions was ca. 100 ppm. Precautions need to be taken during the preparation of phenolic solution (particularly during weighting) since phenol liquefies fast when exposed to air, and reacts with plastic holder (thus glass holders were used). The prepared synthetic solutions were stored in dark containers and at low temperature (≈4ºC).
A real wastewater sample was used in this study. Before the analysis of the real wastewater, it was stirred for 15 minutes and filtered (filter pore size ca. 8 µm). Selected physicochemical parameters of the real wastewater are in Table 3.1.
Table 3.1 -physicochemical parameters of the real wastewater
Parameters Units
pH 8.6 --
conductivity 1067 microS/cm at 20ºC
suspended solids 39 mg/L
Chemical Oxygen Demand 848 mg/L
Total organic Carbon 291 mg/L
Phenols 4.2 mg/L
24
3.2. Characterization
Textural characterization
The International Union of Pure and Applied Chemistry (IUPAC) defines the texture of a material as the detailed geometry of the void and pore space [Sing, 1985; Thommes, 2015]. Porosity is a concept related to texture and may be defined as the ratio between the volume of pores and voids, and the volume occupied by the solid. However, given porosity value cannot be regarded as characteristic of the material, since it depends on the method used for its determination. The accessible area of solids increases with the splitting state of the solid, but mainly depends on the porosity of the surface. In a way that is necessarily arbitrary, it is considered that the outer area corresponds to the area of the walls of the pores and slits having a depth greater than the width. Porous solids usually have an internal area that is of a much higher order of magnitude than the external area.
IUPAC classifies the pores according to their size as [Sing, 1985; Thommes, 2015]:
i) Macropores: pore widths, exceeding about 50 nm;
ii) Mesopores: pore widths between 2 nm and 50 nm;
iii) Micropores: pore widths not exceeding about 2 nm.
More recently, the term nanopores was accepted to include the above three categories of pores, but with an upper limit close to 100 nm width [Thommes, 2015]. Some other authors proposed additional classifications to distinguish, for instance, ultramicropores with less than 0.7 nm; micropores, corresponding to a widths between 0.7 and 1.4 nm; and supermicropores, widths between 1.4 and 3.4 nm [Rouquerol, 2014].
In this experiment the nanoporous texture of the materials has been characterized by physical adsorption of different gases, obtaining different parameters such as specific surface area, total volume of pores and pore size distribution. Two volumetric analyzers were used for N2 isotherms
at -196 °C: ASAP 2020 and TRISTAR 3020, both supplied by Micromeritics. All samples were previously outgassed under vacuum (ca. 10-1 Pa) at 120 °C (heating rate of 2.5 °C/min) for 17 h, following the recommended conditions to obtained reproducible and accurate data [Figini-Albisetti, 2010]. Dubinin-Radushkevich (DR) equation has been applied to the N2 adsorption isotherms
at -196 °C to obtain the total micropore volume (Wo, N2).
Adsorption of gases
25
gas-solid system. For a given gas adsorbed on a particular solid at a constant temperature, and if the gas is below its critical temperature, the number of moles of gas adsorbed may be expressed as:n = f p
p: ;,=>?,?@ABC Equation 3.1
Where p0 is the gas saturation pressure and p/p0 is the relative pressure.
This equation is a general expression for an adsorption isotherm and represents the relationship between the amount adsorbed by unit mass of solid and the equilibrium pressure (or relative pressure), at a known temperature.
Experimental adsorption isotherms are usually presented in graphical form, and display various characteristic shapes for many different gas-solid systems. These shapes are important since they provide useful preliminary information about the pore structure of the adsorbent. The majority of gas/ vapor adsorption isotherms (i.e. at subcritical temperatures) may be divided into six groups (I to VI), according to the extended IUPAC classification proposed in 2015 [Thommes, 2015] (see Figure 3.1). Others can usually be explained as a combination of two (or more) of the shapes proposed (composite or hybrid isotherms). The six Types I, II, III, IV, V and VI are similar to those originally proposed by Brunauer, Deming, Deming and Teller, usually referred to as the BDDT classification [Brunauer, 1940].
Reversible Type I isotherms are given by microporous solids presenting relatively small external surface areas, as is the case for some activated carbons, molecular sieve zeolites and certain porous oxides. They are concave to the p/p0 axis and characterized by a limiting value of the amount
adsorbed, which begins to set at relatively low relative pressure and is extended to the saturation pressure. Type I(a) isotherms are given by microporous materials having mainly narrow micropores, while Type I(b) isotherms are characteristics of materials with wider pore size distributions.
Reversible Type II isotherms are characteristics of the adsorption of most gases on non-porous or macroporous adsorbents, with unrestricted monolayer-multilayer adsorption. These isotherms are concave relative to the x-axis up to a certain point, normally referred to as Point B, when the middle almost linear section starts; Point B usually corresponds to the completion of monolayer coverage. The Type III isotherms are convex in relation to the axis of the abscissas and do not present a Point B, with no monolayer formation. This indicates that the adsorbent-adsorbate interactions are relatively weak and the adsorbed molecules are clustered around the most favorable sites on the surface of a non-porous or macroporous solid. Type IV isotherms are characteristic of mesoporous adsorbents, as many oxide gels, industrial adsorbents and mesoporous molecular sieves. The adsorbent-adsorptive interactions and the interactions between the molecules in the condensed state rule the adsorption behavior in mesopores.
26
reversible Type IV(b) are observed for adsorbents having mesopores of smaller width. Type V isotherms are, to a certain pressure value, similar to the isotherms of Type III, which is an indication of relatively weak adsorbent-adsorbate interactions. Reversible stepped Type VI isotherms are associated with layer-by-layer adsorption on highly homogenous non-porous surfaces.Figure 3.1- IUPAC classification of adsorption isotherms. Adapted from [Thommes, 2015]
BET equation
The work of Brunauer and Emmett, preceding the publication of the Brunauer-Emmett-Teller (BET) theory in 1938, reported that the adsorption isotherms of a number of gases, measured at temperatures at/or near their respective boiling points, were all S-shaped with certain distinctive features [Rouquerol, 2014]. Other authors, including Langmuir, recognized that this type of adsorption was not always restricted to monolayer coverage and an empirical approach was adopted by Emmett and Brunauer to ascertain the stage at which the multilayer adsorption began. They eventually decided that completion of the monolayer was characterized by the beginning of the nearly linear section of the adsorption isotherm (designated Point B). The surface area was then evaluated from the
Relative pressure (p/p0)
Am
o
u
n
t
a
d
s
o
rb
e
d
I(a) I(b)
II III
IV(a) IV(b)
27
amount adsorbed at Point B by making the further assumption that the completed monolayer was in a close-packed state.A dynamic equilibrium of adsorption and desorption is recognized, but the possibility of forming adsorbed multilayers is included. BET model is based on the several assumptions: i) in each layer, the adsorption rate is equal to the desorption rate; ii) the heat of adsorption from the second layer is constant and equal to the vapor condensation heat; iii) when p is equal to p0, the vapor condenses as
a liquid and the ordinary number of adsorbed layers is infinite. The BET equation is expressed as:
n(p) = nF CHI; p
p − p: 1 + CHI;− 1 p/p:
Equation 3.2
where n(p) is the amount of adsorbed gas at pressure p, nm is the adsorbed amount needed to fill the
monolayer, p0 corresponds to the vapor saturation pressure and CBET is designated as the BET
constant which is related to the adsorbate-adsorbent interactions.
The application of this equation in the experiment data allows the determination of the number of adsorbed moles in the monolayer (nm) and the equivalent surface area (SBET). BET equation can be
linearized in different forms; in this thesis, the one proposed by Parra et al. in 1995 [Parra, 1995] is used:
1 n 1 − x =
1 nF
+ 1
nF CHI; 1 − x
x Equation 3.3
where x is the relative pressure (= p/p0).
BET theory appeared to provide a sound basis for the identification of Point B as the stage of monolayer completion and the onset of multilayer adsorption. Since then, it has become a standard procedure for the determination of the surface area of a wide range of porous materials [Rouquerol, 2014]. On the other hand, it is now generally recognized that the theory is based on an oversimplified model of multilayer adsorption and that the reliability of the BET method is questionable unless certain conditions are prescribed.
The BET method can be applied to many Type II and Type IV isotherms, but needs to be applied with extreme caution for microporous materials (i.e. Type I isotherms and combinations of Types I and II or Types I and IV isotherms). In these cases, it may be very difficult to detect the formation of the monolayer from the multilayer adsorption and micropore filling, for which the linear range of the BET plot may be difficult to locate. The IUPAC has addressed this concern in the latest review in 2015 [Thommes, 2015], recommending a procedure to overcome this difficulty and to avoid any subjectivity in evaluating the BET monolayer capacity. The procedure is based on various criteria: i) the CBET
![Figure 1.2 – Water consumption distribution by regions and use, adapted from [SSWM, 2012]](https://thumb-eu.123doks.com/thumbv2/123dok_br/16479868.732366/30.892.174.719.449.736/figure-water-consumption-distribution-regions-use-adapted-sswm.webp)
![Figure 1.3 – Global population and water withdrawal over time, adapted from [AQUASTAT, 2016]](https://thumb-eu.123doks.com/thumbv2/123dok_br/16479868.732366/31.892.175.719.104.401/figure-global-population-water-withdrawal-time-adapted-aquastat.webp)
![Figure 1.4 - Emissions corresponding to phenol discharges to water bodies in Europe adapted from [E-PRTR, 2015]](https://thumb-eu.123doks.com/thumbv2/123dok_br/16479868.732366/35.892.176.717.103.399/figure-emissions-corresponding-phenol-discharges-bodies-europe-adapted.webp)
![Figure 3.1- IUPAC classification of adsorption isotherms. Adapted from [Thommes, 2015]](https://thumb-eu.123doks.com/thumbv2/123dok_br/16479868.732366/52.892.234.616.234.824/figure-iupac-classification-adsorption-isotherms-adapted-thommes.webp)