1 Antioxidants in Pinus Pinaster roots and mycorrhizal fungi
during the early steps of symbiosis
MÁRCIO CAROCHOa,b, ISABEL C.F.R. FERREIRAa,b,*LILLIAN BARROSa,b, JOÃO C.M. BARREIRAa,b, ANABELA MARTINS,b
a
CIMO-ESA, Instituto Politécnico de Bragança, Campus de Santa Apolónia, Apartado
1172, 5301-855 Bragança, Portugal.
b
Escola Superior Agrária, Instituto Politécnico de Bragança, Campus de Santa
Apolónia, Apartado 1172, 5301-855 Bragança, Portugal.
ABSTRACT
Ectomycorrhizal symbiosis between fungi mycelia and the roots of some plants could have important effects in the levels of antioxidants of both partners. In the present work, the effects of co-culture period in the antioxidant properties and antioxidants (phenolics, tocopherols and sugars) production during early steps of in vitro mycorrhization (Pinus pinaster-Pisolithus arhizus and Pinus pinaster-Paxillus involutus) were evaluated. The studied parameters were determined in each culture element (root, mycelium and medium) in order to understand the response of each partner to the symbiotic association. P. arhizus proved to be more compatible with P. pinaster than P. involutus, since the antioxidant activity in the latter species increased from 48 to 72 h, while P. arhizus antioxidant properties decreased at the same period (indicative of less oxidative stress). Despite P. involutus proved to be less suitable to be included in forestation programs using mycorrhization processes, it revealed a higher potential for bioactive compounds production in the early steps of symbiosis. A maximal value of phenolics content was obtained after the first 6 h.
3 1. Introduction
Mycorrhiza absorbs mineral nutrients from soil and transports them to the root, while the plant provides photoassimilates, which are utilized by the fungus to grow and extend its mycelium to colonize the soil. Ectomycorrhizal (ECM) fungi are capable of infecting several arboreous species; thus, this symbiosis is widespread in both temperate and boreal forests and has been proposed to enhance significantly forest production. Ectomycorrhized plants survive better in adverse environmental conditions such as marginal soils, drought, pathogen attack, extreme pH and temperatures and other types of stress (Rodríguez-Tovar et al., 2005).
The basidiomycete Pisolithus arhizus is an almost ubiquitous ECM fungus, able to establish successful symbiosis with a wide range of plants (Marx, 1977), and it has been used as a model system for the analysis of ectomycorrhizal symbiotic interactions (Rodríguez-Tovar et al., 2005). Paxillus involutus is one of the most well-studied ECM fungi. The fungus is widespread in the Northern hemisphere and forms ECM with numerous coniferous and deciduous tree species (Wallander and Söderström, 1999). The unusually broad host range, relatively fast-growing mycelium, and rapid colonization of roots can explain why P. involutus is one of the most commonly used ECM fungi in laboratory experiments (Hedhi et al., 2008).
dismutase, catalase and peroxidase; Münzenberger et al., 1997; Baptista et al., 2007) or phenolic compounds, might increase in plant roots and/or mycelia (Münzenberger et al., 1995; Reis et al., 2011).
In previous works, mechanisms of symbiosis between ECM fungi (Pisolithus arhizus
and Paxillus involutus) and a specific host plant (Pinus pinaster) were studied in vitro
trough a long term mycorrhizal induction assay (48 h, 45 days). P. arhizus seemed to be more compatible with P. pinaster than P. involutus, since the antioxidant activity in the latter species increased after a 48 h period, while P. arhizus remained unaffected (Reis et al., 2011; Reis et al., 2012). The present study aimed to evaluate the effects of
co-culture period in the antioxidant properties and antioxidants (phenolics, tocopherols and sugars) production during early steps of in vitro mycorrhization: 0, 6 and 24 h. An additional period of 72 h was also studied in order to understand if the chemical response followed up the same trend detected in the earlier periods. Furthermore, these parameters were determined in each culture element (root, mycelium and medium) in order to understand the response of each partner to the symbiotic association.
The obtained results will be discussed in two perspectives: interest in reforestation programs (Stenström et al., 1997) taking advantage on the compatibility between fungus and host plant; or interest in production of bioactive compounds (Ferreira et al., 2009) taking advantage on different compatibilities among plant and fungus that induce a higher production of antioxidant molecules.
2. Materials and methods
5 Mycelia of Paxillus involutus (Batsch) Fr. and Pisolithus arhizus (Scop.) Rauschert were isolated from sporocarps (Figure 1A,B; collected in Bragança, Portugal) on solid Melin-Norkans medium (MMN) pH 6.6 (NaCl 0.025 g/l; (NH4)2HPO4 0.25 g/l; KH2PO4
0.50 g/l; FeCl3 0.0050 g/l; CaCl2 0.050 g/l; MgSO4.7H2O 0.15 g/l; thiamine 0.10 g/l;
glucose 10 g/l; casamino acids 1.00 g/l, malt 5.00 g/l and agar 20 g/l in tap water) (Marx, 1969). The strains were maintained in Petri dishes (9 cm diameter) containing the same medium at 25ºC in the dark and subcultured every 4 weeks (Figure 1C,D). Both mycelium and culture medium were weighted separately to obtain the fresh biomass (fw).
Pinus pinaster (Aiton) seeds (obtained in CENASEF, Centro Nacional das Sementes Florestais, Portugal) were sterilized with sodium hypochloride 5% and two drops of tween® 80 under agitation for 15 min (Harvengt, 2005). After washes with sterilized water, the seeds were poured in ethanol 80% for 15 min, washed again with sterilized water, and finally poured in test tubes (3 cm diameter) with agar:water 0.8%. To induce germination, the tubes were kept in the dark at 25ºC for 48 h, and then exposed to light for day and night photoperiods (16 h/8 h), respectively, in a culture chamber (Gro-Lux, Sylvania) with Daylight lamps (Phillips, Amsterdam, Netherlands) (Figure 1E,F).
2.2. Induction of the mycorrhizal symbiosis
Fungi mycelium was cultured in Petri dishes (12 cm diameter) with incomplete MMN (without malt and casamino acids) in slant and maintained for 20 days in the dark. Three
The part of the Petri dish where the plant roots were in contact with fungi was protected from light with aluminium paper, in order to mimetize the natural conditions of mycorrhizas development. After 0, 6, 24 and 72 h of growth, mycelium and plant root were recovered from the medium. Mycelium, plant and culture medium were weighted separately to obtain the fresh biomass (fw), and then stored at –40ºC for further analyses. All the samples were lyophilised (FreeZone 4.5 model 7750031, Labconco, Kansas, USA) to obtain the dry biomass (dw) and further reduced to a fine dried powder (20 mesh).
2.3. Standards and reagents
Acetonitrile 99.9%, n-hexane 95%, ethyl acetate 99.8% and methanol were of HPLC grade from Fisher Scientific (Loures, Portugal). The standards sugars (D-fructose 98%, D-glucose, D-sucrose 99.0%, D-mannitol 98% and D-trehalose di-hydrate 99.5%), tocopherols (α-, β-, δ-, and γ-isoforms), and trolox
(6-hydroxy-2,5,7,8-tetramethylchroman-2-carboxylic acid) were purchased from Sigma (St. Louis, MO, USA). Racemic tocol 50 mg/mL, was purchased from Matreya (PA, USA). 2,2-Diphenyl-1-picrylhydrazyl (DPPH) was obtained from Alfa Aesar (Ward Hill, MA, USA). All other chemicals and solvents were of analytical grade and purchased from common sources. Water was treated in a Milli-Q water purification system (TGI Pure Water Systems, USA).
2.4. Evaluation of antioxidant activity
7 Each sample (~0.4 g for mycelia and plants; 4 g for culture media) was extracted by stirring with 30 ml of methanol (25ºC at 150 rpm) for 1 h and subsequently filtered through Whatman No. 4 paper. The residue was then extracted once more under the same conditions. The combined methanolic extracts were evaporated at 40ºC (rotary evaporator Büchi R-210; Flawil, Switzerland) to dryness, and redissolved in methanol.
In vitro assays already described by the authors (Barros et al., 2010) were used to evaluate the antioxidant activity of the samples.
2.4.2. DPPH radical-scavenging activity
This assay was performed in 96-well microtiter plates using an ELX800 Microplate Reader (Bio-Tek Instruments, Inc, Winooski, USA). The reaction mixture in each of the 96-wells of the plate consisted of one of the different concentrations of the extracts (30
µl) and methanolic solution containing DPPH radicals (6×10⁻⁵ mol/l, 270 µl). The
mixture was left to stand for 30 min in the dark. The reduction of the DPPH radical was determined by measuring the absorption at 515 nm. The radical scavenging activity (RSA) was calculated as a percentage of DPPH discolouration using the equation: %
RSA = [(ADPPH-AS)/ADPPH] × 100, where AS is the absorbance of the solution when the
sample extract has been added at a particular level, and ADPPH is the absorbance of the
DPPH solution. The extract concentration providing 50% of radicals scavenging activity (EC50) was calculated from the graph of RSA percentage against extract concentration.
Trolox was used as standard.
This assay was also performed using microtiter plates and the Microplate Reader described above. Different concentrations of the extracts (0.5 ml) were mixed with sodium phosphate buffer (200 mmol/l, pH 6.6, 0.5 ml) and potassium ferricyanide (1% w/v, 0.5 ml). The mixture was incubated at 50ºC for 20 min, and trichloroacetic acid (10% w/v, 0.5 ml) was added. The mixture (0.8 ml) was poured into the wells of a 48-well microplate, as also deionised water (0.8 ml) and ferric chloride (0.1% w/v, 0.16 ml), and the absorbance was measured at 690 nm. The extract concentration providing 0.5 of absorbance (EC50) was calculated from the graph of absorbance at 690 nm against
extract concentration. Trolox was used as standard.
2.4.4. Inhibition of β-carotene bleaching
A solution of β-carotene was prepared by dissolving β-carotene (2 mg) in chloroform (10 ml). Two millilitres of this solution were pipetted into a round-bottom flask. The chloroform was removed at 40ºC under vacuum and linoleic acid (40 mg), Tween 80 emulsifier (400 mg), and distilled water (100 ml) were added to the flask with vigorous shaking. Aliquots (4.8 ml) of this emulsion were transferred into test tubes containing different concentrations of the extracts (0.2 ml). The tubes were shaken and incubated at 50ºC in a water bath. As soon as the emulsion was added to each tube, the zero time absorbance was measured at 470 nm (Analytikjena 200 spectrophotometer, Jena, Germany). β-Carotene bleaching inhibition was calculated using the following equation:
(β-carotene content after 2h of assay/initial β-carotene content) × 100. The extract
9 from the graph of β-carotene bleaching inhibition percentage against extract concentration. Trolox was used as standard.
2.4.5. Inhibition of lipid peroxidation using thiobarbituric acid reactive substances
(TBARS)
Porcine (Sus scrofa) brains were obtained from official slaughtering animals, dissected, and homogenized with a Polytron in ice cold Tris-HCl buffer (20 mM, pH 7.4) to produce a 1:2 w/v brain tissue homogenate which was centrifuged at 3000g for10 min. An aliquot (0.1 ml) of the supernatant was incubated with the different concentrations of the samples solutions (0.2 ml) in the presence of FeSO4 (10 mM; 0.1 ml) and ascorbic
acid (0.1 mM; 0.1 ml) at 37 ºC for 1 h. The reaction was stopped by the addition of trichloro acetic acid (28% w/v, 0.5 ml), followed by thiobarbituric acid (TBA,2%, w/v, 0.38 ml), and the mixture was then heated at 80 ºC for 20 min. After centrifugation at 3000g for 10 min to remove the precipitated protein, the colour intensity of the malondialdehyde (MDA)-TBA complex in the supernatant was measured by its absorbance at 532 nm. The inhibition ratio (%) was calculated using the following formula: Inhibition ratio (%) = [(A - B)/A] × 100%, where A and B were the absorbance of the control and the sample solution, respectively.
2.5. Determination of antioxidant compounds
2.5.1. Total phenolics
development. Absorbance was then measured at 765 nm. Gallic acid was used to calculate the standard curve (0.0094 – 0.15 mg/ml), and the results were expressed as mg of gallic acid equivalents (GAEs) per g of extract.
2.5.2. Tocopherols
Tocopherols content was determined following a procedure previously optimized and described by Barros et al. (2008),using tocol as internal standard. The HPLC equipment consisted of an integrated system with a Smartline 1000 pump (Knauer, Berlin, Germany), a Smartline manager 5000 degasser, an AS-2057 auto-sampler (Jasco, Easton, MD) and a FP-2020 fluorescence detector (Jasco, Easton, MD) programmed for excitation at 290 nm and emission at 330 nm.. Data were analysed using Clarity 2.4
Software (DataApex). The column used was a normal-phase 250 mm × 4.6 mm i.d., 5
µm, Polyamide II, with a 10 mm × 4 mm i.d. guard column of the same material (YMC
Waters, Dinslaken, Germany), operating at 30ºC. The mobile phase used was a mixture of n-hexane and ethyl acetate (70:30, v/v) at a flow rate of 1 ml/min. Tocopherols identification was made by comparing the relative retention times of sample peaks with standards. Quantification was based on the fluorescence signal response, using the internal standard method, and the results were expressed in mg per g of dry weight (dw).
2.5.3. Soluble sugars
11 system described above was connected to a Smartline 2300 refraction index (RI) detector (Knauer). Data were analysed using Clarity 2.4 Software (DataApex). The chromatographic separation was achieved with a Eurospher 100-5 NH2 column (4.6 ×
250 mm, 5 mm, Knauer) operating at 30ºC. The mobile phase was acetonitrile/deionized water, 70:30 (v/v) at a flow rate of 1 ml/min. Sugars identification was made by comparing the relative retention times of sample peaks with standards. Quantification was made by the internal standard method and the results were expressed in g per 100 g of dry weight (dw).
2.6. Statistical analysis
An analysis of variance (ANOVA) with Type III sums of squares was performed using the GLM (General Linear Model) procedure of the SPSS software, version 18.0 (SPSS, Inc.). All dependent variables were analyzed using a 2-way ANOVA, being the main factors the “culture element” (Pinus pinaster root, mycelium and culture medium) and the “co-culture period” (0, 6, 24 and 72 h). Since a statistical significant interaction effect (“culture element×co-culture period”) was found in all tests, the two factors were
selected remain significant (Rencher, 1995; Maroco, 2003; López et al., 2008). With this approach, it is possible to identify the significant variables among the antioxidant activity, and phenolics, sugars and tocopherols profiles obtained for each sample. To verify which canonical discriminant functions were significant, the Wilks’ λ test was applied. To avoid overoptimistic data modulation, a leaving-one-out cross-validation procedure was carried out to assess the model performance. The LDA statistical analysis and the other statistical tests were performed at a 5% significance level using the SPSS software mentioned above.
3. Results and discussion
In a previous work of our research group, symbiotic associations were studied after different co-culture periods, 45 days and 48 h (Reis et al., 2012), revealing different responses depending on the used fungi. P. arhizus seemed to be more compatible with
P. pinaster than P. involutus, since the antioxidant activity in the latter species increased after a 48 h period, while P. arhizus remained unaffected (Reis et al., 2011; Reis et al., 2012). Nevertheless, the mechanisms of antioxidants production are still unknown and,
therefore, the present study was conducted during early steps of in vitro mycorrhization: 0, 6 and 24 h. If the antioxidant activity increases in the earlier stages, this might indicate a response mechanism resulting from higher oxidative stress levels while the host plant does not recognize the fungus as a friendly species. An additional period of 72 h was also studied in order to understand if the chemical response followed up the same trend detected in the earlier periods.
13 and therefore a low production of secondary metabolites. In this case, the fungi might be a good choice to join with the plant for reforestation programs. On the other hand, if the compatibility is low, the oxidative stress will peak at some stage, and the production of metabolites will be very high, making the association interesting to purify the antioxidants produced; in this case, it would be important to define the most suitable time to stop the co-culture in order to maximize the bioactive compound yield. Otherwise, if the fungus does not cause a significant reaction by the host, this could be interpreted as a compatibility indicator with interest in reforestation programs.
Antioxidant activity EC50 values and phenolic (Table 1), tocopherols (Table 2) and
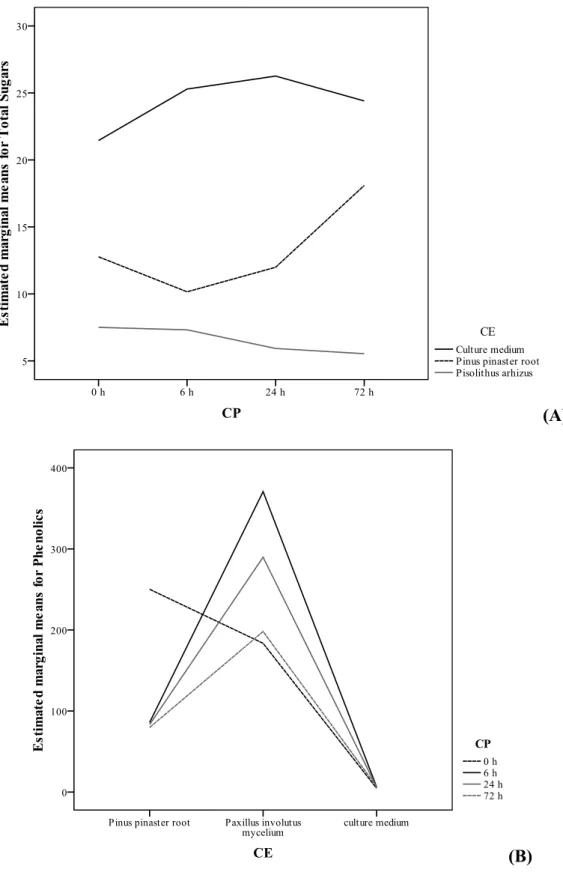
sugars (Table 3) contents are reported as mean value of each culture element (CE) over the different co-culture periods (CP) as well as mean value of all elements within each co-culture period. The presentation of the results in this form is more adequate to evaluate the effects of both factors (CE and CP) independently of each other, thus avoiding interaction based outcomes. The results show that the interaction CP×CE was
a significant (p < 0.001) source of variation for all the evaluated parameters. Hence, although the least squares means are presented for the main effects, no multiple comparisons were performed. Furthermore, both main factors (CP and CE) showed a significant effect (p < 0.001). However, from the analysis of the plots of the estimated margins means (data shown only in specific cases), for each variable, some general conclusions can be acquired.
For instance, in P. arhizus-P. pinaster co-culture, the antioxidant activity remained nearly constant in P. pinaster root, while P. arhizus mycelium showed a significant decrease (increase of EC50 values) for the 72 h period, after keeping similar values in
for the mycelium, except for β-carotene bleaching assay. This outcome might indicate that after an initial physiological adaptation period, reflected by slight changes in the antioxidant activity, at 72 h the plant had already recognized the fungus as non-pathogenic. As it is only evident in plots of the estimated margins means (data not shown) and not in table 1, it should be clarified that these differences were mainly related with the culture medium.
For P. involutus-P. pinaster co-culture, the EC50 values obtained for DPPH scavenging
activity and reducing power assays were lower (mainly in the culture medium) than the obtained with the other fungi (Table 1), which is in agreement with the reported by Reis et al. (2011, 2012) and with its higher phenolic content (Table 1). Despite some
similarities in the antioxidant activities obtained in each mycorrhization, there are some particular results which may define some compatibility differentiation. For instance, while the EC50 values tended to increase from 24 to 72 h in P. arhizus (except for
15 Regarding tocopherols, α- and δ-tocopherol were higher in P. pinaster root, while
γ-tocopherol was the prevalent vitamer in the mycelia for both co-cultures, but presenting higher values in P. arhizus (Figure 2A, Table 2). An interesting finding is related with the high variation along CP of α- and δ-tocopherol in the P. arhizus-P. pinaster co-culture (Table 2), while in the P. involutus-P. pinaster co-culture, only δ-tocopherol showed a significant decrease along CP, indicating that the metabolic dynamics of vitamin E might be affected by the symbiont species. In general, total tocopherols did not vary in the culture medium for both mycorrhizations but although P. pinaster root was the element with higher tocopherols content in the P. involutus-P. pinaster co-culture, the mycelium was the element with higher content of this vitamin in the P. arhizus-P. pinaster co-culture (Table 2).
decrease. The P. pinaster-P. arhizus co-culture elements presented higher sugars values, mainly based on the results obtained for fructose and trehalose (Table 3).
In general, there was a dual constancy among the assayed parameters. The antioxidant activity remained quite similar in P. pinaster root and in each one of the mycelia used in
both co-cultures, while tocopherols (except γ-tocopherol) contents showed high
similarities among culture medium and mycelia. This tendency could not be observed regarding sugars contents, an observation that might indicate that the differences in the chemical responses that characterize each mycorrhization might be related more directly with sugar (primary metabolites) exchanges.
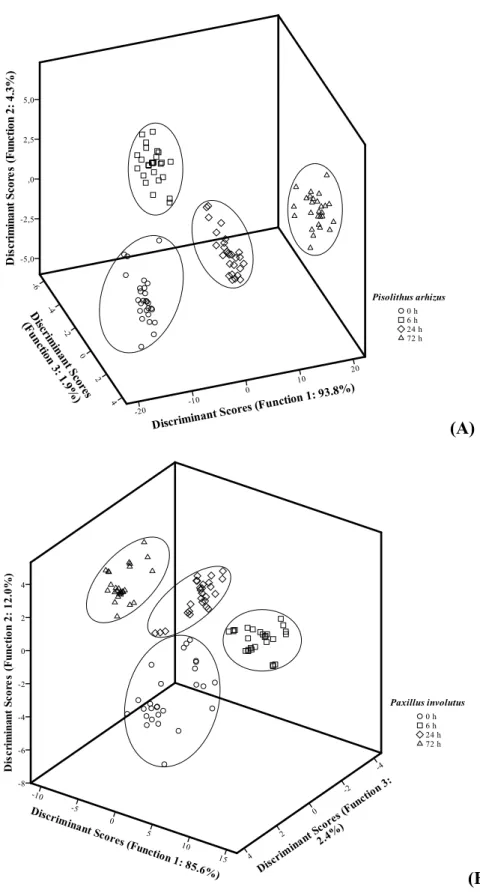
In order to better understand the time induced differences, as well as the differences among each one of the co-culture elements, a linear discriminant analysis (LDA) was applied. The differences induced by the co-culture period for the mycorrhization with
P. pinaster are well observed in this analysis, in which four clusters (corresponding to the four assayed periods) were clearly individualized (Figure 4A). In this case, all the assayed parameters (antioxidant activity assays EC50 values, phenolics, tocopherols and
sugars contents) were used, resulting in a discriminant model with three significant (p < 0.001 for the Wilks’ λ test) discriminant functions. These three functions explained 100.0% of the variance of the experimental data (the first explained 93.8%, the second 4.3% and the third 1.9%) (Figure 4A). The model showed a very satisfactory classification performance allowing to correctly classifying 100.0% of the samples for the original groups and 99.1% for the cross-validation procedure.
17 100.0% of the variance of the experimental data (the first explained 85.6%, the second 12% and the third 2.4%) (Figure 4B). The model showed a very satisfactory classification performance allowing to correctly classifying 98.1% of the samples for the original groups and 96.3% for the cross-validation procedure.
Regarding the co-culture elements, there seemed to be an apparent similarity along time, especially in the antioxidant properties, in both assayed co-cultures, indicating that the symbiosis did not affect the antioxidant properties of the studied species. However, the LDA results indicated that the slight differences found among those two elements are sufficient to discriminate them in two separate groups, either for P. arhizus (Figure 5A), as for P. involutus. In both cases, the LDA defined two significant (p < 0.001 for the Wilks’ λ test) functions which explained 100.0% of the variance of the experimental data. The model showed a very satisfactory classification performance allowing to correctly classifying 90.7% of the samples for the original groups as well as of the cross-validation procedure for P. involutus. A similar result was obtained when the analysis was performed using tocopherols (91.7% of the samples for the original groups as well as of the cross-validation procedure were correctly classified) and sugars (Figure 5B) (100.0% of the samples for the original groups as well as of the cross-validation procedure were correctly classified). For P. arhizus 100.0% of the samples for the original groups as well as of the cross-validation procedure were correctly classified using antioxidant activity EC50 values, tocopherols or sugars.
antioxidant properties decreased at the same period (indicative of less oxidative stress). Despite P. involutus proved to be less suitable to be included in forestation programs using mycorrhization processes, it revealed a higher potential of bioactive compounds production in the early steps of symbiosis. In fact, a maximal value of phenolics content was obtained after the first 6 h (Figure 3B) and, therefore, considering bioactive compounds production purposes, the co-culture should be stopped at that time.
Acknowledgements
The authors are grateful to Fundação para a Ciência e a Tecnologia (FCT, Portugal) and COMPETE/QREN/EU for financial support to this work (research project PTDC/AGR-ALI/110062/2009) and to CIMO (strategic project PEst-OE/AGR/UI0690/2011). L. Barros and J.C.M. Barreira thank to FCT, POPH-QREN and FSE for their grants (SFRH/BPD/4609/2008 and SFRH/BPD/72802/2010, respectively).
References
Baptista, P., Martins, A., Pais, M.S., Tavares, R.M., Lino-Neto, T. 2007. Involvement of reactive oxygen species during early stages of ectomycorrhiza establishment between
Castanea sativa and Pisolithus tinctorius. Mycorrhiza 17, 185–193.
Barros, L., Correia, D.M., Ferreira, I.C.F.R., Baptista, P., Santos-Buelga, C. 2008. Optimization of the determination of tocopherols in Agaricus sp. edible mushrooms by a normal phase liquid chromatographic method. Food Chem. 4, 1046-1050.
19 Ferreira, I.C.F.R., Barros, L., Abreu, R.M.V. 2009. Antioxidants in wild mushrooms.
Curr. Med. Chem. 16, 1543-1560.
Harvengt, L. 2005. Somatic embryogenesis in maritime pine (Pinus pinaster Ait). Foresty Sci. 77, 107-119.
Hedhi, J., Samson, P., Erland, S., Tunlid, A. 2008. Multiple gene genealogies and species recognition in the ectomycorrhizal fungus Paxillus involutus. Mycol. Res. 112, 965-975.
Heleno, S.A., Barros, L., Sousa, M.J., Martins, A., Ferreira, I.C.F.R. 2009. Study and characterization of selected nutrients in wild mushrooms from Portugal by gas chromatography and high performance liquid chromatography. Microchem. J. 93, 195-199.
Lamb, C, Dixon, R.A. 1997. The oxidative burst in plant disease resistance. Annu. Rev. Plant Physiol. Plant Mol. Biol. 48, 251–275.
López, A., García, P., Garrido, A. 2008. Multivariate characterization of table olives according to their mineral nutrient composition, Food Chem. 106, 369-378.
Maroco, J. 2003. Análise Estatística, com utilização do SPSS, Edições Sílabo, Lisboa, Portugal.
Marx, D.H. 1969. The influence of ectotrophic fungi on the resistance of pine root to pathogenic infections. I. Antagonism of mycorrhizal fungi to root pathogenic fungi and soil bacteria. Phytopathol. 59, 153–163.
Marx, D.H. 1977. Tree host range and world distribution of the ectomycorrhizal fungus
Pisolithus tinctorius. Can. J. Microbiol. 23, 217– 223.
Münzenberger, B., Otter, T., Wüstrich, D., Polle, A. 1997. Peroxidase and laccase activities in mycorrhizal and non-mycorrhizal fine roots of Norway spruce (Picea abies) and larch (Larix decidua). Can. J. Bot. 78, 932–938.
Reis, F.S., Ferreira, I.C.F.R., Barros, L., Santos-Buelga, C., Martins, A. 2011. Mycorrhizal induction of phenolic compounds and antioxidant properties of fungi and seedlings during the early steps of symbiosis. Chemoecology 21, 151-159.
Reis, F.S., Ferreira, I.C.F.R., Martins, A. 2012. Effect of the mycorrhizal symbiosis time in the antioxidant activity of fungi and Pinus pinaster roots, stems and leaves. Ind. Crops Prod. 35, 211-216.
Rencher, A.C. 1995. Methods of Multivariate Analysis, John Willey, New York.
Rodríguez-Tovara, A.V., Ruiz-Medrano, R., Herrera-Martíneza, A., Barrera-Figueroa, B.E., Hidalgo-Lara, M.E., Reyes-Márquez, B.E., Cabrera-Ponce, J.L., Valdés, M., Xoconostle-Cázares, B. 2005. Stable genetic transformation of the ectomycorrhizal fungus Pisolithus tinctorius. J. Microbiol. Method. 63, 45-54.
Stenström, E., Damm, E., Unestam, T. 1997. Le rôle des mycorrhizes dans la protection des arbres forestiers contre les agents pathogènes du sol. Rev. For Fr. 121- 128. Wallander, H., Söderström, B. 1999. Paxillus. In: Cairney, J.W.G., Chambers, S.M.
21 Table 1. Antioxidant activity EC50 values (mg/ml) and phenolic content (mg GAE/g
extract) obtained for the culture elements (CE). The results are presented as mean±SDa (n=27, for each co-culture period (CP); n=36 for each culture element).
DPPH scavenging activity Reducing power β-Carotene bleaching inhibition TBARS assay Phenolics Pisolithus arhizus CP
0 h 27±38 8±11 1±1 0.1±0.2 148±107
6 h 37±52 10±14 3±4 1±1 107±90
24 h 16±23 5±7 11±15 2±3 82±60
72 h 29±41 35±50 1.0±0.5 3±4 99±77
p-value <0.001 <0.001 <0.001 <0.001 <0.001
CE
Root 0.2±0.1 0.13±0.03 0.7±0.3 0.1±0.1 199±42 Mycelium 1.0±0.3 0.8±0.1 0.5±0.2 0.06±0.04 125±38
Medium 80±22 43±37 11±12 4±4 3±1
p-value <0.001 <0.001 <0.001 <0.001 <0.001 CP×CE p-value <0.001 <0.001 <0.001 <0.001 <0.001
Paxillus involutus
CP
0 h 3±4 3±4 2±3 3±5 146±106
6 h 5±6 7±10 3±3 4±6 154±160
24 h 3±3 3±4 2±3 4±5 126±122
72 h 3±3 2±3 3±3 8±11 95±81
p-value <0.001 <0.001 <0.001 <0.001 <0.001
CE
Root 0.6±0.3 0.3±0.2 0.8±0.5 0.01±0.01 125±74 Mycelium 0.4±0.2 0.18±0.05 0.4±0.3 0.1±0.1 261±78
Medium 9±3 11±5 7±1 14±6 6±1
a
23 Table 2. Tocopherols content (mg/100 g dw) in the culture elements (CE). The results are presented as mean±SDa (n=27, for each co-culture period (CP); n=36 for each culture element).
α-Tocopherol β-Tocopherol γ-Tocopherol δ-Tocopherol Total tocopherols
Pisolithus arhizus
CP
0 h 1±2 0.1±0.1 15±20 9±12 25±18
6 h 1±1 0.06±0.04 10±13 1±1 11±12
24 h 1±1 0.05±0.03 12±17 1±2 14±16
72 h 9±12 0.4±0.5 15±21 3±4 27±19
p-value <0.001 <0.001 <0.001 <0.001 0.001
CE
Root 8±10 0.3±0.5 0.3±0.2 10±10 19±15
Mycelium 0.2±0.2 0.1±0.1 38±7 0.05±0.05 38±7
Medium 0.03±0.04 0.06±0.02 0.5±0.3 0.2±0.3 0.7±0.5
p-value <0.001 <0.001 <0.001 <0.001 <0.001 CP × CE p-value <0.001 <0.001 <0.001 <0.001 <0.001
Paxillus involutus
CP
0 h 1±2 0.02±0.03 0.5±0.1 9±12 11±15
6 h 1±1 nd 0.6±0.5 2±2 3±3
24 h 1±1 0.01±0.01 0.9±0.4 1±2 3±2
72 h 1±1 0.01±0.01 1±1 1±2 3±2
p-value <0.001 <0.001 <0.001 <0.001 0.001
CE
Root 2±1 0.01±0.02 0.5±0.1 10±10 12±11
Mycelium 0.004±0.001 0.01±0.01 1.3±0.5 0.03±0.02 1.4±0.5
Medium nd nd 0.3±0.3 nd 0.3±0.3
a
25 Table 3. Sugars content (g/100 g dw) in the culture elements (CE). The results are presented as mean±SDa (n=27, for each co-culture period (CP); n=36 for each culture element).
Fructose Glucose Mannitol Sucrose Trehalose Total sugars
Pisolithus arhizus
CP
0 h 1±2 10±8 0.3±0.4 1±1 2±2 14±6
6 h 1±2 11±10 0.2±0.2 1±1 1±2 14±8
24 h 2±2 11±11 0.3±0.4 1±1 1±1 15±9
72 h 3±4 11±10 0.1±0.2 1±1 1±2 16±8
p-value <0.001 <0.001 <0.001 <0.001 <0.001 <0.001
CE
Root 5±2 5±1 0.6±0.2 1.9±0.3 nd 13±3
Mycelium nd 2.7±0.5 nd nd 4±1 7±1
Medium nd 24±2 nd nd nd 24±2
p-value <0.001 <0.001 <0.001 <0.001 <0.001 <0.001 CP × CE p-value <0.011 <0.001 <0.001 <0.001 <0.001 <0.001
Paxillus involutus
CP
0 h 1±2 11±11 0.5±0.4 1±1 0.2±0.3 14±10
6 h 0.03±0.05 9±12 0.3±0.4 0.1±0.1 0.3±0.4 10±12 24 h 0.04±0.06 10±13 0.3±0.4 0.1±0.1 0.1±0.1 10±13 72 h 0.05±0.07 9±13 0.3±0.4 0.2±0.3 0.1±0.1 10±12
p-value <0.001 <0.001 <0.001 <0.001 <0.001 <0.001
CE
Root 1±1 2±3 0.3±0.3 1±1 0.06±0.04 4±5
Mycelium nd 0.5±0.1 0.8±0.1 nd 0.5±0.3 1.8±0.3
Medium nd 27±1 nd nd nd 27±1
a
27 Figure 1. A. Paxillus involutus fruiting body; B. Pisolithus arhizus fruiting body; C.
under germination; F. Pinus pinaster seedlings; G - Paxillus involutus mycelium-Pinus pinaster seedlings mycorrhizal induction in vitro; H. Pisolithus arhizus mycelium-
29 (A)
(B)
Figure 2. A. Tocopherols profile of Pisolithus arhizus (-) and Paxillus involutus (--) mycelium in co-culture with Pinus pinaster root for 24 h (1- α-tocopherol; 2- BHT; 3-
β-tocopherol; 4- γ-tocopherol; 5- δ-tocopherol; 6- IS). B. Sugars profile of Pisolithus arhizus (-) and Paxillus involutus (--) mycelium in co-culture with Pinus pinaster root for 72 h (1- glucose; 2- mannitol; 3- trehalose; 4- IS).
Time (min)
0 5 10 15 20
V ol ta ge ( V ) 0.0 0.5 1.0 1.5 1 3 4 5 6 2 Time (min)
0 2 4 6 8 10 12
(A)
(B)
31 (A)
(B)
(A)
33