ESTIMATION OF EUCALYPTUS TREE HEIGHT IN CLONAL AND PROGENY
TESTS USING ARTIFICIAL NEURAL NETWORKS
1Ana Carolina de Albuquerque Santos2*, Filipe Monteiro Almeida3, Ramon Barreto Souza3, Raul Chaves4,
Haroldo Nogueira de Paiva5, Daniel Henrique Breda Binot6, Helio Garcia Leite5 and Aline Araújo Farias2
1 Received on 18.04.2016 accepted for publication on 28.06.2017.
2 Universidade Federal de Viçosa, Programa de Pós-Graduação em Ciências Florestal, Viçosa, Minas Gerais – Brasil. E-mail:
<anaflorestaufv@gmail.com> and <araujo.91@hotmail.com>.
3 Universidade Federal de Viçosa, Graduado em Engenharia Florestal, Viçosa, Minas Gerais – Brasil. E-mail: <ra.barreto.so@gmail.com>
and <filipema@gmail.com>.
4 Duratex, Agudos, São Paulo – Brasil. E-mail: <raul.chaves@duratex.com.br>.
5 Universidade Federal de Viçosa, Departamento de Engenharia Florestal, Viçosa, Minas Gerais – Brasil. E-mail: <hnpaiva@ufv.br>
and <hgleite@ufv.br>.
6 Universidade Federal de Viçosa, Doutor em Ciência Florestal, Viçosa, Minas Gerais – Brasil. E-mail: <danielhbbinoti@gmail.com>.
*Corresponding author.
ABSTRACT – The goal of this study was to test the applicability of artificial neural networks for estimating tree heights in clonal tests and progenies. We used data from 8,329 clonal tests collected for six age groups, divided into six blocks and five repetitions. For the progeny tests, we used 36,793 data points, collected at age 5 and divided into ten blocks and five repetitions. The categorical input variables considered were age, treatment, and block. The diameter (dap) was used with continuous input variables. For training the networks, we used two samples. Sub-sample 1 was composed of the first tree of each block. In sub-sample 2, the tree was selected randomly within each block. This selection was made in both tests. The selected data were separated, with 70% used for training and 30% used for validation. The other unselected trees were used for generalization. For each age and treatment, we used the Kolmogorov–Smirnov (KS) test to verify the normality of the errors. The results show that ANNs can be used to estimate the heights of trees subjected to various experimental plot treatments, with no loss of accuracy or estimation precision.
Keywords: Cost; Prediction; Experiment.
ESTIMAÇÃO DA ALTURA DE ÁRVORES DE EUCALIPTO EM TESTES
CLONAIS E DE PROGÊNIES UTILIZANDO REDES NEURAIS ARTIFICIAIS
RESUMO – O objetivo deste trabalho foi testar a aplicabilidade das redes neurais artificiais na estimação da altura em testes clonais e de progênies de eucalipto. Foram utilizados 8.329 dados de teste clonal, coletados em seis idades, divididos em 6 blocos e 5 repetições, e 36.793 dados para o teste de progênie, coletados em 5 idades e divididos em 10 blocos e 5 repetições. As variáveis categóricas de entrada foram a idade, o genótipo e o bloco. O diâmetro (dap) foi utilizado com variável de entrada contínua. Para definição dos dados para treinamento das redes foram utilizadas duas sub-amostras: a sub-amostra 1, composta pela primeira árvore de cada bloco e a sub-amostra 2, uma árvore foi selecionada aleatoriamente dentro de cada bloco. Essa seleção foi feita para os testes clonal e de progênies. Os dados selecionados foram separados em 70% para treinamento e 30% para a validação. As demais árvores, que não faziam parte das duas sub-amostras, foram utilizadas para a generalização. Para cada idade e tratamento foi calculado o teste kolmogorov -Smirnov (K-S) afim de verificar a normalidade dos resíduos. Os resultados demonstram que as redes podem ser usadas na estimação da altura das árvores dos diferentes genótipos presentes nos testes clonais e de progênies, sem perda da exatidão e significativa redução de custo de medição dos experimentos.
1. INTRODUCTION
The evaluation of progenies and clones is the most time consuming and costly stage of forest improvement. Planning the experiments involves processes such as defining their design, location, number of families, number of blocks, data to be collected, and analysis methods (Ramalho et al., 2005). For plants with long productive cycles, such as eucalyptus, this evaluation should be done as efficiently as possible, because erroneous inferences could lead to the loss of years of work. According to Reis et al. (2011), these tests help in the formation of more homogenous and more productive stands.
Clonal tests are conducted in the last stage of forest improvement, with the selected genotypes being planted on a commercial scale or in pilot tests (Araujo et al., 2015). In these tests, the heights of all trees that make up the useful area of the plots are measured (Santos et al., 2006). Likewise, in progeny tests, the heights of all trees are measured. When several measurements are taken, it results in a relatively large number of heights measured along a rotation. These heights are used both in early selection (Pinto et al., 2014), and selections made at the end of the experiment (Santos et al., 2006), usually close to the regulatory rotation used by the company.
In a forest inventory, instead of measuring the heights of all trees in a plot, hypsometric relationships are used. The models are adjusted using data for the measured heights and diameters of some trees present in the plots. The resulting equations are applied to the other trees (Campos and Leite, 2013).
An alternative approach for modeling hypsometric relationships involves the application of artificial neural networks (ANNs). Binoti et al. (2012) trained an ANN for different percentages of height measurement reductions in a plot, verifying the possibility of measuring the height of only 10% of the trees in the inventory plots without losing precision in the estimates. Other studies have demonstrated the efficiency of using ANN for predicting tree heights in forest inventory plots (Binoti et al., 2013; Vendruscolo et al, 2015, Ozçelik et al., 2013), mapping natural forest biomass (Schoeninger et al., 2009), classifying satellite images (Andrade, 2003), estimating stem shapes (Schikowski et al, 2015), estimating the nutritional efficiency of eucalyptus leaves (Lafetá, 2012), and predicting growth and production (Alcântara, 2015), among other applications.
Based on the results obtained for inventory height estimation, it is possible to understand the importance of evaluating ANN efficiency for research experiments in which the number of tree heights measured annually is relatively high. Therefore, this study aimed to evaluate the efficiency of an ANN used to estimate tree heights in clonal and progeny tests, and how this method reduced time and costs relative to a method of measuring the heights of 100% of trees in experimental plots.
2. MATERIALS AND METHODS 2.1. Data Description
The data used in this study were obtained from clonal and progeny tests with eucalyptus (conducted by forest companies), involving a complete rotation of approximately six years.
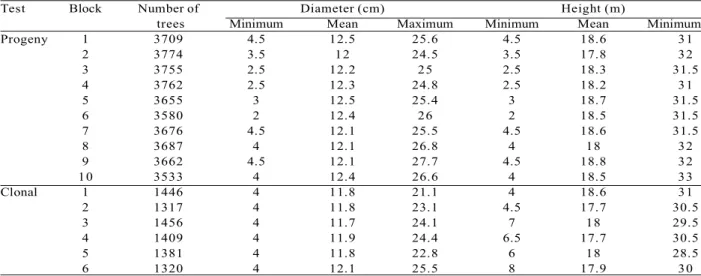
To train the networks to estimate heights in clonal tests, 114 treatments were used. Each treatment contained six blocks, for a total of 8,329 data points collected for six tree ages. For the progeny tests, 215 treatments were used as the basis for training the networks, each containing ten blocks, totaling 36,793 data distributed across five ages. Descriptive analyses for both tests are presented in Table 1.
2.2. Artificial neural networks:
To train and validate the ANN used for the clonal and progeny tests, a tree from each block was selected. In sub-sample 1, the first tree of the block was selected, while in sub-sample 2, a tree was selected randomly in each block. These sub-samples were separated, with 70% used for training and 30% used for network validation. The other unselected trees were used for ANN generalizations.
The trained networks were of the Multilayer Perceptrons (MLP) type, in which two layers (intermediate and output) process data, while only the input layer receives data (Haykin, 2001). The categorical variables used in the input layer were age, treatment, and block. We used dap as a continuous input variable.
3000, or average error equal to 0.0001. Numerical data were normalized on a 0 to 1 scale. These parameters were defined based on previous studies of the estimation of the height of eucalyptus trees in forest inventory plots (Silva, 2012).
Five networks were trained, and the best network was selected based on the following statistics, calculated for each set (training, validation, and generalization): correlation between observed heights and estimated correspondents (ryy), standard deviation of mean percentage error ( ), and histogram of residuals, calculated as follows:
Where
yi e y i = observed and estimated values of the variable under analysis;
ym e y= estimated and observed mean value;
n = number of cases; S2 = sample variance.
The histogram graphs for the training, validation, and generalization of the networks were analyzed, considering a range of class of 5%.
The chosen ANN was evaluated for each combination of age and treatment, based on the Kolmogorov-Smirnov (K–S) test for the normality of residuals. Training, validation and generalization estimates were grouped so that the treatments were complete in relation to the number of trees sampled. Because of the large number of treatments in both tests, the p-values were grouped in intervals, and the percentage of treatments with values higher than 0.05 was defined. Thus, the greater the number of treatments with residual normality, the more accurate the network was at estimating the tree heights for different treatments.
3.RESULTS
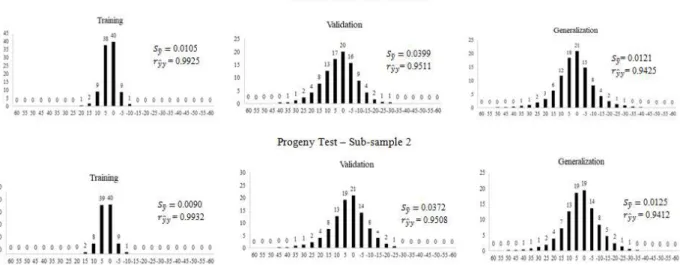
Considering the two sub-samples, most of the training estimate errors in both tests varied by an average of 5%, with a trend of non-normality in the residuals, as observed in the histogram graphs in Figures 1 and 2. The two methods of selecting trees within a block for training the network were compared, based on the generalization and normality statistics of the residuals for each treatment. Histogram plots for the ANN generalization estimates in the clonal test for sub-samples 1 and 2 showed 89% and 87% of residuals, ranging from an average of 10% (Figure 1) respectively. In the progeny test, 74% and 73% of the residuals obtained by estimates of the trained network generalization with sub-samples 1 and 2 varied by an average of 10%,
^ Sy_
Test Block Number of Diameter (cm) Height (m)
trees Minimum Mean Maximum Minimum Mean Minimum
Progeny 1 3709 4.5 12.5 25.6 4.5 18.6 31
2 3774 3.5 12 24.5 3.5 17.8 32
3 3755 2.5 12.2 25 2.5 18.3 31.5
4 3762 2.5 12.3 24.8 2.5 18.2 31
5 3655 3 12.5 25.4 3 18.7 31.5
6 3580 2 12.4 26 2 18.5 31.5
7 3676 4.5 12.1 25.5 4.5 18.6 31.5
8 3687 4 12.1 26.8 4 18 32
9 3662 4.5 12.1 27.7 4.5 18.8 32
10 3533 4 12.4 26.6 4 18.5 33
Clonal 1 1446 4 11.8 21.1 4 18.6 31
2 1317 4 11.8 23.1 4.5 17.7 30.5
3 1456 4 11.7 24.1 7 18 29.5
4 1409 4 11.9 24.4 6.5 17.7 30.5
5 1381 4 11.8 22.8 6 18 28.5
6 1320 4 12.1 25.5 8 17.9 30
Table 1 – Descriptive analysis of clonal and of progeny test data.
Tabela 1 – Análise descritiva dos dados de teste de progênies e clonal.
^
respectively (Figure 2). The validation estimates were similar to the generalizations in both tests and sub-samples (Figures 1 and 2).
Table 2 shows the p-values of the K–S test for verifying the normality of residuals for the combination of 1) age and treatment, and 2) sub-sample and test,
Figure 2 – Standard error, correlation between estimated and observed values, and histogram graphics generated with estimated data in the training, validation, and generalization of the progeny test with sub-samples 1 and 2. X-axis shows the residue classes by percentage, y-axis shows the observed frequencies for each class.
Figura 2 – Erro padrão, correlação entre os valores estimados e observados e gráficos de histograma das estimativas geradas pela RNA no treinamento, validação e generalização do teste de progênie com as sub-amostras 1 e 2. No eixo x dos gráficos de histograma são apresentadas as classes de resíduo em %, no eixo y as frequências observadas em cada classe.
Figure 1 – Standard error, correlation between estimated and observed values, and histogram graphics generated with estimated data in the training, validation and generalization of the clonal test with sub-samples 1 and 2. X-axis shows the residue classes by percentage, y-axis shows the observed frequencies for each class.
grouped into intervals of 0.05. The normality of residuals was verified in 99% of clonal test treatments, when sub-sample 1 was used to train the networks. The random selection of data for network training was less precise, with 97% of the treatments presenting normality in the residuals. In the progeny test, the normality of residuals was observed in 99% of the treatments in both sub-samples. Table 3 shows the time taken to measure the heights in the database, represented by days saved (based on an 8 h working day).
4.DISCUSSION
For both tests, the errors varied by an average of 10%, showing that the results generated by ANN were satisfactory. Both the relatively high correlation
Table 2 – K–S test for every age and treatment, sub-sample, and test. p-values greater than 0.05 indicates normal errors in the treatments.
Tabela 2 – Teste Kolmogorov - Smirnov (K-S) para cada idade e tratamento, sub-amostra e teste. Os p-valores maiores que 0,05 indicam normalidade dos resíduos nos tratamentos.
Test Data Age K–S Test Total
Selection p<0.01 p<0 .05 p<0.10 p<0 .15 p<0 .20 p>0.20 treatments
2.02 2 3 99 104
3.35 4 4
3.96 4 2 3 4 91 104
Random 5.06 3 3
5.94 1 1 102 104
Clonal 5.95 2 1 2 1 98 104
2.02 1 4 3 96 104
3.35 4 4
3.96 2 7 5 2 88 104
Tree 1 5.06 3 3
5.94 104 104
5.95 1 2 5 2 94 104
2.01 3 2 4 8 198 215
3.1 2 3 6 4 200 215
Random 3.13 2 3 210 215
3.98 1 2 8 7 7 190 215
Progeny 5.332.01 52 66 74 63 191200 215215
3.1 1 2 5 10 197 215
Tree 1 3.13 1 2 212 215
3.98 1 3 2 3 9 197 215
5.33 2 3 4 5 7 194 215
estimates between the data sets and the high percentage of treatments with normality in the residuals show that the networks were able to estimate tree heights in the experimental plots with sufficient accuracy for most of the treatments and all of the age ranges present in the database. The efficiency of neural networks for height estimation has already been demonstrated for forest inventories (where several categorical, edaphic, physiographic, and climatic variables are included) and forest inventory records (Binoti et al., 2012; Ozçelik et al., 2013).
When analyzing the results of the normality tests, we verified that for a few treatments, the network did not accurately estimate heights. The highest errors were found for trees of lower heights, increasing the efficiency of the method, because these types of
Repetition Time spent (h) Workdayssaved (8 h/day)
1 2, 3,4 and 5 Total
Clonal Test 54.8 84 138.7 10.5
Progeny Test 248.6 363.3 611.9 45.5
Table 3 – Time savings of measuring 40% of heights
experiments aim to confirm superior characteristics, such as resistance to pests and diseases, density, natural pruning, volume diameter, etc. (Ferreira, 1992).
The highest treatment percentages in clonal tests with normality in the residuals were observed in the estimates obtained by networks trained with the first tree of the block (sub-sample 1). In the progeny test, there were no differences in terms of ANN training between selecting the first tree of the block or selecting a random tree. Therefore, we recommend that the first tree of each block be measured, so that the operating procedure is simpler for operators.
Given the efficiency estimating heights in experimental plots using ANNs, it is possible to analyze the time gains produced by measuring the height of only one replicate in each block for each genotype (20% of the data). This means that individual estimation would no longer be needed for 6,663 trees in clonal tests and 29,434 trees in progeny tests.
Considering that on average, a measurer spends 1 min measuring and recording the height of a tree (without considering worker displacement), this means a time savings of 6,663 min (or 111.05 h or 13.88 working days (8 h/day)) when measuring tree heights in clonal tests. In progeny tests the time savings are even greater, with savings of 29.434 min (or 490 h or 61.32 working days (8 h/day)) are saved. These time and labor savings represent a significant reduction in the time required to measure experimental plots, which would lead to a significant reduction in research costs.
When training and applying neural networks for a specific year, age could be eliminated in the input layer. Another potential application that could be tested by users, using the configuration proposed in this study, is to train networks with one year of data and apply the process to another year, generalizing the heights of all trees on the second occasion. This application might be necessary if in a given year, for economic reasons, it is necessary to significantly reduce research measurement costs. This alternative was not tested in the present study, because the aim was to construct, propose, apply, and demonstrate the efficiency of neural networks in estimating height in the case of experimental measurement. We found that by measuring only one height per replicate, it is possible to accurately generalize the heights of other trees with accuracy.
5.CONCLUSIONS
Artificial neural networks are efficient at estimating height in clonal and progeny tests. They allow a reduction in working time in the measurement of experimental plots, and consequently a reduction in research costs, without losing measurement accuracy.
By measuring the height of only the first tree of each treatment replicate (genotypes), in clonal and progeny tests, the heights of the other trees can be estimated with sufficient accuracy.
6.REFERENCES
Alcântara AEM. Redes neurais artificiais para prognose do crescimento e da produção de povoamentos de eucalipto em Minas Gerais [tese]. Viçosa: Universidade Federal de Viçosa; 2015.
Andrade FA. Integração de variáveis espectrais e forma na classificação de imagens de alta
resolução utilizando redes neurais artificiais. Bol Ciênc Geod. 2003;9(1): 152-53.
Araújo MJ, Dias DC, Scarpinati EA, Paula RC. Número de repetições, de plantas por parcela e de avaliações para testes clonais de eucalipto. Pesqui Agropecu Bras. 2015;50(10):923-31. http:// dx.doi.org/10.1590/S0100-204X2015001000008.
Binoti D, Binoti MDS, Leite H, Silva A. Redução dos custos em inventário de povoamentos equiâneos utilizando redes neurais artificiais. Agraria. 2012;8(1):125-9. http://dx.doi.org/10.5039/ agraria.v8i1a2209.
Binoti DH, Binoti MLS, Leite HG, Silva A. Redução dos custos em inventário de
povoamentos equiâneos. Agraria. 2013;8(1):125-129. http://dx.doi.org/10.5039/agraria.v8i1a2209.
Campos JCC, Leite HG. Mensuração florestal: perguntas e respostas. 4. ed. Viçosa: Editora UFV; 2013.
Ferreira M. Melhoramento e a silvicultura intensiva clonal. Scientia Florestalis. 1992;45:22-30.
Lafetá BO. Eficiência nutricional, área foliar e produtividade de plantações de eucalipto em diferentes espaçamentos estimados com redes neurais artificiais [dissertação]. Diamantina: Universidade Federal dos Vales do Jequitinhonha e Mucuri; 2012.
Özçelik R, Diamantopoulou MJ, Crecente-Campo F, Eler U. Estimating Crimean juniper tree height using nonlinear regression and artificial neural network models. For Ecol Manage. 2013;306:52-60. http://dx.doi.org/10.1016/j.foreco.2013.06.009.
Pinto DS, Resende RT, Mesquita AGG, Rosado AM, Cruz CD. Early selection in tests for growth traits of Eucalyptus urophylla clones test. Sci For. 2014;42(102):251-7.
Ramalho MAP, Ferreira DF, Oliveira AC. Experimentação em genética e melhoramento de plantas. 2. ed. Lavras: UFLA; 2005.
Reis CAF, Gonçalves FMA, Rosse LN, Costa RRGF, Ramalho MAP. Correspondence between performance of Eucalyptus spp. trees selected from family and clonal tests. Genet Mol Res. 2011;10(2):1172-9. http://dx.doi.org/10.4238/vol10-2gmr1078. PMid:21732281.
Riedmiller M, Braun H. A direct adaptive method for faster backpropation learning: the RPROP algorithm. In: Proceedings of IEEE International
Conference on Neural Networks; 1993 Mar-Apr 28-1; San Francisco. San Francisco: IEEE; 1993. p. 586-591. http://dx.doi.org/10.1109/
ICNN.1993.298623 .
Santos GA, Xavier A, Leite HG. Desempenho silvicultural de clones de Eucalyptus grandis em relação às matrizes. Rev Arvore. 2006;30(5):737-47. http://dx.doi.org/10.1590/S0100-67622006000500007.
Schikowski AB, Dalla Corte AP, Sanquetta CR. Estudo da forma do fuste utilizando redes neurais artificiais e funções de afilamento. Pesqui Florest Bras. 2015;35(82):119-27. http://dx.doi.org/10.4336/ 2015.pfb.35.82.867.
Schoeninger ER, Koehler HS, Watzlawick LF, Oliveira PC Fo. Uso de redes neurais artificiais como uma alternativa para mapeamento de biomassa e carbono orgânico no componente arbóreo de florestas naturais. Ambiência. 2009;4(3):529-49.
Silva MLMS. Emprego de redes neurais artificiais em mensuração e manejo florestal [dissertação]. Viçosa: Universidade Federal de Viçosa; 2012.