Acta Scientiarum
http://www.uem.br/acta ISSN printed: 1679-9275 ISSN on-line: 1807-8621
Doi: 10.4025/actasciagron.v39i3.32576
Kinetic modeling of water sorption by roasted and ground coffee
Fernanda Machado Baptestini1*, Paulo Cesar Corrêa1, Gabriel Henrique Horta de Oliveira2,
Paulo Roberto Cecon3 and Nilda de Fátima Ferreira Soares4
1
Universidade Federal de Viçosa, Departamento de Engenharia Agrícola e Ambiental, Avenida Peter Henry Rolfs, s/n, Campus Universitário, Viçosa, Minas Gerais, Brazil. 2Instituto Federal de Educação, Ciência e Tecnologia Sudeste de Minas Gerais, Campus de Manhuaçu, Manhuaçu, Minas Gerais, Brazil. 3Universidade Federal de Viçosa, Departamento de Estatística, Viçosa, Minas Gerais, Brazil. 4Universidade Federal de Viçosa, Departamento de Tecnologia de Alimentos.Viçosa, Minas Gerais, Brazil. *Author for correspondence. E-mail: [email protected]
ABSTRACT. The objective of this study was to model the kinetics of water sorption in roasted and ground coffee. Crude Arabica coffee beans with an initial moisture content of 0.1234 kgwkgdm-1 were used.
These beans were roasted to a medium roast level (SCCA # 55) and ground at three particle sizes: coarse (1.19 mm), medium (0.84 mm) and fine (0.59 mm). To obtain the water sorption isotherms and the isosteric heat, different conditions of temperature and relative humidity were analyzed using the dynamic method at 25ºC (0.50, 0.60, 0.70, and 0.80 of RH) and 30°C (0.30, 0.40, 0.50, 0.60, 0.70, and 0.80 of RH) and using the static method at 25ºC (0.332 and 0.438 of RH). The GAB model best represented the hygroscopic equilibrium of roasted coffee at every particle size. Isosteric heat of sorption for the fine particle size increased with increments of equilibrium moisture content, indicating a strong bond energy between water molecules and the product components. The Gibbs free energy decreased with the increase in equilibrium moisture content and with temperature.
Keywords: particle size, specific surface, isosteric heat.
Modelagem da cinética de sorção de água de café torrado e moído
RESUMO. Objetivou-se com este trabalho modelar a cinética de sorção de água pelo café torrado e moído. Foram utilizados grãos de café arábica com teor de água inicial de 0,1234 kga kgms-1, torrados no
ponto de torra médio (SCCA # 55), tendo sido estabelecido três níveis granulométricos: grossa (1,19 mm), média (0,84 mm) e fina (0,59 mm). Para a obtenção das isotermas de sorção da água e do calor isostérico, foram analisadas diferentes condições de temperatura e umidade relativa: usando o método dinâmico, 25ºC (0,50; 0,60; 0,70 e 0,80 de UR) e 30°C (0,30; 0,40; 0,50; 0,60; 0,70 e 0,80 de UR); e o método estático, 25ºC (0,332 e 0,438 de UR). Os dados de teor de água no equilíbrio foram correlacionados com modelos matemáticos. O modelo de GAB foi o que melhor representou o equilíbrio higroscópico para a sorção do café torrado nos diferentes níveis granulométricos. O calor isostérico de sorção na granulometria fina aumentou com a elevação do teor de água de equilíbrio indicando forte grau de ligação entre as moléculas de água e o produto. A energia livre de Gibbs diminuiu com o aumento do teor de água de equilíbrio e com a temperatura.
Palavras-chave: granulometria, superfície específica, calor isostérico.
Introduction
The popularity of coffee is not based on its nutritional value or potential health benefits but is due to its flavor and stimulating effects. Currently, several new coffee products are being developed, such as capsules and sachets. Commercialization and success of these types of products require the correct preservation of ground, roasted coffee beans. Different factors can influence the preservation of coffee and consequently its final quality, including cultivation, harvest and post-harvest processing (for example, grinding, roasting and storage).
The purpose of grinding is to increase the surface area for extraction, as it increases the
interface between water and the solid to facilitate the transfer of soluble substances to the brewing water, which affect cup quality (Illy & Viani, 1996). However, grinding promotes cell breakage and enables the release of molecular components, which can make quality preservation difficult (Corrêa et al., 2016a).
influence roasted coffee quality during storage (Kreuml, Majchrzak, Ploederl, & Koenig, 2013).
Temperature and relative humidity of the environment surrounding the product are the primary parameters to be considered during storage. They determine the water activity (aw) of the product and
thus the water exchange between the product and the environment (Henao, Queiroz, & Haj-Isa, 2009). Due to its low moisture content, roasted and ground coffee may absorb moisture from the environment, causing clumping and inhibiting handling and movement of the product as well as increasing economic losses (Oliveira et al., 2014). Sorption isotherms are a key metric for assessing water sorption during storage and are affected by coffee particle size and roasting (Oliveira et al., 2014).
Along with water sorption, the thermodynamic sorption properties of a material may be monitored by assessing the aw. According to Corrêa, Oliveira, and
Santos (2012), the thermodynamic properties of agricultural products is a key resource that can provide information for assessing the effect of aw on product
storage as well as food microstructure, and they can aid in the understanding of the properties of the adsorbed water. This information enables the study of the physical phenomena that occur on food surfaces.
Given these reasons, as well as the importance of understanding the hygroscopicity of agricultural products, the objective of this study was to determine the adsorption isotherms of roasted coffee ground at different particle sizes. Additionally, this study sought to determine the thermodynamic properties of water sorption as a function of aw.
Material and methods
The present work was developed at the Physical Properties and Quality of Agricultural Products Laboratory, belonging to the National Center of Storage Training (CENTREINAR), located at the Federal University of Viçosa, Viçosa, Minas Gerais State, Brazil.
Sample preparation
Crude coffee (Coffea arabica L.) were used for these experiments, with average size above sieve number 16 and initial moisture content of 0.1234 kgw kgdm-1. A direct
burning roaster using GLP gas, with a rotating cylinder at 45 rpm and capacity of 350 g of crude grain was used to roast the beans. The average temperature of roaster was 284ºC. Roasting was complete when bean mass temperature reached 235ºC, after approximately 16 minutes, which led to 17% weight loss. This characteristic matches the medium roast standard for coffee beans, based on the Agtron number (SCCA # 55). Sample temperature measurement was
accomplished with an infrared thermometer.
After roasting, coffee was ground at three particle sizes: coarse (1.19 mm), medium (0.84 mm) and fine (0.59 mm), using milling equipment (Mahlkönig, model K32 S30LAB, Germany), according to Corrêa et al. (2016b).
Sorption isotherms
Moisture content was measured as described by the Regras para análise de sementes (Rules for Seed Testing) (Brasil, 2009). Dynamic and static sorption methods were used to measure the equilibrium moisture content of roasted and ground coffee at different particle sizes.
The following combinations of temperature and relative humidity were used for the dynamic method: 25ºC (0.50, 0.60, 0.70, and 0.80 of RH) and 30°C (0.30, 0.40, 0.50, 0.60, 0.70, and 0.80 of RH). These conditions of temperature and humidity were created with an Aminco-Aire atmosphere conditioner unit (Aminco Company).
BOD (Biological Oxygen Demand) chambers kept at 25ºC were used for the static method, with desiccators using saturated solutions of potassium carbonate and hydrated magnesium chloride (relative humidities of 0.332 and 0.438, respectively). These saturated solutions were prepared according to techniques cited by Hall (1980).
Samples of 10 g were used and weighed periodically until the mass variation among three consecutive measurements was less than or equal to 0.01 g, signifying hygroscopic equilibrium.
Mathematical models were fitted to the hygroscopic equilibrium data to describe the sorption phenomenon (Table 1).
Table 1. Mathematical models to represent hygroscopic equilibrium curves.
Model name Model
Modified Oswin (1)
Halsey (2)
Chung-Pfost (3)
Sigma-Copace (4)
Copace (5)
Guggnheim-Anderson-de Boer (GAB)
(6)
In which, Ue: equilibrium moisture content; aw: water activity, decimal; a, b e c: parameters of the models and T: temperature, °C; Um: monolayer moisture content, % d.b.; and C and Κ: parameters of the GAB model which are related to the dimensionless monolayer and multilayer properties, respectively.
(
)
e 1
c w
w
a b T U 1 a a + = −
(
)
(
)
1 c e wexp a b T U ln a − = −
(
) (
)
e wU =a−b ln c T ln a−
( ) ( )
{
}
e w
U =exp a− b T +c exp a
(
) (
)
e w
U =exp a − b T + c a
(
)(
)
m w
e
w w w
U C K a U
1 K a 1 K a C K a
=
Kinetic modeling of water sorption by coffee 275
The standard deviation of the estimate (SDE), mean relative error (MRE) values, and residual plot were analyzed to assess the goodness of the model fit. The MRE and SDE values of each model were calculated using Equations 7 and 8, respectively:
n i i
i 1 i
ˆ
Y Y
100 MRE
n = Y
−
=
(7)(
)
n i i i 1 ˆ Y Y SDE GLR = − =
(8)In which: MRE = mean relative error, %; SDE = standard deviation of the estimate, % d.b.; Y = observed value; Ŷ = estimated value by the model; n = number of observed data; and DF = residue degrees of freedom (number of observed data minus number of model parameters).
Thermodynamic properties
The isosteric heat of sorption (Qst) can be
defined as a partial molar property, derived from the isotherm dependence on temperature (Equation 9).
( )
st2 a w
d ln P Q
dT R T
=
(9)
where: P = partial pressure of water vapor; R = water vapor constant, 0.462 kJ kg-1 K-1; T
a =
absolute temperature, K; Qst = isosteric heat of
sorption, kJ kg-1.
The Clausius-Clapeyron equation is often used to establish the isosteric heat of sorption because it provides a rapid computational procedure. From that equation, applied to pure water, the following was obtained:
st
w n
2
0 w w a
a Q
P
d ln dT d ln
P dT R T
= = (10)
where, Po = saturation pressure at temperature Ta;
Qnst = net isosteric heat of sorption, kJ kg-1.
The net isosteric heat of sorption is the difference between the isosteric heat and pure water vaporization energy (Lr). This variable can be
calculated according to Equation 10 by plotting the sorption isotherms as ln (aw), at a specific moisture
content, vs. 1/Ta, and measuring the slope (Wang &
Brennan, 1991).
Equation 10 is based on the assumption that Qnst
is invariant with Ta. Although not always true, this
assumption has often been accepted (Iglesias & Chirife, 1976). This method requires the measurement of sorption isotherms at more than two temperatures. The isosteric heat may also be calculated from the integrated form of Equation 11 applied to sorption isotherms measured at two temperatures (Wang & Brennan, 1991).
st a1 a 2 w 2
n
a 2 a1 w1
T T a
Q R ln
T T a
= −
(11)
The Gibbs free energy was calculated using Equation 12. Free energy changes are positive for desorption and negative for adsorption (Atkins, 2000).
(
)
a w
G R T ln a
Δ = ± (12)
Results and discussion
Table 2 presents the parameters of the models fitted to the equilibrium moisture content of roasted coffee ground to different particle sizes at different temperature and relative humidity conditions. The respective values of the coefficient of determination (R2), standard deviation of the estimate (SDE) and
mean relative error (MRE) are also included.
The coefficient of determination values were higher than 95% for most of the models, but this parameter cannot be used on its own to decide which model best fits the process as it is based on linear models. Low values of SDE indicate good fit of the model as a description of the sorption process (Draper & Smith, 1998), and low values of MRE (lower than 10%) indicate a good fit for practical purposes (Samapundo et al., 2007). Thus, Halsey and Chung-Pfost models are not suitable because values of MRE and SDE at medium particle size are inadequate (Table 2).
The remaining models can be used to predict the sorption isotherms of roasted coffee at different particle sizes. However, the GAB model is superior to empirical models, as its coefficients are correlated to physical changes, allowing a more detailed study of the heat and mass transfer during sorption.
Table 2. Parameters of the models fitted to equilibrium moisture content of roasted coffee, in different particle sizes, with coefficient of determination (R2
), standard deviation of the estimate (SDE) and mean relative error (MRE), stored at 25 and 30ºC.
Models Particle sizes
Coarse Medium Fine
Modified Oswin
a = 5.8873 a = 6.6994 a = 6.4785
b = -0.0303 b = -0.0671 b = -0.0681
c = 1.5667 c = 1.6029 c = 1.6404
R2 = 0.9827 R2 = 0.9519 R2 = 0.9643
SDE (% d.b.) = 0.424 SDE (% d.b.) = 0.674 SDE (% d.b.) = 0.526 MRE (%) = 6.47 MRE (%) = 9.34 MRE (%) = 8.64
Halsey
a = 1.8672 a = 2.142803 a = 2.160087
b = 0.0077 b = 0.018049 b = 0.019662
c = 1.2540 c = 1.282622 c = 1.309824
R2 = 0.9759 R2 = 0.9440 R2 = 0.9592
SDE (% d.b.) = 0.501 SDE (% d.b.) = 0.727 SDE (% d.b.) = 0.563 MRE (%) = 8.35 MRE (%) = 10.85 MRE (%) = 9.66
Chung-Pfost
a = 29.1515 a = 23.4887 a = 22.7647
b = 5.6263 b = 5.2635 b = 4.7898
c = -72.1519 c = -20.1356 c = -33.4663
R2 = 0.9768 R2 = 0.9519 R2 = 0.9532
SDE (% d.b.) = 0.491 SDE (% d.b.) = 0.674 SDE (% d.b.) = 0.603 MRE (%) = 7.45 MRE (%) = 10.16 MRE (%) = 8.27
Sigma-Copace
a = -0.8067 a = -0.5718 a = -0.5369
b = 0.0062 b = 0.0141 b = 0.0151
c = 1.5640 c = 1.5283 c = 1.4935
R2 = 0.9804 R2 = 0.9493 R2 = 0.9613
SDE (% d.b.) = 0.451 SDE (% d.b.) = 0.692 SDE (% d.b.) = 0.548 MRE (%) = 6.97 MRE (%) = 9.87 MRE (%) = 8.98
Copace
a = 0.3184 a = 0.5280 a = 0.5443
b = 0.0060 b = 0.0139 b = 0.0150
c = 2.9193 c = 2.8515 c = 2.7778
R2 = 0.9831 R2 = 0.9536 R2 = 0.9616
SDE (% d.b.) = 0.419 SDE (% d.b.) =0.662 SDE (% d.b.) =0.546 MRE (%) = 5.84 MRE (%) =8.99 MRE (%) = 8.35
GAB 25°C
Um = 4.851 Um = 5.263 Um = 4.123
K = 0.831 K = 0.791 K = 0.851
C = 2.510 C = 2.321 C = 2.707
R2
= 0.9920 R2
= 0.9495 R2
= 0.9798 SDE (% d.b.) = 0.280 SDE (% d.b.) = 0.676 SDE (% d.b.) = 0.409
MRE (%) = 3.67 MRE (%) = 6.44 MRE (%) = 7.13
GAB 30°C
Um = 4.292 Um = 4.398 Um = 3.185
K = 0.882 K = 0.859 K = 0.898
C = 2.143 C = 1.861 C = 4.030
R2 = 0.9220 R2 = 0.9666 R2 = 0.9487
SDE (% d.b.) = 0.447 SDE (% d.b.) = 0.596 SDE (% d.b.) = 0.639 MRE (%) = 6.57 MRE (%) = 8.33 MRE (%) = 10.07
Figure 2 presents sorption isotherms, estimated by the GAB model, for different particle sizes of coffee, at 25 and 30ºC.
According to Oliveira, Corrêa, Santos, Treto, and Diniz (2011), monolayer moisture content indicates the amount of water molecules that are strongly adsorbed at specific sites on the food surface. This value is an important measurement for ensuring foodstuff stability (Lavoyer, Gabas, Oliveira, & Telis-Romero, 2013). Values of this coefficient varied between 3.185 to 5.293% d.b. Minimal deterioration is expected in products with a lower moisture content compared to a monolayer moisture content because the water is strongly bound and does not participate in chemical reactions (Dalgiç, Pekmez, & Belibagl, 2012).
The C constant is associated with the chemical potential differences between the monolayer and superior layers. As observed in Table 2, this constant did not present a defined behavior in the present
work, although this trend was reported previously (Oliveira et al., 2011; Goneli, Corrêa, Oliveira, & Afonso Júnior, 2013). According to Goneli et al. (2013), this is due to the heterogeneous nature of coffee products, and variance among layers may lead to this trend.
The constant K corresponds to the difference at the chemical potential between the monolayer and free water. These numbers are, with rare exceptions, close; K is consistently lower than unity (Timmermann, Chirife, & Iglesias, 2001) (Table 2).
Kinetic modeling of water sorption by coffee 277
molecules vary with temperature alteration. Thus, the amount of absorbed water changes due to temperature
variation at a given relative humidity (Mohsenin, 1986).
GAB 25°C: coarse GAB 25°C: medium
GAB 25°C: fine GAB 30°C: fine
GAB 30°C: coarse GAB 30°C: medium
Figure 1. Residual plots of GAB model.
Figure 2. Observed values and sorption isotherms of coffee, estimated by the GAB model, for different particle sizes, at temperatures of 25 and 30ºC.
Sorption isotherms of roasted coffee presented a pronounced increase of moisture content in the final values, corresponding to elevated water activity values (Figure 2). Analogous behavior was observed by Corrêa, Afonso Júnior, and Stringheta (2000), and Anese, Manzocco, and Nicoli (2006), suggesting a similar trend for most products of agricultural origin. Furthermore, from Figure 2 it can be concluded that particle size significantly altered the equilibrium moisture content of roasted and ground coffee, especially at higher values of water activity (> 0.80). This trend can be explained by changes to the specific area: lower particle sizes lead to higher specific area and consequently higher interaction with the environment, reaching higher values of equilibrium moisture content.
The moisture content of roasted and ground coffee established by Brazilian law cannot exceed 5.26% (d.b.). Considering this value, regardless of temperature, this limit is surpassed if starting from a water activity of 0.55 (Figure 2), compromising physical, chemical and biological stability of the products.
Observed and estimated values of the integral isosteric heat of sorption, as a function of equilibrium moisture content of roasted coffee samples, in different particle sizes, are shown in Figure 3.
Figure 3 shows an increase of integral isosteric heat of sorption with decrease of equilibrium moisture content, for roasted coffee at medium and coarse particle sizes. This trend was also reported for other agricultural products (Cano-Higuita, Villa-Vélez, Telis-Romero, Váquiro, & Telis, 2015; Ascheri, Moura, Ascheri, & Junior, 2009; Goula, Karapantsios, Achilias, & Adamoupolos, 2008). This is because, at the beginning of sorption, there are highly active polar sites of elevated interaction energy at the product surface, which are covered with water molecules, forming a monomolecular layer. As water molecules chemically link to active sites, sorption starts to occur at less active sites, with lower interaction energy and, consequently, lower isosteric heat of sorption (Pérez-Alonso, Beristain, Lobato-Calleros, Rodríguez-Huezo, & Vernon-Carter, 2006).
An inverse trend was observed for fine particle size in roasted coffee (Figure 3). This same response was observed by Oliveira, Corrêa, Oliveira, Baptestini, and Vargas-Elías (2016). The author explained that water adsorption occurred in vapor form, since the energy released by the process did not reach the value of the latent heat of condensation. The fact that the energy released is lower than that for free water indicates that the bond
strength between water molecules and active sites in dry matter of the product is weaker than the bonds between water molecules.
Figure 3. Observed and estimated values of integral isosteric heat of sorption of roasted coffee, for different particle sizes.
The latent heat of vaporization, representing the minimum amount of energy required to evaporate water molecules, was 2436.48 kJ kg-1. Figure 3
shows that integral isosteric heat of sorption was always higher than latent heat of vaporization, until equilibrium moisture content reached 11 and 12% d.b., for coarse and medium particle size, respectively. This trend is because the bonding energy between water molecules and sorption sites is higher than the bonding energy among water molecules at liquid phase (Masuzawa & Sterling, 1968). At these points, it reaches minimum values of 2402.97 and 2108.42 kJ kg-1 for coarse and medium
particle sizes, respectively, indicating that the liquid isosteric heat is negative. According to Tsami (1991), the more negative the value of heat of sorption, the higher the degree of water binding on the food.
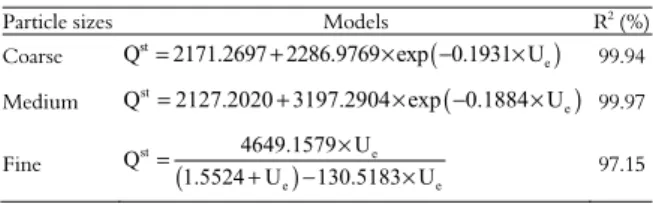
Table 3 presents fitted equations of integral isosteric heat of sorption for roasted and ground coffee in different particle sizes. The proposed equations showed good fitting, with a coefficient of determination above 97%.
Table 3. Fitted equations of integral isosteric heat of sorption for roasted and ground coffee in different particle sizes.
Particle sizes Models R2 (%)
Coarse st ( )
e
Q =2171.2697 2286.9769 exp+ × −0.1931 U× 99.94
Medium st ( )
e
Q =2127.2020 3197.2904 exp+ × −0.1884 U× 99.97
Fine
( )
st e
e e
4649.1579 U Q
1.5524 U 130.5183 U
× =
+ − × 97.15
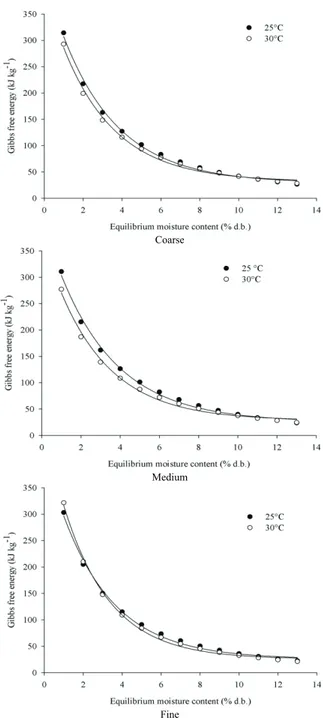
Kinetic modeling of water sorption by coffee 279
Coarse
Medium
Fine
Figure 4. Gibbs free energy of roasted and ground coffee in coarse, medium and fine particle sizes.
Changes of the Gibbs free energy during water sorption between the product and the environment can be defined as required energy to transfer water molecules from the vapor state to a solid surface, or vice versa. This is the amount of work generated by the system during the adsorption or desorption process (Kaleemullah & Kailappan, 2007).
Gibbs free energy values decreased with equilibrium moisture content and temperature increment. Positive values of Gibbs free energy are also expected, corresponding to endothermic reactions,
which require energy from the environment to occur (Goneli et al., 2013).
From Figure 4, it is observed that influence of temperature over Gibbs free energy is higher at lower values of equilibrium moisture content: lower temperatures provide higher values of Gibbs free energy. This trend was also observed by Goneli et al. (2013), as they correlated temperature to the vibration of water molecules within the product; at high temperatures this vibration (movement) is higher, leading to lower work required for the product layers to become available to sorption. At high levels of equilibrium moisture content, the temperature influence becomes negligible because the sorption sites are already available.
Table 4 presents fitted equations of Gibbs free energy of roasted and ground coffee in different particle sizes. The proposed equations presented good fitting, with coefficients of determination above 99%.
Table 4. Fitted equations of Gibbs free energy of roasted and ground coffee of different particle sizes.
Particle sizes
Temperature
(°C) Models
R2
(%)
Coarse 25 ( e)
G 28.7026 393.3855 exp 0.3442 U
Δ = + × − × 99.83
30 ΔG=32.7806 367.5229 exp+ × (−0.3673 U× e)99.58
Medium 25
( e)
G 25.4401 388.7621 exp 0.3347 U
Δ = + × − × 99.63
30 Δ =G 28.2859 349.9071 exp+ × (−0.3675 U× e) 99.53
Fine 25
( e)
G 25.7021 391.8711 exp 0.3681 U
Δ = + × − × 99.66
30 ΔG=25.6747 441.0900 exp+ × (−0.4161 U× e)99.74
Conclusion
The GAB, Modified Oswin, Sigma-Copace and Copace models are suitable to represent the hygroscopic equilibrium of water sorption by roasted coffee, ground to different particle sizes; however, the GAB model was chosen because its coefficients are correlated to physical changes.
Reduction of equilibrium moisture content leads to an increase of released energy by water adsorption at coarse and medium particle sizes, represented by the integral isosteric heat of sorption values.
Isosteric heat of sorption at the fine particle size increased with equilibrium moisture content increments, indicating strong bonding between water molecules and the product.
The Gibbs free energy decreased with equilibrium moisture content and temperature increments.
Acknowledgements
References
Anese, M., Manzocco, L., & Nicoli, M. C. (2006). Modeling the secondary shelf life of ground roasted coffee. Journal of Agricultural and Food Chemistry, 54(15), 5571-5576.
Ascheri, D. P. R., Moura, W. S., Ascheri, J. L. R., & Junior, E. A. F. (2009). Propriedades termodinâmicas de adsorção de água do amido de rizomas do lírio-do-brejo (Hedychium coronarium). Ciência e Tecnologia de Alimentos, 29(2), 454-462.
Atkins, W. P. (2000). Chimie Physique (6th ed., Chapter 28). Paris, Bruxelles: De Boeck Université.
Brasil. (2009). Ministério da Agricultura, Pecuária e Abastecimento. Regras para análise de sementes. Brasília, DF: MAPA/ACS.
Cano-Higuita, D. M., Villa-Vélez, H. A., Telis-Romero, J., Váquiro, H. A., & Telis, V. R. N. (2015). Influence of alternative drying aids on water sorption of spray dried mango mix powders: A thermodynamic approach. Food and Bioproducts Processing, 93, 19-28. Corrêa, P. C., Afonso Júnior, P. C., & Stringheta, P. C.
(2000). Estudo do fenômeno de adsorção de água e seleção de modelos matemáticos para representar a higroscopicidade do café solúvel. Revista Brasileira de Produtos Agroindustriais, 2(1), 19-25.
Corrêa, P. C., Oliveira, G. H. H., & Santos, E. S. (2012). Thermodynamics properties of agricultural products processes. In: I. Arana (Ed.). Physical properties of foods: novel measurement techniques and applications. Boca Raton, US: CRC.
Corrêa, P. C., Oliveira, G. H. H., Oliveira, A. P. L. R., Vargas-Elías, G. A., SANTOS, F. L., & Baptestini, F. M. (2016a). Preservation of roasted and ground coffee during storage Part 1: Moisture content and repose angle. Revista Brasileira de Engenharia Agrícola e Ambiental, 20(6), 581-587.
Corrêa, P. C., Oliveira, G. H. H., Oliveira, A. P. L. R., Vargas-Elías, G. A., & Baptestini, F. M. (2016b). Particle size and roasting on water sorption in conilon during storage. Coffee Science, 11(2), 221-233.
Dalçic, A. C., Pekmez, H., & Belibagl, B. K. (2012). Effect of drying methods on the moisture sorption isotherms and thermodynamics properties of mint leaves. Journal of Food Science Technology, 49(4), 439-449.
Draper, N. R., & Smith, H. (1998). Applied regression analysis. Wiley series in probability and mathematical statistics (3rd ed.). New York, US: John Wiley & Sons.
Goneli, A. L. D., Corrêa, P. C., Oliveira, G. H. H., & Afonso Júnior, P. C. (2013). Water sorption properties of coffee fruits, pulped and green coffee. LWT - Food Science and Technology, 50(2), 386-391.
Goula, A. M., Karapantsios, T. D., Achilias, D. S., & Adamoupolos, K. (2008). Water sorption isotherms and glass transition temperature of spray dried tomato pulp.
Journal of Food Engineering, 85(1), 73-83.
Hall, C. W. (1980). Drying and storage of agricultural crops. Westport, US: AVI.
Henao, J. D., Queiroz, M. R., & Haj-Isa, N. M. A. (2009). Umidade de equilíbrio de café cereja descascado baseada em métodos estático e dinâmico. Revista Brasileira de Engenharia Agrícola e Ambiental, 13(4), 470-476.
Illy, A., & Viani, R. (1996). Express coffee: the chemistry of quality. London, UK: Academic Press.
Iglesias, H., & Chirife, J. (1976). Prediction of the effect of temperature on water sorption isotherms of food material. Journal of Food Technology, 11(2), 109-116. Kaleemullah, S., & Kailappan, R. (2007). Monolayer
moisture, free energy change and fractionation of bound water of red chillies. Journal of Stored Products Research,
43(2), 104-110.
Kreuml, M. T. L., Majchrzak, D., Ploederl, B., & Koenig, J. (2013). Changes in sensory quality characteristics of coffee during storage. Food Science & Nutrition, 1(4), 267-272.
Lavoyer, F. C. G., Gabas, A. L., Oliveira, W. P., & Telis-Romero, J. (2013). Study of adsorption isotherms of green coconut pulp. Food Science and Technology, 33(1), 68-74.
Masuzawa, M., & Sterling, C. (1968). Gel-water relationshisps in hydrophilic polymers: thermodynamics of sorption of water vapour. Journal of Polymer Science,
12(9), 20-23.
Mohsenin, N. N. (1986). Physical properties of plant and animal materials. New York, US: Gordon and Breach Publishers. Oliveira, G. H. H., Corrêa, P. C., Oliveira, A. P. L. R.,
Baptestini, F. M., & Vargas-Elías, G. A. (2016). Roasting, grinding, and storage impact on thermodynamic properties and adsorption isotherms of arabica coffee.
Journal of Food Processing and Preservation. doi:10.1111/jfpp.12779
Oliveira, G. H. H, Corrêa, P. C., Santos, E. S., Treto, P. C., & Diniz, M. D. M. S. (2011). Evaluation of thermodynamics properties using GAB model to describe the desorption process cocoa beans. International Journal of Food Science & Technology, 46(10); 2077-2084.
Oliveira, G. H. H., Corrêa, P. C., Santos, F. L., Vasconcelos, W. L., Calil Júnior, C., Baptestini, F. M., & Vargas-Elías, G. A. (2014). Caracterização física de café após torrefação e moagem. Semina: Ciências Agrárias, 35(4), 1813-1828. Palipane, K. B., & Driscoll, R. H. (1992). Moisture sorption
characteristics of in-shell macadamia nuts. Journal of Food Engineering, 18(1), 63-76.
Pérez-Alonso, C., Beristain, C. I., Lobato-Calleros, C., Rodríguez-Huezo, M. E., & Vernon-Carter, E. J. (2006). Thermodynamic analysis of the sorption isotherms of pure and blended carbohydrate polymers. Journal of Food Engineering, 77(4), 753-760.
Samapundo, S., Devlieghere, F., De Meulenaer, B., Atukwase, A., Lamboni, Y., & Debevere, J. M. (2007). Sorption isotherms and isosteric heats of sorption of whole yellow dent corn. Journal of Food Engineering,
79(1), 168-175.
Kinetic modeling of water sorption by coffee 281
Tsami, E. (1991). Net isosteric heat of sorption in dried fruits.
Journal of Food Engineering, 14(4), 327-335.
Wang, N., & Brennan, J. G. (1991). Moisture sorption isotherm characteristics of potato at four temperatures.
Journal of Food Engineering, 14(4), 269-287.
Received on July 5, 2016. Accepted on September 20, 2016