Revista Árvore. 2018;42(2):e420215
RAINFALL PARTITIONING IN FRAGMENTS OF CERRADO VEGETATION AT
DIFFERENT STAGES OF CONDUCTION OF NATURAL REGENERATION
1Débora Bessi2*, Herly Carlos Teixeira Dias3 and Kelly Cristina Tonello4
1 Received on 12.04.2017 accepted for publication on 07.03.2018.
2 Universidade Federal de São Carlos, Programa de Pós-Graduação em Ciências Ambientais, São Carlos, SP-Brasil. E-mail:
<debora.bessi@gmail.com>.
3 Universidade Federal de Viçosa, Departamento de Engenharia Florestal, Viçosa, MG-Brasil. E-mail: <herly@ufv.br>. 4 Universidade Federal de São Carlos, Departamento de Ciências Ambientais, Sorocaba, SP-Brasil.. E-mail: <kellytonello@yahoo.com>.
*Corresponding author.
ABSTRACT – In order to contribute to the discussion on how forest development interacts with hydrological processes related to rainfall partitioning, we aimed to characterize the rainfall interception (RI), throughfall (Tf), stemflow (Sf), and net precipitation (NP) in three Cerrado areas at different stages of natural regeneration conduction: treatment 1 = area with 4 years without human intervention; treatment 2 = 10 years; and treatment 3 = 43 years. In all areas, three 400-m² plots were established, in each of which 12 rain gauges and stemflow collectors were installed on all trees having Diameter at Breast High (DBH) > 5 cm. Data was recorded from December 2015 through November 2016. At treatment 1, Tf corresponded to 100% of gross precipitation (GP) in the micro-basin, while Sf corresponded to 0.01%, RI to 0%, and NP to 100% of GP. At treatment 2, Tf corresponded to 96% of GP, whereas Sf corresponded to 0.19%, RI to 4%, and NP to 96% of GP. At treatment 3, Tf corresponded to 87% of GP, while Sf corresponded to 1.15%, RI to 12%, and NP to 88%. The results revealed significant differences among the study areas. Both RI and Sf increased with advancing natural regeneration, while Tf and NP decreased. Data varied according to vegetation features, like the number and density of individuals and species in each plot, and according to characteristics related to weather and precipitation in the area.
Keywords: Throughfall; Stemflow; Rainfall interception.
REPARTIÇÃO DE CHUVA EM FRAGMENTOS DE CERRADO SOB
DIFERENTES ESTÁGIOS DE CONDUÇÃO DA REGENERAÇÃO NATURAL
RESUMO – De modo a contribuir com a discussão de como o desenvolvimento da floresta interage com os processos hidrológicos relacionados à repartição de chuva, esse estudo caracterizou a interceptação (RI), precipitação interna (Tf), escoamento pelo tronco (Sf) e precipitação efetiva (NP) em três áreas sob vegetação de Cerrado com diferentes idades de condução da regeneração natural: Tratamento 1 - 4 anos; Tratamento 2 - 10 anos e Tratamento 3 - 43 anos. Em ambas as áreas foram demarcadas três parcelas de 400 m², e para cada uma foram instalados 12 pluviômetros e escoamento pelo tronco em todas as árvores com diâmetro à altura do peito (DAP) > 5cm. Os dados foram registrados entre dezembro de 2015 e novembro de 2016. Para o Tratamento 1 a Tf foi de 100% do total precipitado na microbacia, Sf de 0,01%, RI igual a 0% e NP de 100%. Já o Tratamento 2, a Tf correspondeu a 96%, Sf a 0,19%, RI igual a 4%, e NP de 96%. Para o Tratamento 3, obteve-se para a Tf valor igual a 87%, Sf igual a 1,15%, RI de 12%, tendo NP de 88%. Os resultados mostraram diferenças significativas entre as áreas estudadas. Notou-se que a RI e o Sf apresentaram comportamento crescente conforme o avanço da regeneração natural, ao passo que a Tf e a NP diminuíram. Tais resultados variaram conforme as características da vegetação, como por exemplo, a quantidade e densidade de indivíduos em cada parcela e espécies presentes, além das características climáticas e das precipitações incidentes sobre a área.
1. INTRODUCTION
Forests play a major role as regulators of water balance by intercepting and distributing rainwater across forest compartments, thereby aiding in the regulation of water flow through the soil; and by recharging aquifers (Arcova et al., 2003).
The role played by vegetation as a water regulator begins with the water input in forest compartments. When rainwater precipitates, vegetation first catches it with the tree crowns, and the initial rain volume is then partitioned. Thereby, a portion of rainwater gets retained in the canopy, through a process called interception, while the other portion reaches the soil, through a process called net precipitation – which consists in the sum of throughfall and stemflow. All these interactions not only reduce the force with which the water reaches the soil, but also distributes the water across the forest compartments (Arcova et al., 2003; Lorenzon et al., 2013; Honda, 2013).
According to Lorenzon et al. (2013), values of net precipitation and rainfall interception may vary within a same ecosystem, among near fragments or even within a same fragment, depending on the stage of forest regeneration. These two variables allow for a comparative evaluation of areas with and without plant cover, which is crucial in view of the different effects that may occur in each of these situations.
Thus, we aimed to characterize the rainfall partitioning in forest areas at different stages of natural regeneration conduction in a microbasin at the Floresta das Águas Perenes RPPN (Portuguese acronym for: ‘Reserva Particular de Patrimônio Natural’; i.e.: Private Reserve of Natural Patrimony), Brotas municipality, São Paulo state, southeastern Brazil. By that, we also wished to contribute to the discussion on the forest-water relationship in forest areas undergoing regeneration.
2. MATERIAL AND METHODS
The study was conducted in the Floresta das Águas Perenes RPPN, located in Brotas municipality, São Paulo state, southeastern Brazil. In 2011, the area was recognized by the Forest Stewardship Council as a High Conservation Value Forest, since it provides basic environmental services, such as protecting river basins. The RPPN extends over 809.78 ha of Cerrado, and its phytophysiognomy is characterized as secondary vegetation of types Typical Cerrado and Cerradão. The
area had been previously used for pasture, but in the last 43 years it has been used for eucalyptus cultivation. From 2006, following the harvest of some eucalyptus stands, natural regeneration started to be conducted in the area.
According to Köppen’s classification, climate in the region is type Cwa, with wet summers and dry winters, and mean annual precipitation ranges between 1400 and 1500 mm (Cepagri, 2016). The predominant soil type is Quartzarenic Neosol (Embrapa, 1999).
Hydrological indicators were monitored from December 2015 through November 2016, after one or more rainfall events, in areas at three different stages of natural regeneration conduction: treatment 1 = 4 years of natural regeneration after eucalyptus harvesting; treatment 2 = 10 years of natural regeneration after eucalyptus harvesting; and treatment 3 = 43 years without human intervention. At each treatment, we established three plots (20 x 20 m) with a 10-m interplot spacing.
Rain gauges were made using PVC pipes and fittings with a 78.5-cm catchment area and 20-cm height, thus yielding a 1.6-L storage capacity. Gross precipitation (GP) was measured with a rain gauge installed near the plots, with a maximum distance of 30 m among treatments. We cared to eliminate any barrier that could influence rainwater catchment. GP was calculated by the equation:
Where GP is gross precipitation (mm), V is the rain gauge volume (mL), and A is the rain gauge catchment area (cm2).
Throughfall (Tf) was obtained from 108 rain gauges distributed along the nine plots, totalizing 36 gauges per treatment. To calculate Tf, we used the equation:
Where Tf is throughfall (mm), V is the volume of each rain gauge (mL), A is the catchment area of each gauge (cm2), and ni is the number of gauges.
Stemflow (Sf) was measured on all trees having diameter at breast height (DBH) > 5 cm. For that, trees were involved by a polyurethane gutter, which conducted the water that drained through the stem surface to Eq-1
20-L collectors. Overall, we monitored 185 trees (4, 24 and 157 trees for treatments 1, 2 and 3, respectively), with a total 210 collectors. To assess water balance in the area, we followed the methodological survey conducted by Honda (2013), who recommended measuring Sf on all trees in the sampling plot, by dividing the total collected volume by the plot area. This procedure enabled us to avoid either underestimating the collected volume whenever tree crowns overlapped or overestimating it when individuals were sparsely distributed. To calculate Sf, we used the equation:
Where Sf is stemflow (mm), Vt is the total collected volume (L), and A is the plot area (m2).
Net precipitation (NP) corresponded to the sum of stemflow and throughfall in each forest formation. Thus, NP was calculated by the equation:
NP = Tf + Sf,
Where NP is net precipitation (mm), Tf is throughfall (mm), and Sf is stemflow (mm).
Lastly, rainfall interception (RI) was obtained by the difference between gross precipitation and net precipitation in each forest formation, according to the equation:
RI = GP - NP,
Where RI is rainfall interception (mm), GP is gross precipitation (mm), and NP is net precipitation (mm).
In order to detect differences among treatments, we performed an analysis of covariance (ANCOVA) and Tukey’s test at 95% confidence level, using software R 3.1.3.
3. RESULTS
We performed a total 21 field collections. Along the 12 months of monitoring, we recorded a total 1340 mm of rainfall. Tf decreased from treatments 1 to 3 (Table 1), which is coherent with the plant cover in each area. RI also increased in that same direction. The total Tf recorded at treatment 1 was similar to the GP recorded in the study. This can be justified by the presence of a vegetation composed of grasses and/or shrubs covering an extensive area of that treatment, which favors the occurrence of low interception or even of no interception at all thereat (Table 1).
Tf ranged from 98% to 102% of the total GP at treatment 1, from 87% to 102% at treatment 2, and from 68% to 98% at treatment 3 (Table 1), and the analysis of covariance on Tf data showed a significant difference among treatments. This suggests that increasing forest maturity is capable of causing significant differences in Tf (Table 2). The few rainfall events that yielded Tf values higher than GP ones were not able to interfere with the mean Tf of treatments to the point that they would exceed 100%. The Tf values of treatments were subjected to linear regression analysis (Figure 1-A, B, C). All areas showed a strong relationship between Tf and GP, with coefficients of determination (R²) being as high as 0.99 for all treatments. Thus, 99% of the Tf was explained by GP. Additionally, this relationship was significant at the 95% confidence level at all treatments. From the linear equation of each treatment (Figure 1-A, B, C), we estimated the GP volume needed for Tf to occur. We found values higher than 0.99, 1.02, and 1.13 mm for treatments 1, 2, and 3, respectively (Table 2; Figure 1).
Sf contributed the least to water balance (Table 1). However, Sf values increased with increasing plant cover, and the analysis of covariance of this component revealed significant differences among treatments (Table 2). Linear regression of the GP x Sf relationship at the studied treatments yielded coefficients of determination ranging from 0.87 to 0.94 (Figure 1-D, E, F). The correlation index was 0.93, 0.96, and 0.97 at treatments 1, 2, and 3, respectively, which indicates a strong correlation between the tested variables, while also suggesting a possible interference of aspects other than just GP. The relationship was significant at all treatments. With the linear regression model equation of each treatment, we estimated the GP values needed for Sf to occur. We found values equal to or higher than 0.9, 9.35, and 5 mm for treatments 1, 2 and 3, respectively.
The NP collected at treatment 1 was the highest of all treatments (100%), followed by treatments 2 (96%) and 3 (88%) (Table 1). The linear regression between GP and NP yielded coefficients of determination of 0.99 at all treatments (Figure 1-G, H, I). The correlation coefficient was higher than 0.99 at all treatments, being significant in all of them.
When negative RI values recorded at treatments 1 and 2 were excluded from the dataset, we obtained mean RI values of 1% and 7% at treatments 1 and 2, respectively. The analysis of covariance performed Eq-3
Eq-4
on all three treatments revealed significant differences in RI (Table 2). The coefficients of determination of
the GP x RI relationship were the lowest ones compared with the relationships of GP with Tf, Sf, and NP. The
Table 1 – Mean values, in mm and %, of gross precipitation (GP), throughfall (Tf), stemflow (Sf), net precipitation (NP), and rainfall interception (RI) at treatments 1 (area with 4 years of natural regeneration after eucalyptus harvesting), 2 (area with 10 years of natural regeneration after eucalyptus harvesting), and 3 (area with 43 years without human intervention).
Tabela 1 – Valores médios, em mm e %, da precipitação em aberto (GP), precipitação interna (Tf), escoamento pelo tronco (Sf), precipitação efetiva (NP), e interceptação (RI) nos tratamentos 1 (área com 4 anos de regeneração natural após corte de eucalipto), 2 (área com 10 anos de regeneração natural após corte de eucalipto), e 3 (área com 43 anos sem intervenção humana).
GP Tf Sf NP RI
mm % mm % mm % mm % mm %
Dec. 7 1 100 7 0 9 9 0.004 0.01 70.3 9 9 1.0 1 Jan. 363 100 371 102 0.061 0.02 370.8 102 -7.8 - 2 Feb. 200 100 199 100 0.029 0.01 199.1 100 0.9 0 Mar. 170 100 168 9 9 0.016 0.01 167.9 9 9 1.8 1 Apr. 0 - 0 - 0.000 - 0.0 - 0.0 -Treatment 1 May 139 100 139 100 0.015 0.01 139.3 100 0.0 0 Jun. 112 100 112 9 9 0.026 0.02 111.5 9 9 0.6 1 Jul. 3 100 3 100 0.000 0.00 3.0 9 3 0.2 7 Aug. 2 8 100 2 7 9 8 0.003 0.01 27.5 9 8 0.5 2 Sep. 1 9 100 1 9 9 9 0.003 0.01 19.0 9 9 0.1 1 Oct. 132 100 130 9 8 0.013 0.01 130.1 9 8 2.4 2 Nov. 102 100 102 100 0.011 0.01 101.6 100 0.3 0 Total 1340 100 1340 100 0.180 0.01 1340.1 100 0 0
GP Tf Sf NP RI
mm % mm % mm % mm % mm %
Dec. 7 1 100 6 6 9 2 0.043 0.06 65.7 9 2 5.7 8 Jan. 363 100 369 102 0.765 0.21 370.2 102 -7.1 - 2 Feb. 200 100 199 9 9 0.431 0.22 199.0 100 1.0 0 Mar. 170 100 159 9 4 0.217 0.13 159.5 9 4 10.3 6 Apr. 0 - 0 - 0.000 - 0.0 - 0.0 -Treatment 2 May. 139 100 121 8 7 0.274 0.20 121.2 8 7 17.7 1 3
Jun. 112 100 9 8 8 8 0.267 0.24 98.7 8 8 13.4 1 2 Jul. 3 100 3 8 7 0.001 0.03 2.8 8 7 0.4 1 3 Aug. 2 8 100 2 6 9 2 0.063 0.23 25.7 9 2 2.3 8 Sep. 1 9 100 1 9 100 0.042 0.22 19.1 100 0.0 0 Oct. 132 100 127 9 6 0.271 0.20 127.3 9 6 5.2 4 Nov. 102 100 9 8 9 6 0.235 0.23 97.7 9 6 4.2 4 Total 1340 100 1284 9 6 2.610 0.19 1286.9 9 6 52.9 4
GP Tf Sf NP RI
mm % mm % mm % mm % mm %
Dec. 7 1 100 5 0 7 0 0.407 0.57 50.6 7 1 20.8 2 9 Jan. 363 100 345 9 5 4.081 1.12 349.3 9 6 13.8 4 Feb. 200 100 181 9 0 2.049 1.02 182.5 9 1 17.5 9 Mar. 170 100 130 7 7 2.165 1.28 132.5 7 8 37.3 2 2 Apr. 0 - 0 - 0.000 - 0.0 - 0.0 -Treatment 2 May. 139 100 111 8 0 1.603 1.15 112.4 8 1 26.5 1 9
Figure 1 – The relationships between: gross precipitation and throughfall at (A) treatment 1, (B) treatment 2, and (C) treatment 3; gross precipitation and stemflow at (D) treatment 1, (E) treatment 2, and (F) treatment 3; and gross and net precipitation at (G) treatment 1, (H) treatment 2, and (I) treatment 3. Floresta das Águas Perenes RPPN, Brotas municipality, São Paulo state, southeastern Brazil. Study period: December 3, 2015 through November 24, 2016.
correlation coefficients at treatments 1, 2, and 3 were 0.42, 0.83, and 0.71, respectively.
4. DISCUSSION
The Tf values that were higher than 100% at treatments 1 and 2 correspond to readings with mean Tf higher than GP. Moura et al. (2009), Togashi et al. (2012), and Lorenzon et al. (2013) have also reported such incoherence. The authors attributed it to the irregular spatial distribution of rainfall across an elongated river basin, as well as to the distance between the GP rain gauge and the plots, the altitudinal differences among plots, and the unevenness of plant cover.
Theoretically, it is impossible to obtain Tf values higher than GP, due to the portion of rainwater that gets intercepted by vegetation (Moura et al., 2009). However, it should be noted that the area at treatment 1 is practically devoid of trees, and thus the RI recorded therein was practically null. Another relevant aspect is that the Tf values that were higher than GP were recorded precisely in the month with highest rainwater volumes (January 2016), when rainfall events were characterized as storms with strong winds.
Therefore, these differences in Tf may be related to variations in the structure of plant cover, especially at treatment 2, where branches frequently overlapped,
Test for equal means, adjusted for covariate Throughfall (Tf)
Sum of sqrs df Mean square F p (same) Adj. Means 325.52 1.00 325.52 12.04 0.0013 Adj. Error 1054.06 39.00 27.03
Adj. Total 1379.57 40.00
Homogeneity (equality) of slopes
F 1.05
p (same) 0.3113
Test for equal means, adjusted for covariate Stemflow (Sf) Sum of sqrs df Mean square F p (same)
Adj. Mean 335.85 1.00 335.85 12.87 0.0010 Adj. Error 965.87 37.00 0.26
Adj. Total 130.17 38.00
Homogeneity (equality) of slopes
F 395.70
p (same) 0.0000
Test for equal means, adjusted for covariate Net Precipitation (NP)
Sum of sqrs df Mean square F p (same) Adj. Mean 257.76 1.00 257.76 9.50 0.0038 Adj. Error 1058.73 39.00 271.47
Adj. Total 1316.49 40.00
Homogeneity (equality) of slopes
F 0.50
p (same) 0.4839
Test for equal means, adjusted for covariate Rainfall Interception (RI)
Sum of sqrs df Mean square F p (same) Adj. Mean 372.82 1.00 372.82 18.94 0.0001 Adj. Error 649.52 33.00 196.82
Adj. Total 1022.33 34.00
Homogeneity (equality) of slopes
F 60.89
p (same) 0.0000
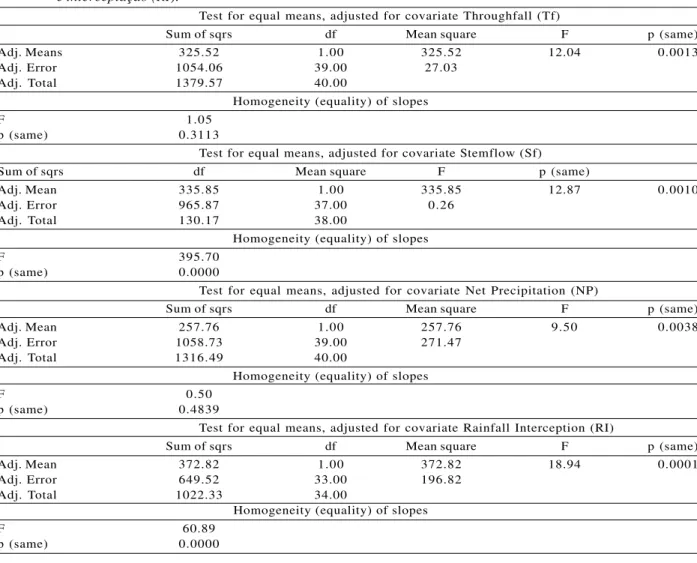
Table 2 – Analysis of covariance of throughfall (Tf), stemflow (Sf), net precipitation (NP), and rainfall interception (RI).
which might have contributed to the occurrence of dripping on some rain gauges (Camargo et al., 1999); to the irregular topography, size and spacing between trees (Neal et al., 1991); or even to the high heterogeneity of precipitations, due mainly to the turbulence of air currents (Togashi et al., 2012).
Honda (2013) reported Tf values of 95%, 89%, and 80% to the phytophysiognomies Typical Cerrado, Dense Cerrado, and Cerradão, respectively. In another study conducted on a Cerrado area, Lima and Nicolielo (1983) reported a Tf of 73%. Leopoldo and Conte (1985), on the other hand, obtained a Tf value of 80% at São Manuel municipality. Therefore, Tf in Cerrado environments may range from 73% to 95%. In tropical forests, Bruinjzeel (1990) and Oliveira et al. (2008) reported Tf values within the range of 75% to 96%. Our Tf data are within the range regarded as reference values. In a study performed at Assis municipality, Honda (2013) concluded that the higher the rainwater volume and the lower the biomass in Cerrado gradients, the higher is the volume of rainwater that reaches the soil. In other words, there is a positive correlation between GP and plant biomass. We observed a similar trend in our study. The R² values found in the Tf x GP relationship at all areas were similar to the values obtained by Arcova et al. (2003), Diniz et al. (2013), Lorenzon et al. (2013), and Togashi et al. (2012).
The Sf values we obtained differed from those reported by Honda (2013) in a study performed using the same tree selection criterion we adopted for Sf quantification (i.e., DBH > 5 cm). Sf was 0.7% at the Typical Cerrado area, 1.5% at the Dense Cerrado, and 2.4% at the Cerradão (Honda, 2013). Leopoldo and Conte (1985), on the other hand, found even higher values in Cerrado areas at São Manuel municipality, where Sf was 2.9%. In other vegetation types, like Atlantic Forest environments, Sf has been reported to range from 0.2% to 1.1% of GP (Arcova et al., 2003; Moura et al., 2009; Freitas et al., 2013).
In light of the fact that the studied environments are at different stages of natural regeneration, it is important to compare them with studies that evaluated Sf through a similar perspective. In that sense, Diniz et al. (2013) evaluated precipitation in Atlantic Forest remnants at different stages of succession and found Sf values of 0.5% on trees with DBH > 10 cm. Oliveira Júnior and Dias (2005), on the other hand, conducted a study in an Atlantic Forest remnant at early stage
of succession and reported a Sf value of 1.7% to trees with DBH > 5 cm. Both those values approach the ones we found at the studied treatments.
Several factors may be involved in causing the disparities we observed between the results we found and the ones reported in the literature. For instance, not all studies follow the same standards (like adopting the same tree selection criterion), and some of them may not even adopt the most recommended method, namely choosing a representative area and measuring Sf on all individuals in the plot (Hanchi and Rapp, 1997). These methodological differences usually occur due to the difficulty of measuring Sf on all arboreal individuals or even of accurately determining a representative area for the study (Aboal et al., 1999).
Besides the strong relationship between Sf and precipitation features, factors such as tree size; bark roughness; branch angle, inclination, and tortuosity; leaf density; and the relationship between neighboring trees are all relevant contributors to the volume of water that drains through stem surfaces (Aboal et al., 1999; Li et al., 2008; Stan Ii and Levia Jr, 2010; Bialkowski and Buttle, 2015; Honda et al., 2015; Terra et al, 2017). Thus, in areas of Cerrado, it might be possible that water not only takes different pathways but also reaches the soil in different amounts, since the Cerrado biome has different physiognomies with variable gradients of biomass, community structure and tree architecture, encompassing areas ranging from grasslands to forest formations (Durigan et al., 2002; Honda, 2013; Honda et al., 2015).
GP values lower than the ones estimated by the equation obtained by the regression between Sf and GP would probably not suffice to produce Sf. Therefore, in that case, rainwater would be retained in tree crowns or on tree stems, ending up returning to the atmosphere through evaporation, or even dripping from leaves directly on the ground, thus leading to Tf formation. Analogously, Shinzato et al. (2011) reported that GP values equal to or higher than 11.0, 6.6, and 8.2 mm suffice for Sf to occur in a seasonal semideciduous forest and in populations of E. cloeziana and Pinus
sp., respectively.
of palm trees in the former, which may facilitate rainwater catchment and its subsequent drainage through stem surfaces (Togashi et al., 2012; Lorenzon et al., 2015; Corrêa et al., 2016).
Considering the occurrences in which we obtained NP values higher than GP, we also recorded a large rainwater volume before and during those rainfall events. This could be due to the reduced capacity of tree crows to store water during events of very heavy rainfall (Tobon Marin et al., 2000). Literature reports indicate a high variation in NP among different vegetation types. In seasonal semideciduous Atlantic Forest environments, NP has been reported to range from 81.4% to 87.06% (Castro et al., 1983; Arcova et al., 2003; Oliveira Júnior and Dias, 2005; Alves et al., 2007). Diniz et al. (2003) studied that same vegetation type, but with plant formations of different ages. The authors observed that in a 20-year-old vegetation, NP was 77.89%, while in a 30-year-old vegetation it was 79.26% and in a 60-year-old vegetation it was 76.98%. Thus, comparing the 20- and 60-year-old areas, NP showed a decreasing trend with increasing forest age.
In the Amazon, where vegetation is characteristically dense, studies have reported NP values of 78.5% to the Caxiuanã National Forest (Oliveira et al., 2008), 78% to Amazonas state (Franken et al., 1982a), 87.1% to southeastern Pará state, and 88.4% to Rondônia state (Ubarana, 1996). In Cerrado environments, NP ranged from 96% to 80% among physiognomies of Typical Cerrado, Dense Cerrado, and Cerradão (Honda, 2013).
The linear regression results of the NP x GP relationship corroborate the fact that practically all rainwater in areas at early stage of regeneration is converted to NP, due to the low density of arboreal individuals therein. In the literature, there are reports of R2 values for such relationship of 0.99, by Oliveira
Júnior and Dias (2005); 0.96, by Diniz et al. (2013); and 0.99 and 0.98, by Lorenzon et al. (2013), all of which are compatible with the values found in our study. RI at treatment 1 may also reflect evaporation of the collected water, in view of the exposure of rain gauges to full sun. In order to avoid evaporation, the equipment was built in such a way that it would reduce that loss to a minimum. Still, we recorded negative RI values after rainfall events in January at treatments 1 and 2. These records correspond to NP values higher than 100% of GP, which thus indicates that no RI occurred, but rather NP increased. These data may have been influenced
by meteorological conditions regarding rainfall volume, intensity and duration; wind speed; and the interval between rainfall events (Crockford and Richardson, 2000). The recorded data may also have some relationship with vegetation conditions and forest-related features, such as plant architecture, canopy structure, community composition, species heterogeneity, and especially canopy density and leaf area (Ávila et al., 2014).
In less dense phytophysiognomies, i.e., those with smaller and more sparsely distributed trees, rainwater retention is minimal. Additionally, the transition to denser phytophysiognomies leads to an increase in community density, plant size, and leaf biomass, and thus to a consequent increase in rainfall interception capacity (Honda, 2013). The same processes can be observed in forests at different stages of natural regeneration, as indicated by the gradual increase in the volume of intercepted rainwater with increasing biomass along the study areas.
There are reports in the literature of RI values ranging from 4.5% to 24% in tropical forests (Bruinjzeel, 1990). Specifically in the Atlantic Forest, for instance, studies have reported RI values ranging from 8.6% to 18.6% (Castro et al., 1983; Arcova et al., 2003; Oliveira Júnior and Dias, 2005; Moura et al., 2009; Freitas et al., 2013; Sá et al., 2016). In the Cerrado, Leopoldo and Conte (1985) reported RI values of 17% to the Cerradão, while Lima and Nicolielo (1983) obtained 27%. Honda (2013) detected values of 5%, 9%, and 20% in the physiognomies Typical Cerrado, Dense Cerrado, and Cerradão, respectively. All values reported by these studies approach the ones found in our work.
The determination and correlation coefficients we observed show that RI is little explained by GP. Thus, RI might be influenced by other aspects, like rainfall intensity and the occurrence of winds during rainfall events (Moura et al., 2009). Diniz et al. (2013) and Lorenzon et al. (2013) also found low values of those coefficients, which were even lower than 0.57 for the GP x RI relationship.
reducing the impact of raindrops, soil thereat is compacted, which thus hampers water infiltration and percolation through the soil profile, thereby propitiating the occurrence of surface runoff. On such a scenario, Sf is crucial for recharging soil water. In that sense, Sf has been shown by several studies performed on arid and semiarid areas (Garcia-Estringana et al. 2010; Yuan et al., 2016; Zhang et al., 2017) to be the only pathway of water maintenance enabling plant development. Much research is still necessary for us to fully understand the dynamics of water balance in the soil-plant-atmosphere system. Studies aiming to comprehend the development and management of vegetation with a focus on soil restoration for water recharge are urgently needed. Lastly, we conclude our study with the following question: From what moment is there an effective contribution to soil water recharge along the development of forest species in areas undergoing restoration?
5. CONCLUSION
Throughfall and net precipitation decreased with advancing natural regeneration, whereas stemflow and rainfall interception increased with increasing vegetation development. When data was analyzed for its linear trend, the throughfall, stemflow, and net precipitation showed higher coefficients of determination, throughfall being the variable that contributed the most to the volume of water that reached the soil. Rainfall interception, on the other hand, showed weak correlation with gross precipitation, thus indicating that it might be influenced by other factors. Besides, interception was null in events of very intense rainfall, which shows that the forest canopy has a maximum rainwater retention capacity. Based on the analysis of covariance conducted on each rainwater component at each treatment, we conclude that there are significant differences among treatments according to their stage of natural forest regeneration.
6. ACKNOWLEDGMENTS
We thank Coordenação de Aperfeiçoamento de Pessoal de Nível Superior (CAPES), Conselho Nacional de Desenvolvimento Científico e Tecnológico (CNPq), and International Paper Co.
7. REFERENCES
Aboal JR, Jimenez MS, Morales D, Hernandéz JM. Rainfall interception in laurel forest in the Canary
Islands. Agricultural and Forest Meteorology. 1999;97:73-86.
Alves RF, Dias HCT, Oliveira Júnior JC, Garcia FNM. Avaliação da precipitação efetiva de um fragmento de Mata Atlântica em diferentes
estádios de regeneração no município de Viçosa – MG. Revista Ambiente e Água. 2007;2(1):83-93.
Arcova FCS, Cicco V, Rocha PAB. Precipitação efetiva e interceptação das chuvas por floresta de mata atlântica em microbacia experimental em Cunha – São Paulo. Revista Árvore.
2003;27(2):257-62.
Ávila LF, Mello CR, Pinto LC, Silva AM. Partição da precipitação pluvial em uma microbacia hidrográfica ocupada por mata atlântica na Serra da Mantiqueira, MG. Ciência Florestal.
2014;24(3):583-95.
Bialkowski R, Buttle JM. Stemflow and throughfall contributions to soil water recharge under trees with differing branch architectures. Hydrological Processes. 2015;29(18):4068–82.
Bruinjzeel LA. The hydrological cycle in moist tropical forest. In: Bruijnzeel LA. Hydrology of moist tropical forests and effects of conversion: a state of knowledge review. Amsterdam: IAHS; 1990. p.5-38.
Camargo MBP, Hubbard KG. Spatial and temporal variability of daily weather variables in sub-humid and semiarid areas of the United States high plains. Agricultural and Forest Meteorology. 1999;93(2):141-8.
Castro PS, Valente OF, Coelho DT, Ramalho RS. Interceptação da chuva por mata natural secundária na região de Viçosa, MG. Revista Árvore, 1983;7(1):76-89.
Centro de Pesquisas Meteorológicas e Climáticas Aplicadas a Agricultura – Cepagri. Dados meteorológicos. [acessado em: 23 de maio de 2016]. Disponível em: http://www.cpa.unicambr/ index.html.
stemflow and gross precipitatio( ):Revista Árvore. 2016;40(3):387-93, 2016.
Crockford RH, Richardson DP. Partitioning of rainfall into throughfall, stemflow and
interception: effect of forest type, ground cover and climate. Hydrological Processes.
2000;14(1617):2903-20.
Diniz AR, Pereira MG, Balieiro FC, Machado DL, Menezes CEG. Precipitação e aporte de nutrientes em diferentes estádios sucessionais de floresta atlântica, Pinheiral – RJ. Ciência Florestal. 2013;23(3):389-99.
Durigan G, Nishikawa DLL, Rocha E, Silveira ER, Putilano FM, Regalado RB, et al. Caracterização de dois estrados da vegetação em uma área de cerrado no município de Brotas, São Paulo, Brasil. Acta Botânica Brasileira. 2002;16(3):251-62.
Empresa Brasileira de Pesquisa Agropecuária -Embrapa. Centro Nacional de Pesquisa de Solos. Sistema brasileiro de classificação de solos. Rio de Janeiro: 1999. 412p.
Franken W, Leopoldo R, Matsui E, Ribeiro MNG. Estudo da interceptação da água da chuva em cobertura florestal Amazônica do tipo terra firme. Acta Amazonica. 1982a;12(2):327-31.
Freitas JPO, Dias HCT, Barroso THA, Poyares LCQ. Distribuição da água da chuva em Mata Atlântica. Ambiente e Água. 2013;8(2):100-8.
Garcia-Estringana P, Alonso-Blázquez N, Alegre J. Water storage capacity, stemflow and water funneling in Mediterranean shrubs. Journal of Hydrology. 2010;389:363-72.
Hanchi A, Rapp M. Stemflow determination in florest stands. Forest Ecology and Management. 1997;97:231-5.
Honda EA, Mendonça AH, Durigan G. Factors afecting the stemflow of trees in the Brazilian Cerrado. Ecohydrology. 2015;8:1351-62.
Honda EA. Repartição da água da chuva sob o dossel e umidade do solo no gradiente
fisionômico da vegetação do Cerrado [tese]. São Carlos: Escola de Engenharia de São Carlos da Universidade de São Paulo; 2013.
Leopoldo PR, Conte ML. Repartição da água de chuva em cobertura vegetal com características de cerradão. In: Anais do 6ª Simpósio Brasileiro de Hidrologia e Recursos Hídricos, 1985, São Paulo. São Paulo: ABRH; 1985. p.212-20.
Li XY, Liu LY, Gao SY, Ma YJ, Yang Z. Stemflow in three shrubs and its effect on soil water
enhancement in semiarid loess region of China. Agricultural and Forest Meteorology.
2008;148:1501-7.
Lima WP, Nicolielo N. Precipitação efetiva e interceptação em florestas de pinheiros tropicais e em reserva de cerradão. IPEF. 1983(24)43-6.
Lorenzon AS, Dias HCT, Leite HG. Precipitação efetiva da chuva em um fragmento florestal com diferentes estágios de regeneração. Revista Árvore. 2013;37(4):619-27.
Lorenzon AS, Dias HCT, Tonello KC. Escoamento da água da chuva pelo tronco das árvores em uma floresta estacional semidecidual. Revista Árvore. 2015;39(3):423-30.
Moura AESS, Correa MM, Silva ER, Ferreira RLC, Figueiredo AC, Possas JMC. Interceptação das chuvas em um fragmento de floresta da Mata Atlântica na Bacia do Prata, Recife, PE. Revista Árvore. 2009;33(3):461-9.
Neal C, Robson AJ, Hall RL, Ryland G, Conway T, Neal M. Hydrological impacts of hardwood plantation in lowland Britain: preliminary findings on interception at a forest edge, Black Wood, Hampshire, Southern England. Journal of Hydrology. 1991;127:1/4:349-65.
Oliveira Júnior JC, Dias HCT. Precipitação efetiva em fragmento secundário da mata atlântica. Revista Árvore. 2005;29(1):9-15.
Oliveira LL, Costa RF, Costa ACL, Sousa FAS, Braga A. Modelagem da interceptação na floresta nacional de caxiuanã, no leste da Amazônia. Revista
Brasileira de Meteorologia. 2008;23(3):318-26.
Shinzato ET, Tonello KC, Gasparoto EAG, Valente ROA. Escoamento pelo tronco em diferentes povoamentos florestais na Floresta Nacional de Ipanema em Iperó, Brasil. Scientia Forestalis. 2011;39(92):395-402.
Stan Ii JT, Levia Jr DF. Inter-and intraspecific variation of stemflow production from Fagus grandifolia Ehrh. (American beech) and
Liriodendron tulipifera L. (yellow poplar) in relation to bark microrelief in the eastern United States. Ecohydrology. 2010;3:11-10.
Terra MCNS, Mello CR, Mello JMM, Oliveira VA, Nunes MH, Silva VO, et al. Stemflow in a neotropical forest remnant: vegetative
determinants, spatial distribution and correlation with soil moisture. Trees. 2017;32(1):323-35.
Tobon Marin C, Bouten W, Sevink J. Gross rainfall and its partitioning into throughfall, stemflow and evaporation of intercepted water in four forest ecosystems in western Amazonia. Journal of Hydrology. 2000;237(1):40-57.
Togashi HF, Montezuma RCM, Leite AF.
Precipitação incidente e fluxo de atravessamento das chuvas em três estágios sucessionais de Floresta Atlântica no maciço da Pedra Branca, Rio de Janeiro. Revista Árvore. 2012;36(5):907-17.
Ubarana VN. Observation and modelline of raifall interception at two experimental sites in Amazônia. In: Gash J, NobreCA,RobertsJM, Victoria R, editors. Amazônian deforestation and climate. New York, John Wiley and Sons, 1996. p.151-62.
Yuan C, Gao G, Fu B. Stemflow of a xerophytic shrub (Salix psammophila) in northern China: Implication for beneficial branch architecture to produce stemflow. Journal of Hydrology. 2016;539:577-88.