Genetic evaluation for persistency of lactation in Holstein cows
using a random regression model
Jaime Araujo Cobuci
1, Ricardo Frederico Euclydes
2, Claudio Napolis Costa
3, Robledo de Almeida Torres
2,
Paulo Sávio Lopes
2and Carmen Silva Pereira
21
Departamento de Zootecnia, Universidade Federal do Rio Grande do Sul, Porto Alegre, RS, Brazil.
2Departamento de Zootecnia, Universidade Federal de Viçosa, Viçosa, MG, Brazil.
3
Embrapa Gado de Leite, Juiz de Fora, MG, Brazil.
Abstract
A model for analyzing test day records including both fixed and random coefficients was applied to the genetic evalu-ation of first lactevalu-ation data for Holstein cows. Data comprising 87045 test-day milk yield records from calving between 1997 and 2001 from Holstein herds in 10 regions of the Brazilian state of Minas Gerais. Six persistency of lactation measures were evaluated using breeding values obtained by random regression analyses. The Wilmink function was used to model the additive genetic and permanent environmental effects. Residual variance was constant throughout lactation. Ranking for animals did not change among criteria for persistency measurements, but ranking changes were observed when the estimated breeding value (EBV) for persistency of lactation was contrasted with those estimated for 305-day milk yield (305MY). The rank correlation estimates for persistency of lactation and 305MY were practically the same for sire and cows, and ranged from -0.45 to 0.69. The EBVs for milk yield during lactation for sires producing daughters with superior 305MY indicate genetic differences between sires regarding their ability to transmit desirable persistency of lactation traits. This suggests that selection for total lactation milk yield does not identify sires or cows that are genetically superior in regard to persistency of lactation. Genetic evalua-tion for persistency of lactaevalua-tion is important for improving the efficiency of the milk producevalua-tion capacity of Holstein cows.
Key words:genetic evaluation, persistency of lactation, rank correlation, random regression models.
Received: October 11, 2005; Accepted: September 19, 2006.
Introduction
Milk production traits have traditionally held the leading position as regards selection goals but in dairy cat-tle breeding the emphasis is gradually shifting from in-creasing volume to improving the efficiency of production. Increasing attention has also been paid to other traits that are helpful for improving the management of dairy herds and for increasing the efficiency of breeding schemes. Functional traits must also be considered in selection, be-cause these traits have a direct impact on total economic merit (Groenet al., 1997).
The recent recognition of the importance of func-tional traits in cattle and the possible role of such traits in avoiding deterioration and possibly improving functional traits during breeding has stimulated research in many
countries (Interbull, 1999). For example, in the European Union increased milk production is not economically ad-vantageous due to the existing quota system (Gengler, 1996; Tekerliet al., 2000). Although most of the incomes of European breeders are generally derived from the sale of milk, they realize that single trait selection for milk yield will not necessarily yield for them the optimal genetic re-sponse in overall economic merit and profit potential. Therefore, there is a demand for the genetic evaluation of other traits to aid in selection decisions. Breeders try, among other measures, to reduce the costs of production by improving persistency of lactation (Tekerliet al., 2000).
Persistency of lactation can be defined as the ability of a cow to maintain milk production after peak yield, with cows being persistent if they tend to maintain their peak yield within a lactation period. Improved persistency of lac-tation can contribute to reducing the cost of the production system because lactation persistency is associated with feeding and health costs, reproductive performance, resis-tance to disease and the return from milk considering a 305-day production cycle (Sölkner and Fuchs, 1987;
www.sbg.org.br
Send correspondence to Jaime Araujo Cobuci. Departamento de Zootecnia, Universidade Federal do Rio Grande do Sul, Av. Bento Gonçalves 7712, Bairro Agronomia, 91540-000 Porto Alegre, RS, Brazil. E-mail: [email protected] or jcobuci@universiabrasil. net.
Dekkerset al., 1996, 1998). It may be desirable to select for increased persistency without increasing peak yield, the lat-ter subjecting the cow to undesirable stress, health and fer-tility problems (Kruipet al., 1996).
Although the notion of persistency of lactation yield seems clear, definitions are inconsistent (Grossmanet al., 1999) and no consensus has yet been reached. Definitions based on the ratio between milk yields at different stages of lactation or on differences between milk yields at test-days during lactation are arbitrary and do not unique character-ize persistency because such parameters are not invariant with respect to the time period chosen (Rekayaet al., 2001). Several measurements of persistency have been pro-posed (Sölkner and Fuchs, 1987; Jaromzik et al., 1997; Jakobsenet al., 2002; Cobuciet al., 2004) but the proce-dure most widely used today to measure lactation persis-tency is based on the byproduct of the random regression test day model. These models have been extensively ap-plied to the evaluation of milk production traits since they allow a more precise assessment of the environmental ef-fects acting on these traits. The use of the random regres-sion test day model not only improves the accuracy of genetic evaluations but can also evaluate persistency be-cause the estimated breeding value (EBV) for various parts of the lactation can be calculated (Jamroziket al., 1997).
In this study we evaluated six different measures for describing persistency of lactation in Holstein cows in or-der to assess the most suitable of these measures for use in random regression test-day models for the genetic evalua-tion of persistency of lactaevalua-tion.
Material and Methods
Data consisted of 160,038 test-day milk yield records from Holstein cows calving between 1997 and 2001 in herds supervised by the Milk Recording Service of the Hol-stein Association of Minas Gerais State (ACGH-MG), in southeastern Brazil.
Data were edited for test-day records between 6 and 305 days in milk (DIM) of first parity cows and calving be-tween 18 and 48 months of age. After applying these crite-ria 87,045 records from 11,023 first lactation cows, daughters of 936 sires in 251 herds from Minas Gerais State were available for analyses.
We defined four age at calving classes (20 to 24, 25 to 29, 30 to 34 and 35 to 48 months) and four calving seasons (January through March, April through June, July through September and October through December) and combined them to produce 16 age-season classes. Cows in the same herd, year and month of milk recording defined the contem-porary group fixed effect. The model used for test-day milk yield was:
yijkl HYMi kmZjlm a Z p Z
m m jm jlm m jm jlm
= + + + +
= = =
∑
β∑
∑
1 3 1 3 1 3
eijkl,
whereyijklis recordlof cowjmade on the tthdays in milk of
the first lactation for a cow belonging to subclass k for
age-season of calving,HYMi is the fixed effect of
herd-year-month of test i;βkmis the fixed regression coefficient
of test-day milk yield as a function of DIM, which describes the shape of the lactation curve within the age-season sub-classes;ajmandpjmare random regression coefficients that
describe the genetic and permanent environmental effects on each animal, respectively;eijklis the random residual
ef-fect associated withyijkl;Zjlmis the covariable matrices
rep-resented by the Wilmink function in whichZj1m= (Zj11Zj12
Zj13)’ = (1 t DEX)’, and DEX =e-0,05.t,tandm= days in milk
after calving and the mthparameter of the function, respec-tively.
The Wilmink function (1987) used to model genetic and permanent environmental effects is represented by
y a= + +at a e− t
1 2 3
0 05,
, for t = days in milk.
It was assumed that
a p e ⎛ ⎝ ⎜ ⎜⎜ ⎞ ⎠ ⎟
⎟⎟~ N(0,V) with,V
G A P A R = ⊗ ⊗ ⎛ ⎝ ⎜ ⎜⎜ ⎞ ⎠ ⎟ ⎟⎟ 0 0 0 0 0 0 ,
whereGis the genetic covariance matrix of the random re-gression coefficients, assumed to be the same for all cows; Ais the additive genetic relationship matrix among ani-mals;⊗is the Kronecker product operator;Pis the perma-nent environment covariance matrix of the random regression coefficients, assumed to be the same for all cows;R= σI e2
, forIan identity matrix, andσe
2
the residual variance assumed to be constant throughout the lactation.
The solutions for the additive genetic random regres-sion coefficients of animal j are represented as
$′ =($ $ $ )
aj a a a1j 2j 3j . The estimated breeding value (EBV) of
animaljin the tthDIM is obtained by
(
)
EBVtj a j a t a ej j z taj
t = $ +$ +$ −. = ′ $
1 2 3
0 05
,
and the estimated breeding value for 305-day milk yield (EBV305MY)of animaljis obtained by the sum of the EBV of
eachtthDIM.
EBV EBVt
t 350 6 305 MY = =
∑
.Six different measures of persistency of lactation (PSi) based on EBVs for test-days milk yield in different
lactation periods were evaluated as follows:
(
)
PS
PS
1 280 60
2 106 205 6 105 = − =⎛⎝⎜ − ⎞ ⎠ = =
∑
∑
EBV EBVEBVt EBV
t t t ⎟ =⎛⎝⎜ − ⎞ ⎠ ⎟ = =
∑
∑
PS3 206 305 6 105EBVt EBV
(
)
(
)
PS
PS
PS
4 60
61 280
5 280
60 279
6 29
= −
= −
=
∑
∑
EBV EBV
EBV EBV
EBV
t
t
(
0−EBV90)
.According to these expressions low values of PS1
(Jamroziket al., 1997), PS2 (Jakobsenet al., 2002), PS3
(Jakobsenet al., 2002), PS4(Jamroziket al.(1997) and PS6
(Cobuciet al., 2004) indicate high persistency of lactation, which is the case for a high value of PS5(Jakobsenet al.,
2002).
The solutions for random regression coefficients for each animal were obtained by the restricted maximum like-lihood method using the expectation maximization algo-rithm (EM) of the REMLF90 program (Misztal, 2001). The convergence criterion was 10-9.
Results and Discussion
The average, standard deviation (SD) and range of the EBVs for each measure of persistency, 305-d milk yield (305MY) and random regression coefficients of the 936 sires included in the analyses are given in Table 1. The av-erages and SD of the EBVs for the measurements of persis-tency increased from PS2 to PS5. The average EBV was
negative for PS5, which showed a similar SD to PS4 and re-flects the way that the EBVs were measured. Overall, simi-lar magnitudes in the range of the EBVs were observed for the PS2, PS3, PS4and PS5persistency measures. This
simi-larity might be have been due to the fact that the measures were calculated based on EBVs for milk yield during dif-ferent lactation periods. In contrast, the PS1and PS6
mea-sures were estimated based on the differences between the EBVs for milk yield on two test-days during the lactation, with PS6differing from PS1by assuming that the peak yield
of Holstein cows under tropical conditions is reached after 60 days of lactation.
Substantial variation in the magnitude of the genetic random regression coefficients of the Wilmink function for milk yield was observed among sires, indicating the possi-ble presence of genetic variation in the shape of the lacta-tion curves of sires and daughters. Thea1coefficient
corre-sponds to the initial milk production, the a2 coefficient
expresses the rate of decline in milk production after peak yield and thea3coefficient represents the rate of increase in
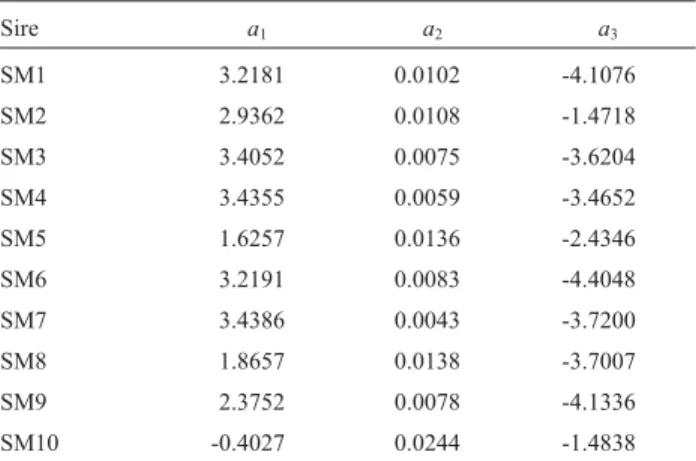
milk production gain until peak yield. The estimates of the genetic random regression coefficients for the top ten sires with more than 25 daughters ranked for milk yield are given in Tables 2.
The EBVs for the 305MY of the top ten sires with more than 25 daughters and their corresponding EBVs for each measure of persistency of lactation are given in Table 3, from which it can be seen that there are differences in the ranking of sires regarding the persistency measures and milk yield. Rank correlation between sire and cows EBVs for persistency and 305MY are given in Table 4. Correla-tions between EBVs for persistency of lactation were larger than 0.89 for both sires and cows suggesting that, in gen-eral, the different measures of persistency evaluated in this study provided similar ranking. However, correlation as low as 0.89 might indicate serious re-ranking for the top an-imals. The PS5 and PS6 measures of persistency were
recommended by Cobuciet al.(2004) for the genetic evalu-ation of cattle because these measures showed weaker ge-netic correlations (-0.31 and 0.31) with 305MY. The rank correlation between EBVs of sires for these two measures of persistency was -0.99. The dispersal of EBVs of sires with more than 25 daughters ranked for PS5and PS6
fol-lows a straight line, indicating that, with very few excep-tions, the two measures of persistency rank sires equally (Figure 1).
Rank correlation estimates between persistency of lactation and 305MY differed among persistency
measure-Table 1- Mean ± standard deviation (SD) and range of estimated breeding values for persistency of lactation (PS1 to PS6), 305-day milk yield
(305MY) and random regression genetic coefficients (a1,a2anda3) of the
Wilmink function for the sires of a population of Holstein cows.
Traits Mean ± SD Range
PS1 0.023 ± 0.966 5.442 to -3.769
PS2 1.668 ± 49.394 266.236 to -171.807
PS3 2.636 ± 90.885 510.386 to -316.105
PS4 2.812 ± 107.756 607.975 to -405.214
PS5 -2.390 ± 106.200 427.723 to -594.687
PS6 0.019 ± 0.874 4.896 to -3.512
305MY 11.117 ± 352.342 1378.87 to -1376.33
a1 0.024 ± 1.101 4.965 to -4.652
a2 9.0 x 10⁻⁵ ±0.004 0.024 to -0.017
a3 -0.047 ± 1.395 7.388 to -7.841
Table 2- Estimates of the genetic random regression coefficients (a1,a2
anda3) of the Wilmink function for the top ten sires with more than 25
daughters ranked for milk yield.
Sire a1 a2 a3
SM1 3.2181 0.0102 -4.1076
SM2 2.9362 0.0108 -1.4718
SM3 3.4052 0.0075 -3.6204
SM4 3.4355 0.0059 -3.4652
SM5 1.6257 0.0136 -2.4346
SM6 3.2191 0.0083 -4.4048
SM7 3.4386 0.0043 -3.7200
SM8 1.8657 0.0138 -3.7007
SM9 2.3752 0.0078 -4.1336
ments and were dependent on the way persistency was de-fined (Table 4). The lowest rank correlation estimates between persistency of lactation and 305MY were obtained for PS5and PS6,for both sires (-0.46 and 0.46) and cows
(-0.45 and 0.45), and, as expected, agree with the results of Cobuciet al.(2004). These estimates demonstrate the weak association between production and persistency of lacta-tion; thus, cows with the same milk production may present
different levels of persistency of lactation (Gengler, 1996; Jamroziket al., 1998; Van Der Lindeet al., 2000). These estimates also indicate that animals with larger EBVs for persistency of lactation are not exactly the same as those with larger EBVs for 305MY.
Except for PS2, the rank correlation estimates
be-tween persistency and the genetic random regression coef-ficienta2for sires and cows were close to unity, confirming
thata2is also a measure of persistency of lactation. Rank
correlation between a2 and MY305 was 0.45, the same
value obtained for the estimates between MY305 and PS5
and PS6.
The dispersal in ranking of 88 sires with more than 25 daughters is shown in Figure 2 for 305MY and PS5and
Fig-ure 3 for 305MY and PS6, the best sires for 305MY and
per-sistency being shown in the lower left corner of these figures. The top five sires for 305MY ranked 82, 83, 72, 70 and 87 for PS6while, in contrast, the top five sires for PS6
ranked 62, 40, 61, 88 and 8 for 305MY.
The percentage of sires or cows in common according to increasing levels of selection for persistency of lactation and 305MY are given in Figure 4 for sires and Figure 5 for
Table 3- Estimated breeding values for different measures of persistency of lactation (PS1to PS6) and 305-day milk yield (305MY) for the top ten sires
with more than 25 daughters ranked for milk yield.
Sire PS1 PS2 PS3 PS4 PS5 PS6 305MY
SM1 2.45 163.56 265.97 288.97 -252.15 2.08 1378.87
SM2 2.45 130.06 238.21 277.24 -264.05 2.17 1362.32
SM3 1.83 129.26 204.62 218.46 -186.02 1.54 1316.44
SM4 1.47 110.93 170.28 178.02 -146.97 1.22 1253.25
SM5 3.11 172.49 308.73 354.92 -333.10 2.75 1085.17
SM6 1.45 86.40 148.56 166.97 -152.38 1.26 905.09
SM7 1.79 94.96 174.07 202.68 -193.14 1.59 887.14
SM8 -2.21 -24.42 -137.82 -217.46 271.03 -2.21 866.83
SM9 1.26 68.59 123.68 142.76 -134.63 1.11 856.99
SM10 -1.17 -4.22 -65.83 -112.2 146.79 -1.20 854.48
Table 4- Rank correlation between estimated breeding values for different measures of persistency of lactation (PS1to PS6), 305-day milk yield
(305MY) and random regression genetic coefficients (a1,a2anda3) of sires (upper diagonal) and cows (lower diagonal).
Traits PS1 PS2 PS3 PS4 PS5 PS6 305MY a1 a2 a3
PS1 0.92 0.98 0.99 -0.99 0.99 0.49 -0.00 0.99 -0.18
PS2 0.93 0.97 0.94 -0.89 0.89 0.69 0.25 0.88 -0.48
PS3 0.98 0.97 0.99 -0.96 0.96 0.59 0.11 0.96 -0.32
PS4 0.99 0.95 0.99 -0.98 0.98 0.53 0.04 0.98 -0.23
PS5 -0.99 -0.90 -0.97 -0.99 -0.99 -0.45 0.05 -0.99 0.13
PS6 0.99 0.90 0.97 0.99 -0.99 0.45 -0.05 0.99 -0.13
305MY 0.50 0.69 0.59 0.53 -0.46 0.46 0.81 0.44 -0.71
a1 -0.03 0.23 0.08 0.01 0.07 -0.07 0.81 -0.06 -0.76
a2 0.99 0.90 0.97 0.99 -0.99 0.99 0.45 -0.08 -0.11
a3 -0.09 -0.42 -0.23 -0.14 0.04 -0.04 -0.65 -0.75 -0.02
cows. At high selection intensities (<10%) there are few an-imals in common but, as expected, the percentage increases as the percentage of animals selected for 305MY increases. There were no significant differences between the PS1, PS3, PS4, PS5 and PS6 measurements, while the PS2 mea-surement showed the lowest percentages of animals in common.
The EBVs for milk yield across lactation for the top five sires for high 305MY with more than 25 daughters are shown in Figure 6. The EBV curves indicate genetic differ-ences between the best top five sires selected for the milk yield. Similarly, the EBVs for milk yield across lactation of the top five sires ranked for PS6are given in Figure 7, which
also shows the genetic differences between sires in terms of the persistency of lactation of their daughters. Thus, com-parison between the EBVs of sires for persistency or milk yield across lactation (Figures 6 and 7) reveals that the curves differ for sires with higher EBV for 305MY or PS6,
confirming the weak association between 305MY and per-sistency of lactation. Additionally, the top five sires (SM1 to SM5) for 305MY ranked respectively 82, 83, 72, 70 and 87 for PS6while, in contrast, the top five sires (SP1 to SP5)
for PS6 ranked 62, 40, 61, 88 and 8 for 305MY.
The trends in estimated breeding values of sires and cows across lactation according to the year of birth of the cows is shown in Figure 8, from which it can be seen that there is a clear difference in average EBVs across the years. In the earlier years the curves are flat, and differences be-come clear (particularly after early lactation) in the last
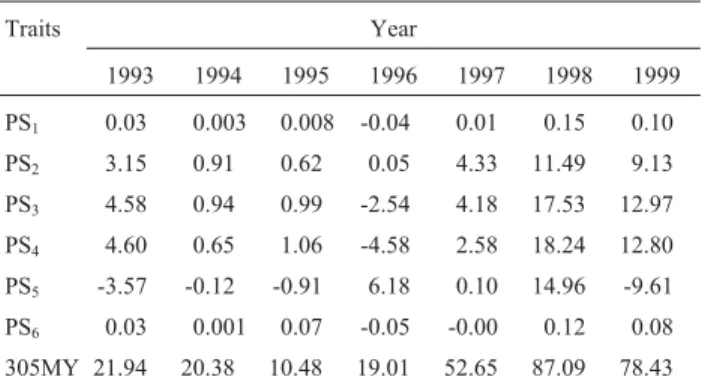
three years, indicating a positive trend regarding improved 305MY. Average EBVs of sires for persistency of lactation and 305-day milk yield according to the birth year of cows is shown Table 5. Figure 9 clearly demonstrates a positive trend for milk yield, but no significant trend in average EBVs of sires for persistency in the 1993-1999 period.
Overall, these results indicate that an increase in 305MY may not lead to improvement in the level of persis-tency of lactation unless selection for 305MY also takes
Figure 2- Dispersal in ranking of sires with more than 25 daughters for 305-day milk yield (305MY) and persistency of lactation (PS5).
Figure 3- Dispersal in ranking of sires with more than 25 daughters for 305-day milk yield (305MY) and persistency of lactation (PS6).
Figure 4 - Percentage of sires selected for persistency of lactation (PS1-PS6) when selecting for 305-day milk yield (305MY), at different
se-lection intensities.
Figure 5 - Percentage of cows selected for persistency of lactation (PS1-PS6) when selecting for 305-day milk yield (305MY), at different
selection intensities.
into account the selection of animals that show higher lev-els of persistency of lactation. An increase in 305MY might be obtained by the selection of animals that show higher levels of persistency of lactation, which means select cows with a reduced rate of decline in daily milk yield after peak lactation. Previous studies have investigated the effective-ness of different measures of persistency as selection crite-ria in improvement of persistency of lactation and milk yield simultaneously (Togashi and Lin, 2004) but other studies have introduced doubts regarding whether the
days-open effect (Stanton et al., 1992; Dedková and Nemcová, 2003) or does not effect (Van der Lindeet al., 2000) the shape of the lactation curve.
Additional research is still needed to identify alterna-tive models to fit test-day data. A Canadian study by Kistemaker (2003) has indicated that test-day models using Legendre polynomials allow for more variability than mod-els using the Wilmink curve. Orthogonal polynomials are most appropriate for the covariates in the random regres-sion model (Schaeffer, 2004), while Jakobsenet al.(2002) has reported that a four-order Legendre polynomial best fit-ted the data for persistency of milk yield.
Our results confirmed the weak association between 305MY and persistency of lactation. From the six measures of persistency evaluated in this study, the performance of PS5 and PS6 were very similar and emerged as the most ap-propriate when applied to describe persistency or milk yield of the Holstein breed in Minas Gerais State, and are thus potential criteria for use in the genetic evaluation of persistency. However, further studies are needed to evalu-ate other functions for their ability to model the lactation curve and the effectiveness of measures of persistency as selection criteria for the simultaneous improvement of lac-tation milk yield and laclac-tation persistency.
Acknowledgments
The authors thank Professor Ignacy Misztal, Univer-sity of Georgia, USA, for allowing the use of the REMLF90 program.
References
Cobuci JA, Euclydes RF, Costa CN, Lopes PS, Torres RA and Perreira CS (2004) Análises da persistência na lactação de vacas da raça Holandesa, usando produção no dia do contro-le e modelo de regressão acontro-leatória. Brazilian Journal of Ani-mal Science 33:546-554 (Abstract in English).
Dedková E and Nemcová E (2003) Factors affecting the shape of lactation curves of Holstein cows in the Czech Republic. Czech Journal Animal Science 48:395-402.
Figure 8- Average estimated breeding values for milk yield across lacta-tion of cows and sires according to the birth year of cows.
Figure 9- Average estimated breeding values for 305-day milk yield and persistency of lactation of sires according to the birth year of cows.
Figure 7- Estimated breeding values across lactation of the top five sires (SP1-SP5) with more than 25 daughters ranked for persistency of lactation (PS6).
Table 5- Average estimated breeding values of sires for persistency of lactation (PS1to PS6) and 305-day milk yield (305MY) according to the
birth year of cows.
Traits Year
1993 1994 1995 1996 1997 1998 1999
PS1 0.03 0.003 0.008 -0.04 0.01 0.15 0.10
PS2 3.15 0.91 0.62 0.05 4.33 11.49 9.13
PS3 4.58 0.94 0.99 -2.54 4.18 17.53 12.97
PS4 4.60 0.65 1.06 -4.58 2.58 18.24 12.80
PS5 -3.57 -0.12 -0.91 6.18 0.10 14.96 -9.61
PS6 0.03 0.001 0.07 -0.05 -0.00 0.12 0.08
Dekkers JCM, Jamrozik J, Ten Hag JH, Schaeffer LR and Weersink A (1996) Genetic and economic evaluation of per-sistency in dairy cattle. Interbull Bulletin 12:97-102. Dekkers JCM, Tem Hag JH and Weersink A (1998) Economic
as-pects of persistency of lactation in dairy cattle. Livestock Production Science 53:237-252.
Gengler N (1996) Persistency of lactation yields: A review. Interbull Bulletin 12:97-102.
Groen AF, Torstein S, Colleau JJ, Pedersen J, Pribyl J and Reinsch N (1997) Economic value in dairy cattle breeding with spe-cial reference to functional traits. Livestock Production Sci-ence 49:1-21.
Grossman M, Hartz SM and Koops WP (1999) Persistency of lac-tation yield: A novel approach. Journal of Dairy Science 82:2192-2197.
Interbull (2000) National Genetic Evaluation programmes for Dairy Production Traits Practiced in Interbull Member Countries 1999-2000. Interbull Bulletin v. 24, Interbull, Uppsala, 111 pp.
Jakobsen JH, Madsen P, Jensen J, Pedersen J, Christensen LG and Sorensen DA (2002). Genetic parameters for milk produc-tion and persistency for Danish Holstein estimated in ran-dom regression models using REML. Journal of Dairy Science 85:1607-1616.
Jamrozik J, Jansen G, Schaeffer LR and Liu Z (1998) Analysis of persistency of lactation calculated from a random regression test day model. Interbull Bulletin 17:64-69.
Jamrozik J, Schaeffe LR and Dekkers JCM (1997) Genetic evalu-ation of dairy cattle using test day yields and random regres-sion model. Journal of Dairy Science 80:1217-1226. Kistemaker GJ (2003) The Canadian test day models using
Legendre Polynomials. Interbull Bulletin 31:202-204. Kruip TAM, Van Der Welf JHJ and Wensing T (1996) Energy
balance in early lactation of high producing dairy cows and
its relation to reproduction, health and welfare. European Association for Animal Production 84:45-57.
Misztal I (2004) REMLF90 manual: Available at: http://nce.ads. uga.edu/~ignacy/numpub/blupf90/winbin/. Accessed Nov 21, 2004.
Rekaya R, Weigel KA and Gianola D (2001) Hierarchical nonlin-ear model for persistency of milk yield in the first three lactation of Holsteins. Livestock Production Science 68:181-187.
Schaeffer LR (2004) Application of random regression models in animal breeding. Livestock Production Science 86:35-45. Sölkner J and Fuchs W (1987) A comparison of different
mea-sures of persistency with special respect to variation of test-day milk yields. Livestock Production Science 16:305-319.
Stanton TL, Jones LR, Everett RW and Kachman SD (1992) Esti-mating milk, fat, and protein lactation curves with a test day model. Journal of Dairy Science 75:1691-1700.
Tekerli M, Akinci Z, Dogan I and Akcan A (2000) Factors affect-ing the shape of lactation curves of Holstein cows from the Balikesir Province of Turkey. Journal of Dairy Science 83:1381-1386.
Van Der Linde R, Groen A and Jong G (2000) Estimation of ge-netic parameters for persistency of milk production in dairy cattle. Interbull Bulletin 25:113-116.
Togashi K and Lin CY (2004) Efficiency of different selection cri-teria for persistency and lactation milk yield. Livestock Pro-duction Science 87:1528-1535.
Wilmink JBM (1987) Adjustment of test-day milk, fat and protein yields for age, season and stage of lactation. Livestock Pro-duction Science 16:335-348.