iSensA - A System for Collecting and Integrating Sensor Data
João M. L. P. Caldeira1, Vasco N. G. J. Soares2, Pedro D. Gaspar3, Joel J. P. C. Rodrigues4, Ricardo Fontes5, José Silva6 1
Instituto Politécnico de Castelo Branco, Instituto de Telecomunicações, Portugal (e-mail: [email protected])
2Instituto Politécnico de Castelo Branco, Instituto de Telecomunicações, Portugal (e-mail: [email protected])
3Universidade da Beira Interior, Portugal (e-mail: [email protected])
4
National Institute of Telecommunications (Inatel), Brazil; Instituto de Telecomunicações, Portugal; University of Fortaleza
(UNIFOR), Brazil (e-mail: [email protected])
5
Instituto Politécnico de Castelo Branco, Portugal (e-mail: [email protected])
6 Instituto Politécnico de Castelo Branco, Portugal (e-mail: [email protected])A R T I C L E I N F O A B S T R A C T Article history:
Received : Revised : Accepted :
The idea of monitoring several types of parameters in various environments has been motivating significant research works in Internet of Things (IoT). This paper presents the design and construction of iSensA, a system for integrating and collecting information from sensors. The solution implements a multi-sensor monitoring system and then expands the monitoring concept to an IoT solution, by employing multi-network access, Web services, database and web and mobile applications for user interaction. iSensA system is highly configurable, enabling several monitoring solutions with different types of sensors. Experiments have been performed on real application scenarios to validate and evaluate our proposition.
Keywords : iSensA Arduino Sensors
Monitoring system
Web and mobile applications Internet of Things
1. Introduction
This paper is an extension of work originally presented in conference CISTI 2018 [1].
Nowadays, industry faces new challenges and paradigms derived from the current industrial revolution, the 4th one, named as Industry 4.0. This new era of industrial development aims to provide an expedite answer to the fast and dynamic requirements of production, and promoting its operational effectiveness and efficiency, and thus contributing to higher productivity. As described by [2] and [3], the most relevant features of Industry 4.0 are related with information and communication technologies & electronics (ICT&E), advanced algorithms, added value and knowledge management. These features can be summarized as: (1) digitization, optimization, and production customization; (2) automation and adaptation; (3) human machine interaction (HMI); (4) value-added services and businesses, and (5) automatic data exchange and communication. To accomplish these objective, Industry 4.0 relies on several technologies, being mobile computing, cloud computing, big data, and the Internet of Things (IoT) the key technologies of Industry 4.0 [3-7]. Among these concepts, the IoT paradigm has been extensively focused in the last years, since it covers a wide scope of applications in various fields. It brings ubiquitous intelligence through the interconnection of equipment (sensors, devices, etc.) to the Internet.
Results from a market and literature survey of IoT-based monitoring show that some developments have been reported in
implementation of such systems for example for monitoring: water level [8,9] and water quality [10,11], power consumption [12,13], smart agriculture [14,15], garbage [16,17], solar energy production [18], air quality [19], equipment working status [20]. Instead of focusing on a specific problem and its solution, the work presented in this paper proposes a generic IoT data acquisition solution, that can be widely applied to different scenarios. It addresses the following main challenges:
• Applicable to different environments, with distinct requirements;
• Send and receive data to and from remote servers over Ethernet, Wi-Fi or GSM/GPRS;
• Configuration of operation and control rules based on parameters and specific requirements;
• Statistical tools to support real-time or historical data management and analysis, trend analysis, and data correlation;
• Configuration of reports, alarms/notifications, which can be sent by e-mail and/or SMS;
• High scalability;
• Online platform accessible via computer, tablet or smartphone;
ASTESJ
ISSN: 2415-6698 Advances in Science, Technology and Engineering Systems Journal Vol. 2, No. 1, XX-YY (2017)S.S. Ahmad et al. / Advances in Science, Technology and Engineering Systems Journal Vol. 2, No. 1, XX-YY (2017) • Complete and secure backup in the cloud;
• Implemented using open source technology.
The main contributions of this work are as follows. Firstly, an intelligent data acquisition system, called iSensA [31], is proposed. It is based on Arduino controllers and sensors, Web and mobile applications supported by a cloud architecture with a relational database and Web services. Secondly, the effectiveness of this system for monitoring, analyzing real-time or historical data and ensuring incident detection is tested. The proposed system is experimentally evaluated and validated in several real-world case studies of different sectors with specific requirements. Thirdly, it is assessed if the system facilitates resource management and contributes to reduce operational expenses.
The remainder of this paper is organized as follows. Section 2 introduces iSensA system for remote monitoring. Section 3 presents the test and validation of iSensA in real scenarios, and discusses resource consumption. Section 4 concludes the paper and points further research directions.
2. iSensA
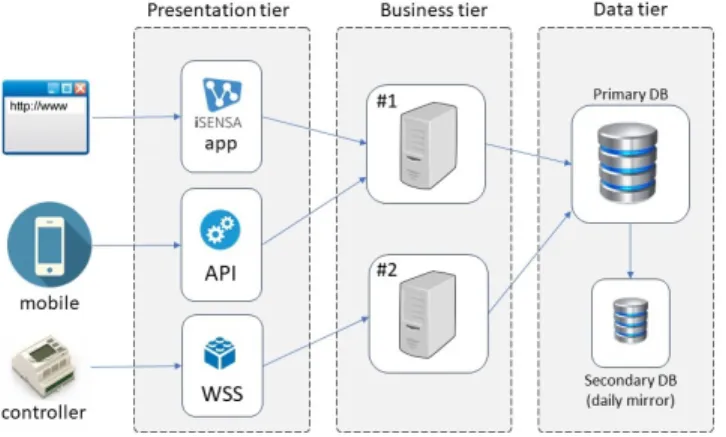
iSensA system was developed using a three-tier architecture [21] that comprises a presentation tier, a business tier, and a data tier. The three layers in the three-tier architecture are as follows. The client layer contains the user interface part of the application. Data is presented to the user or input is taken from the user. The business layer acts as an interface between the client layer and the data access layer. It is responsible for business logic like validation of data, calculations, data insertion, etc. Finally, the database is located in the data layer.
Figure 1 presents the iSensA architecture. The Server #1 is responsible for data processing. It calculates indirect values such as total, average, minimum, and maximum values. These values are calculated from direct values sent by the controllers. Indirect values are used for charts and for reporting purposes. The Server #2 is also used due to the large amount of data potentially collected from the controllers. It allows dividing the load between web / mobile users and controllers. The platform architecture was conceived as a modular system suitable to be integrated into third-party middleware.
Figure 1. Overview of the iSensA system.
iSensA development required: (1) the construction of a data acquisition and control module, performed through a controller, sensors and electronic circuits; (2) the implementation of a data
acquisition and processing interface, Web and mobile applications, supported by a cloud architecture with a relational database and Web services. The following subsections present the controller, the Web application, and the mobile application.
Due to space limitations it is not possible to present the features of the system and applications in detail. The interested reader may contact the authors for detailed information and request access to test it.
2.1. Controller
The iSensA controller is an Arduino-based hardware platform [22]. The adoption of this platform in development environments allows rapid prototyping of functional solutions. Characterized by the use of Atmel ARV microcontrollers, with intuitive programming based on the C programming language, this platform is becoming a true competitor to more complex control systems currently used by companies [23]. A great advantage of this type of platform is its flexibility. Providing multiple inputs and outputs, digital and analog, these platforms become adaptable to the acquisition of any type of signals. With the increasing success and the low-cost of these platforms, several sensors are available for measurement and collection of various parameters. Measuring sensors, which lately only existed for industrial controllers, are now available for use on low-cost platforms such as Arduino. Modularity is another great feature of these platforms, so they can be built according to the specific needs of a particular application. Taking advantage of all these features, the iSensA controller is based on an Arduino platform. Depending on the requirements of each application scenario, an iSensA controller can be coupled to a communication module using Ethernet, wireless (Wi-Fi) or mobile Global System for Mobile Communications (GSM). These modules are required for communication between the controller and the iSensA Server #2. Figure 2 presents the iSensA controller in several of its different configurations.
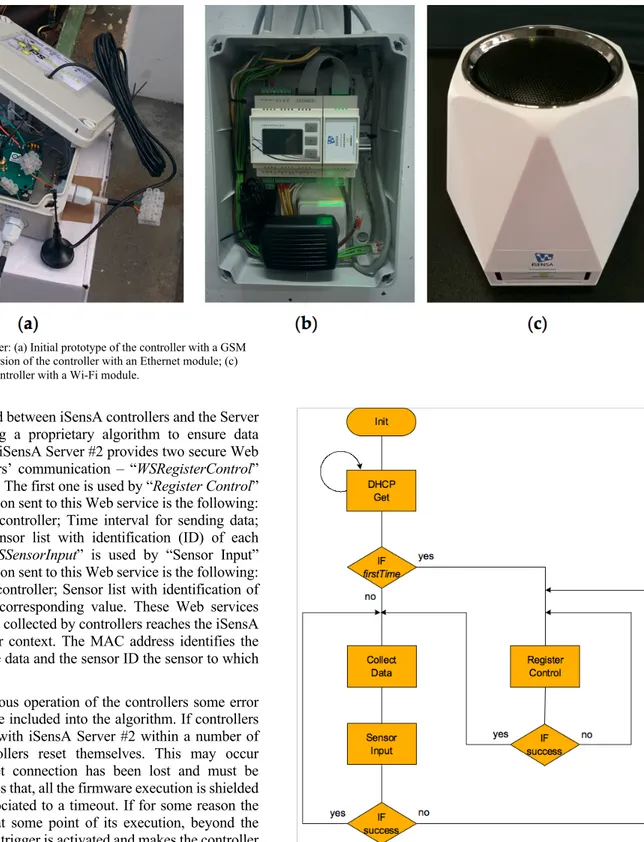
The operation of iSensA controllers is based on collecting data from the attached sensors and sending them to the iSensA Server #2 (Figure 1). For that, the controller starts by trying to get Internet connection thru the DHCP service. After, it enters into an infinite loop divided into three main modules, “Register Control”, “Collect Data” and “Sensor Input”. The first module to be executed is “Register Control” and it is executed only once. This module is responsible for the registration of controllers with the iSensA Server #2. The registration procedure improves security to the system by only allowing pre-approved controllers to communicate with iSensA Server #2. Therefore, each controller before start sending data must be known by iSensA Server #2. After successful registration, the controller starts executing “Collect Data” and “Sensor Input” modules periodically. “Collect Data” reads the real-time values from the attached sensors while “Sensor Input” performs all the tasks needed to send the collected data to Server #2. Figure 3 presents the flowchart of the firmware executed by iSensA controllers.
Figure 2. iSensA controller: (a) Initial prototype of the controller with a GSM module; (b) Current version of the controller with an Ethernet module; (c)
Controller with a Wi-Fi module.
All data exchanged between iSensA controllers and the Server #2 is encrypted using a proprietary algorithm to ensure data integrity and privacy. iSensA Server #2 provides two secure Web services for controllers’ communication – “WSRegisterControl” and “WSSensorInput”. The first one is used by “Register Control” module. The information sent to this Web service is the following: MAC address of the controller; Time interval for sending data; Controller model; Sensor list with identification (ID) of each sensor and type. “WSSensorInput” is used by “Sensor Input” module. The information sent to this Web service is the following: MAC address of the controller; Sensor list with identification of each sensor and the corresponding value. These Web services ensure that all the data collected by controllers reaches the iSensA server with the proper context. The MAC address identifies the controller that sent the data and the sensor ID the sensor to which the value corresponds.
To ensure continuous operation of the controllers some error recovery routines were included into the algorithm. If controllers cannot communicate with iSensA Server #2 within a number of attempts, then controllers reset themselves. This may occur whenever the Internet connection has been lost and must be restarted again. Besides that, all the firmware execution is shielded by a reset trigger associated to a timeout. If for some reason the firmware gets stuck at some point of its execution, beyond the timeout, then the reset trigger is activated and makes the controller to reset itself. These mechanisms guarantee robustness to the
system, allowing it to recover from most uncontrolled situations. Figure 3. iSensA controller firmware flowchart.
The first tests of the system in real-world deployments revealed several limitations and challenging issues. For example, there were lots of problems concerning network communications, in particular, GSM communication. It was observed that the controller would stop working after losing GSM connection, which occurred very often. An analysis of this problem revealed that the native Arduino library procedure responsible for getting a
S.S. Ahmad et al. / Advances in Science, Technology and Engineering Systems Journal Vol. 2, No. 1, XX-YY (2017) link to the GSM network was blocking. Therefore, a timeout
recovery algorithm was implemented in the GSM library to prevent the firmware to get infinitely stuck waiting for a GSM link. Another issue that occurred on some iSensA real-world deployments, was caused by the signal loss in cabling between sensors and controllers. After thorough electrical analysis and several tests, it was concluded that this problem resulted from two main reasons. The first one due to long cables. This was solved by decreasing the pullup resistors used in the sensors connections, thus allowing the controllers to receive the correct values from sensors. The second one resulted from cables that were installed in noisy environments, near to pumps, electrical links, etc. In such situations, the problem was solved by using shielded cables to connect sensors to controllers.
2.2. Web Application and Relational Database
Open-source technologies were used to develop an intuitive and user-friendly Web application that can be used at any time, from anywhere, in different electronic devices (computers, tablets, mobile phones, etc.). PHP runs on the server side, being embedded in HTML. JavaScript is a scripting language executed on the client side, interpreted by the web browser, and allows the creation of interactive pages. jQuery is a quick, small and feature rich Javascript API, making HTML and event handling, animations and Ajax much simpler and easier to use. On the client side Bootstrap was also used. It is a front-end framework that allows agile development in responsive web projects. It allows integration of jQuery with other technologies such as CSS and LESS, for the dynamism desired in the interaction with the user. Bootstrap is also used in the development of platform design. Google Charts framework is used to plot data into rich and interactive charts.
Due to the characteristics of the Web application to be developed, the ICONIX methodology was selected. The analysis, design and implementation phases of the application were supported by its processes.
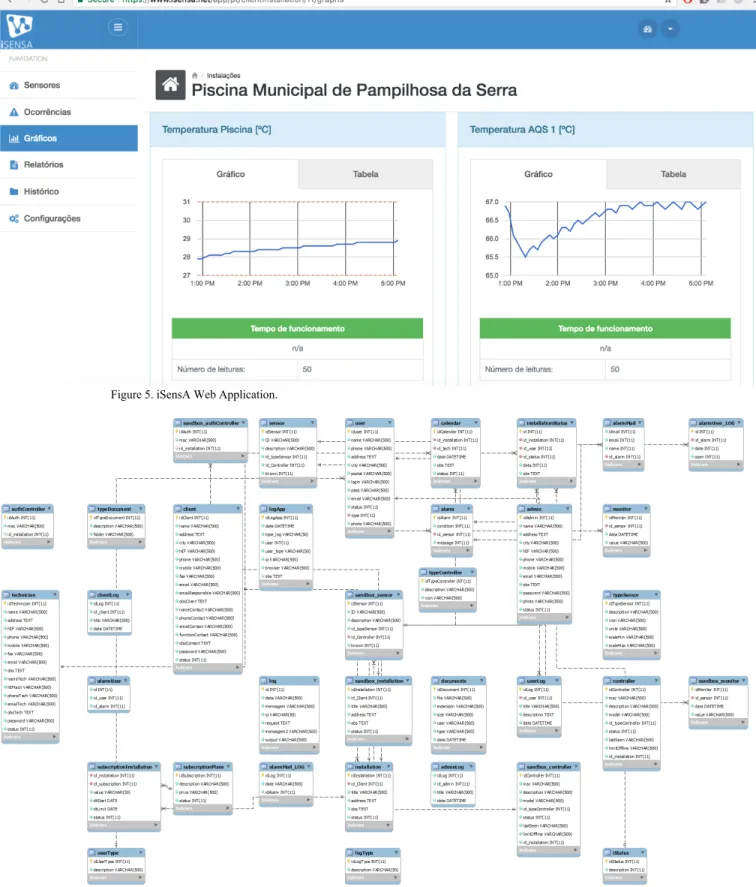
The Web application shown in Figure 5 provides, among others, the following functionalities:
• Secure Web access available anytime anywhere;
• Accessible through any of the major Web browsers on any device;
• Configurable dashboards; • Easy and intuitive navigation; • Centralized management of facilities; • Setting access levels for different users;
• User defined alarms that can be received by email or cell phone text message;
• User defined reports that can be received by email; • Real-time data visualization;
• Historical data analysis; • Data export in various formats.
The database presented in Figure 6, is implemented in a MySQL fully normalized schema that allows for rapid complex
querying. HTTPS was set up to protect the integrity of the Web application, and the security of its users. It allows users to securely connect to the Web application.
2.3. Mobile Application
The mobile application named MobiSensA [1] aims to extend the range of features of iSensA system to mobile devices. It allows monitoring the installations, showing the status and information of controllers and sensors in real time, without having to depend on the Web application and email. Furthermore, it notifies users when alerts or anomalies occur.
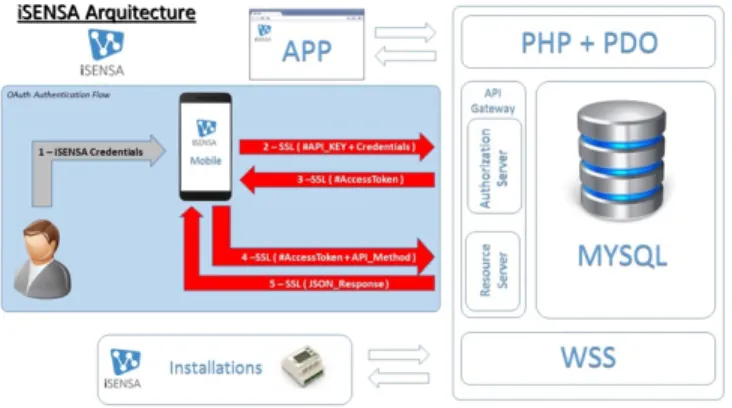
ICONIX methodology was also used for the development of the mobile application. MobiSensA was developed for smartphones with Android OS, using the Android Studio integrated development environment, and the SQLite Database Browser tool for database management. To implement the application and organize the interface, a set of specifications and guidelines of the Material Design language, referring to usability and accessibility was used. The Git tool was used to enforce versioning. Firebase technology was used to keep the application's local repository updated. A robust and secure Web Services API provides access to data from the iSensA database. Used protocols and technologies are illustrated in Figure 4.
Figure 5. iSensA Web Application.
S.S. Ahmad et al. / Advances in Science, Technology and Engineering Systems Journal Vol. 2, No. 1, XX-YY (2017)
www.astesj.com 6
The following are the requirements for the mobile application. Non-functional requirements:
• The application is developed for Android 4.4 or later. • The application limits size of stored data.
• The application works without an internet connection (offline).
Functional requirements:
• The user must login to use the application;
• The application shows the user’s installations, together with the status of the controllers;
• The application allows visualizing the entire structure of the user data (installations, controllers and sensors); • The application allows visualizing a sensor details,
readings and alert history;
• The application icon must show the number of installation alerts and/or anomalies;
• The user may control the update frequency of the controllers/sensors;
• The user may decide the number of days the information is kept in history;
• The application notifies the user when an anomaly or an alert occurs;
• The application shows the number of anomalies and alerts that have occurred.
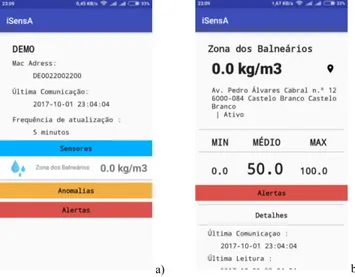
Some screenshots of the mobile application are shown in Figures 7-9. Figure 7 a) shows the start interface with a login option; b) displays the user’s installations and controllers. Figure 8 a) shows detailed information of a controller; b) detailed information of a sensor that is connected to a controller. Figure 9 a) shows the sensor alerts; b) notification of controller anomalies.
a) b)
Figure 7. Screenshots: a) login; b) user’s installations.
a) b)
Figure 8. Screenshots: a) detailed information of a controller; b) detailed information of a sensor.
a) b)
Figure 9. Screenshots: a) sensor alerts; b) controller anomalies.
3. Application Scenarios and Resource Consumption This section presents two real application scenarios that were used for testing and validation of the iSensA system. The evaluation of the iSensA resource consumption is also discussed. 3.1. Swimming Pool Monitoring and Control
ALBIGEC [24], a company responsible for the management of the swimming pool complex in the city of Castelo Branco, Portugal, wanted to monitor and remotely control the swimming pools water temperature, the bath waters temperature, and the female and male bathrooms temperature and humidity. iSensA’s first prototype was deployed there. After a detailed study of the site and the requirements meeting, it was concluded that it would be necessary to install two iSensA controllers. One of these controllers was installed next to the swimming pool. Using three temperature-humidity sensors it monitors the temperature and humidity of the bathrooms and the central building. In order to monitor the water temperature of the two swimming pools and the sanitary waters, another controller was installed in the technical zone, next to the water tanks.
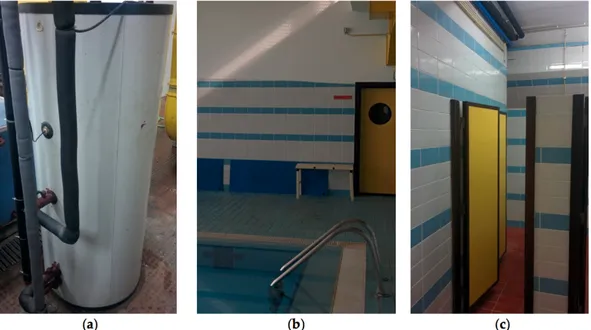
Figure 10. Sensors for swimming pool monitoring: (a) Sensing the bath waters temperature; (b) Sensing the temperature and humidity of the environment in the
main pool; (c) Sensing the temperature and humidity in a bathroom.
In this case, four temperature sensors were placed in the outlet pipes that go from the water tanks to the swimming pools, and from the sanitary water tanks to the bathrooms. Both controllers communicate with the iSensA Web services using the building’s Ethernet LAN.
Following the initial success, ALBIGEC extended the use of iSensA to another swimming pool complex under its management, located in Alcains village, Portugal. This was a simpler scenario where only one controller was required. In this case, the parameters to be monitored were the temperature and humidity in two bathrooms (female and male), the temperature of the swimming pool water and the temperature of the bath waters. Since an Ethernet connection wasn’t available, a GSM modem was connected to the controller to allow the communication with the iSensA Web services.
The Municipality of Pampilhosa da Serra, Portugal [25], has also successfully adopted iSensA for controlling their swimming pool complex. Figure 10 shows the installation of iSensA in this scenario. Figure 5 displays the iSensA Web platform showing the values collected in this installation.
The functionalities provided by iSensA Web application allowed both companies to program alarms with upper and lower limits for all measured parameters. These alarms trigger alerts notified by e-mail and allow companies to react accordingly. These notifications can help prevent any downtime from the swimming pool complex due, for example, to low water temperatures. iSensA also provides automated statistical reports essential to effective management. Before using iSensA, only a limited amount of data was collected on paper forms by the maintenance staff and entered into the computer at a later date. Therefore it was difficult to sort through and analyze it in an efficient manner.
3.2. Monitoring and Control of Sewer Pumping Stations
SMAS [26], a company responsible for the municipal services in the city of Castelo Branco, Portugal, proposed as a challenge the use of iSensA to monitor a sewer pumping station. Sewer pumping
stations are used to move wastewater to higher elevations in order to allow transport by gravity flow. Sewage is fed into and stored in a wet well. When the sewage level rises to a predetermined level, an electric pump is started automatically to lift the sewage upward through a pressurized pipe system from where it is discharged into a gravity manhole again. This process is repeated until the sewage reaches a treatment plant. No tool exists currently for remotely monitoring SMAS stations. Their workers visit each of the sewer pumping stations once a day, to check for problems or failures. If a fault occurs between visits, it will not be detected, and it will lead to overflows of wet wells that must be avoided due to potentially posing health and environment hazards.
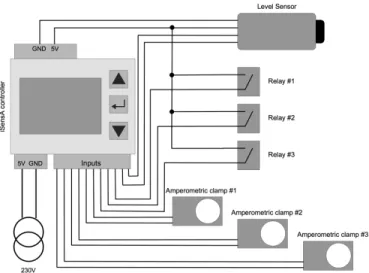
iSensA was deployed in one sewer pumping station to allow for control and remote monitoring of events that occurred there. Figure 11 shows the installation in this scenario. The deployed system was comprised of an iSensA controller connected to three amperometric clamps and a level sensor. The current clamps are used to measure the instantaneous current consumption of each phase of the electric pump (in this case a three-phase electric pump). The level sensor measures the height of the water in the wet well in real time. In addition, the controller has three relays connected. When the well float drops, an overflow will occur, and the first relay is triggered. When there is a malfunction in the electric pump soft-start, the second relay is triggered. Finally, a differential protection relay can also be triggered. The second and third relays can help detecting if the pump did not start. Figure 12 presents the electric block diagram of the installed controller.
An SMS notification is sent to the telephone numbers pre-programmed on the controller, each time one of the relays is triggered. This allows workers to be notified immediately. Again the Web application allows to set alert values for both the values measured by the amperometric clamps and the water level in the well, and these alarms are then notified by e-mail. In the absence of a cabled network connection, a GPRS/GSM module was connected to the controller. This allows sending data to iSensA Web services and also sending SMS messages. SMAS workers can now react more quickly and resolve the problems sooner.
S.S. Ahmad et al. / Advances in Science, Technology and Engineering Systems Journal Vol. 2, No. 1, XX-YY (2017)
Figure 11. Monitoring a sewer pumping station: (a) Installation of the controller; (b) Wet well.
Figure 12. Electric block diagram of the installed controller.
3.3. Performance and Resource Usage
The above-described scenario of the swimming pool complex of the Municipality of Pampilhosa da Serra was used for assessing iSensA system performance and resource consumption. The characterization of workload and resource consumption was performed based on server logs, including both data exchanged between iSensA controllers and the Server #2 (Figure 1) and resource consumption of the Web services requests, as well as the volume of data stored in the database.
The two iSensA controllers deployed in this scenario, acquire sensor data and send it to the server every 15 minutes. For example, during the month of October 2017, 14233 data messages were sent from the controllers to the server. The average size observed for register and data messages was about 210.18 octets. The collected
sensor data over this period of time required approximately 18.06 MB of storage space in the database. Total bandwidth consumption by the Web services was 2995794 octets. These results allow to conclude about the effectiveness and efficiency of iSensA system. 4. Conclusions
It is predicted that Industry 4.0 will accelerate industry to achieve remarkable levels of operational efficiencies and thus largely increase productivity [27,28]. Among technologies, IoT is considered as a key enabler for the new-generation advanced manufacturing, Industry 4.0 [29]. IoT can be seen as a mean of connecting physical objects to the Internet as a ubiquitous network that enables objects to collect and exchange information. Thus, it blends and expands the traditional automation systems and industrial informatics systems into a much broader context [30].
In this paper, a system for reading and acquiring sensor data - iSensA - was presented. iSensA is based on Arduino controllers, web and mobile applications supported by a cloud architecture with a relational database and web services. iSensA enables the monitoring and analysis of data, environments and devices in a wide range of areas. The testing and validation of iSensA in real scenarios, show the soundness of the presented system to adapt to different application requirements. It contributes efficiently to incident detection, resource management, and cost reduction.
Future work includes: (1) using the gathered historical data to develop predictive models to help anticipate potential future events / incidents and to identify energy saving opportunities; (2) assessing iSensA system for safety critical applications; (3) testing and maintenance of the mobile application.
Conflict of Interest
The authors declare no conflict of interest. Acknowledgment
This work is funded by FCT/MEC through national funds and when applicable co-funded by FEDER – PT2020 partnership agreement under the project UID/EEA/50008/2013, and by Finep,
with resources from Funttel, Grant No. 01.14.0231.00, under the Centro de Referência em Radiocomunicações - CRR project of the Instituto Nacional de Telecomunicações (Inatel), Brazil. The authors would like to acknowledge the companies InspiringSci, Lda, Enérgico Balanço Unipessoal Lda, ALBIGEC - Empresa de Gestão de Equipamentos Culturais, Desportivos e de Lazer, E. M., and SMAS - Serviços Municipalizados de Castelo Branco, as well as the Municipality of Pampilhosa da Serra, for their interest and valuable contribution to the successful development of the iSensA system.
References
[1] J. Silva, R. Fontes J. M. L. P. Caldeira, V. N. G. J. Soares, and P. D. Gaspar, “MobiSensA: Desenvolvimento de uma Aplicação Móvel para a Plataforma iSensA,” in 13th Iberian Conference on Information Systems and Technologies (CISTI'2018), Cáceres, Spain, June 13-16, 2018.
[2] Posada, J., Toro, C., Barandiaran, I., Oyarzun, D., Stricker, D., et al, “Visual computing as a key enabling technology for Industry 4.0 and industrial Internet,” IEEE Computer Graphics and Applications, 35(2), pp. 26-40, 2015. [3] Roblek, V., Meško, M., Krapež, A, “A Complex View of Industry 4.0,” SAGE
Open 2016, 6(2), 2016.
[4] Gruber, F.E, “Industry 4.0: A best practice project of the automotive industry,” Digital Product and Process Development Systems, Springer Berlin Heidelberg, pp. 36-40, 2013.
[5] Vijaykumar, S., Saravanakumar, S.G., Balamurugan, M, “Unique sense: Smart computing prototype for Industry 4.0 revolution with IOT and bigdata implementation model,” Indian Journal of Science and Technology, 8(35), 2015.
[6] Wan, J., Tang, S., Shu, Z., Li, D., Wang, S., et al, “Software-defined industrial Internet of Things in the context of Industry 4.0,” IEEE Sensors Journal, 16 (22), pp. 7373-7380, 2016.
[7] Lu, Y., “Industry 4.0 - A survey on technologies, applications and open research issues,” Journal of Industrial Information Integration, doi: 10.1016/j.jii.2017.04.005, 2017.
[8] Pragati, D., Kirtikumar, S. V., “IoT based Water Monitoring System: A Review,” International Journal of Advance Engineering and Research Development, 4(6), 2017.
[9] Sukriti, Gupt, S., Indumathy, K, “IoT based Smart Irrigation and Tank Monitoring System,” International Journal of Innovative Research in Computer and Communication Engineering, 4(9), 2016.
[10] Vaishnavi, D., Gaikwad, M, “Water Quality Monitoring System Based on IoT,” Advances in Wireless and Mobile Communications, 10(5), pp. 1107-1116, 2017.
[11] Geetha, S., Gouthami, S, “Internet of things enabled real time water quality monitoring system,” International Journal for @qua – Smart ICT for Water, 2(1), 2017.
[12] Kurde, A., Kulkarni, V, “IoT Based Smart Power Metering,” International Journal of Scientific and Research Publications, 6(9), 2016.
[13] Pandit, S., Mandhre, S., Meghana, N. “Smart Energy Meter using Internet of Things,” Vishwakarma Journal of Engineering Research, 1(2), 2017. [14] Dharti, V., Borole, A., Singh, S., “Smart Agriculture Monitoring and Data
Acqusition System,” International Research Journal of Engineering and Technology, 3(3), 2016.
[15] Athani, S., Tejeshwar, C., Patil, M., Patil, P., Kulkarni, R., “Soil moisture monitoring using IoT enabled arduino sensors with neural networks for improving soil management for farmers and predict seasonal rainfall for planning future harvest in North Karnataka – India,” Proceedings of the International conference on I-SMAC (IoT in Social, Mobile, Analytics and Cloud) (I-SMAC 2017), India, 10-11 February, pp. 43-48, 2017.
[16] Kumar, N., Vuayalakshmi, B., Prarthana, R., Shankar, A., “IoT based smart garbage alert system using Arduino UNO,” Proceedings of the 2016 IEEE Region 10 Conference (TENCON), Singapore, 22-25 November, 2016.
[17] Revathy, S., Anandhi, A., Hemalatha, K., “IoT Based Smart Bin Monitoring Using Sensor and GSM for Smart Cities,” International Journal of Research in Computer Science, 4(1), 2017.
[18] Patil, S., Vijayalashmi, M., “Solar Energy Monitoring System Using IoT,” Indian Journal of Scientific Research, 15(2), pp. 149-155, 2017.
[19] Fioccola, G., Sommese, R., Tufano, I., Canonico, R., Ventre, G., “Polluino: An efficient cloud-based management of IoT devices for air quality monitoring,” Proceedings of the IEEE 2nd International Forum on Research and Technologies for Society and Industry Leveraging a better tomorrow (RTSI), Bologna, Italy, 7-9 September, 2016.
[20] Patel, K., Patel, S., “IoT Based Data Logger for Monitoring and Controlling Equipment Working Status and Environmental Conditions,” International Journal of Innovative Research in Computer and Communication Engineering, 4(4), 2016.
[21] Bouhai N. (Editor), S. Imad (Editor)., “Internet of Things: Evolutions and Innovations Volume 4,” Wiley: NJ, USA, ISBN 9781119476573, 2017. [22] Arduino. Available online: https://www.arduino.cc/ (accessed on 7 November
2017).
[23] Reneker, D., “Arduino vs. PLC for industrial control.” In Control Design for Machine Builders, Jul 13, 2017. Available online: https://www.controldesign.com/articles/2017/arduino-vs-plc-for-industrial-control/ (accessed on 7 November 2017), 2017.
[24] ALBIGEC. Available online: http://www.albigec.pt/ (accessed on 21 September 2018).
[25] CM Pampilhosa da Serra. Available online: http://www.cm-pampilhosadaserra.pt/ (accessed on 21 September 2018).
[26] Serviços Municipalizados de Castelo Branco. Available online: http://www.sm-castelobranco.pt/ (accessed on 21 September 2018). [27] Hermann, M.; Pentek, T.; Otto, B., “Design principles for Industry 4.0
scenarios,” Proceedings of the 49th Hawaii International Conference on System Sciences (HICSS), Institute of Electrical and Electronics Engineers -IEEE-, IEEE Computer Society, Kauai, Hawaii, 5-8 January, pp. 3928-3937, 2016.
[28] Thames, L., Schaefer, D., “Software-defined cloud manufacturing for Industry 4.0,” Procedings CIRP, 52, pp. 12-17, 2016.
[29] Trappey, A.J.C., Trappey, C.V., Govindarajan, U.H., Chuang, A.C., Sun, J.J., et al., “A review of essential standards and patent landscapes for the Internet of Things: A key enabler for Industry 4.0,” Adv. Eng. Informat, 2016. [30] Queiroz, D.V., Alencar, M.S., Gomes, R. D., Fonseca, I.E., Benavente-Peces,
C., “Survey and systematic mapping of industrial wireless sensor networks,” Journal of Network and Computer Applications, 2017.
[31] iSensA. Available online: http://www.isensa.net/ (accessed on 21 September 2018).