Development of a Smart Electric Motor Testbed for
Internet of Things and Big Data Technologies
Jonas Queiroz
∗†, José Barbosa
‡§, José Dias
‡, Paulo Leitão
‡†, Eugénio Oliveira
∗† ∗ Faculty of Engineering, University of Porto, Rua Dr. Roberto Frias, 4200-465 Porto, Portugal,Email: {jonas.queiroz, eco}@fe.up.pt}
† LIACC – Artificial Intelligence and Computer Science Laboratory, Rua Campo Alegre 1021, 4169-007 Porto, Portugal
‡ Polytechnic Institute of Bragança, Campus Sta Apolónia, 5300-253 Bragança, Portugal,
Email: {jbarbosa, jose.dias, pleitao}@ipb.pt
§INESC-TEC, Rua Dr. Roberto Frias, 4200-465 Porto, Portugal
Abstract—Smart devices and Internet of Things (IoT) tech-nologies are becoming each day more common. At the same time, besides the exponentially increasing demand to analyze the produced data, there is an evolving trend to perform the data analysis closer to the data sources, particularly at the Fog and Edge levels. In this sense, the development of testbeds that can, e.g., simulate smart devices in IoT environments, are important to explore and develop the technologies to enable the complete realization of such IoT concepts. This paper describes the digitization of an electric motor, through the incorporation of sensing and an analytical computational environment, towards the development of a testbed for IoT and Big Data technologies. The smart electric motor testbed provides real-time data streams, enabling a continuous monitoring of its operation along all the device life-cycle through advanced data analytics. Furthermore, the paper discusses how specific data analytics features fit the different IoT layers, while preliminary experiments demonstrate the testbed potentials.
I. INTRODUCTION
The environments where people live and work are becoming more and more intelligent towards the enhancement of their well-being and convenience. Such phenomenon, technologi-cally covered in the Internet of Things (IoT) context [1], has been promoted by the wide adoption of smart things and the large availability of information services. For example, in the context of smart buildings, there are many solutions aiming to automate home tasks and improve energy efficiency through a network of sensors disposed in the buildings, home appliances and user devices [2]. In smart transportation, approaches are promoting the reduction of accidents, traffic jams and travel time through the communication among the vehicles and infrastructure [3]. In smart grids, the goal is to promote the use of renewable energy towards energy efficiency and self-sustainability, reducing the pollution gases, through an intelligent information network of prosumers, distribution utilities and generating companies [4]. Smart cities is a broader area, covering all the previous fields in order to promote the citizens’ life and the whole quality of the environment [5].
This concept is also extended for industries, where smart factories promote the optimization of the production system and the product customization and quality through the em-ployment of smart machines and products, as well as other principles leveraged by the Industry 4.0 [6]. Inside this vision,
smart products are appearing at the shop floors, interacting and influencing the production monitoring, predictive maintenance and asset management. When out of the factories, smart products continue their life-cycle [7] and besides fulfill their designed functionalities, they are also able to improve the support of customer services. As example, organizations can assess how the products are being used, and thus provide improved maintenance services or use the information to improve the design of the next generation of products to attend the requirements and features not considered before.
In IoT environments, smart devices have usually limited processing and storage capabilities, which means that they are restricted to perform simple monitoring tasks. In this way, robust algorithms, such those based on machine learning and data mining, should run in a cloud-based infrastructure, taking advantage of the large volume of measured data. However, connecting all devices to the Cloud does not fit all kinds of applications and may overhead the communication network, increasing the response latency. Lately, Fog computing [8], [9] emerged to bring the data processing and analysis close to the device, at the local network level. This approach addresses many application requirements, enhancing the response time and availability, increasing the security levels, and effectively pushing the data to the cloud [10].
In this complex and interdisciplinary field, there are still many challenges to leverage the development and adoption of smart devices towards the realization of intelligent, distributed and collaborative environments. Therefore, from a research perspective there are basically two ways to assess the tech-nologies and approaches to develop and test smart things and IoT environments solutions: 1) using simulation tools based on mathematical models, or 2) build experimental testbeds with real equipment and sensors. In this sense, this paper describes an easy and low cost deployable testbed to enable researchers, engineers and technology enthusiasts to explore, test and develop emergent IoT and Big Data technologies.
illustrate the data retrieval, integration, preprocessing, analysis and visualization in several motor operation scenarios.
Electric motors represent a good choice for a smart thing and IoT testbed, since besides their widely application in industries (e.g., present in most of shop floor machines) and daily life devices (e.g., vehicles and household appliances), motors also continuously provide several parameters (elec-trical, mechanical and operational) in a real-time stream. Additionally, motors are subject to several operating conditions and problems [11]. Therefore, to keep their operability, the produced data should be monitored and analyzed along the whole life-cycle, from design and production (features and quality control) to operation (maintenance and diagnosis).
The rest of the paper is organized as follows. Section II describes the DC motor hardware setup and Section III presents the testbed IoT architecture. Section IV discusses the data analytics features and Section V describes the preliminary testbed experiments. At last, Section VI rounds up the paper with the conclusions and points out the future work.
II. SMARTMOTORTESTBED
The testbed was built using simple and low cost equipment, as well as widely known and used technologies, becoming easily replicable. The next subsections describe the testbed hardware setup, signal conditioning and control systems.
A. Hardware Setup
The hardware setup of the smart motor testbed, illustrated in Fig. 1, was developed using a DC motor (120Watt), equipped with several sensors to measure, amongst others, the speed, rotation direction, temperature, 3-axis vibration, and electric current and voltage.
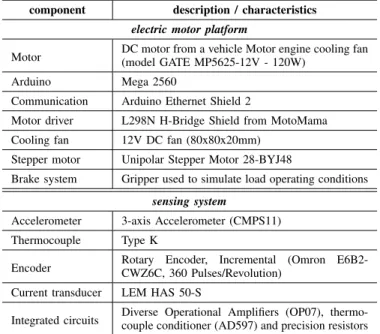
Table I lists the electric and hardware components, including a 3D printed brake system to allow the simulation of the motor under different load conditions. This system is controlled by a step motor that opens and closes the grippers, braking and increasing the load.
The encoder was connected to the motor through the coupler, which was surrounded by the brake system. Two DC power suppliers were used, particularly 12V to power the motor and the Arduino, and ±15V to power the signal
Fig. 1. Hardware setup of the DC motor
TABLE I SETUP COMPONENT LIST
component description / characteristics
electric motor platform
Motor DC motor from a vehicle Motor engine cooling fan(model GATE MP5625-12V - 120W)
Arduino Mega 2560
Communication Arduino Ethernet Shield 2
Motor driver L298N H-Bridge Shield from MotoMama
Cooling fan 12V DC fan (80x80x20mm)
Stepper motor Unipolar Stepper Motor 28-BYJ48
Brake system Gripper used to simulate load operating conditions
sensing system
Accelerometer 3-axis Accelerometer (CMPS11)
Thermocouple Type K
Encoder RotaryCWZ6C, 360 Pulses/Revolution)Encoder, Incremental (Omron
E6B2-Current transducer LEM HAS 50-S
Integrated circuits Diverse Operational Amplifiers (OP07), thermo-couple conditioner (AD597) and precision resistors
conditioning electronics system. Additionally a 12V fan was installed in order to keep the Arduino and shields cooled.
B. Signal Conditioning
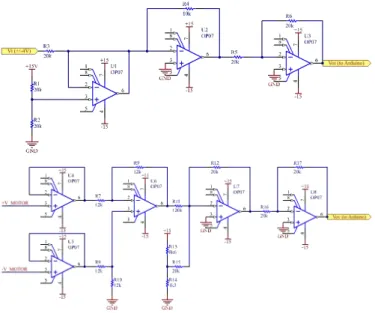
In order to make the signals coming from the sensors compatible with the Arduino input voltage range (i.e. 0-5V), a signal conditioning was performed. Therefore, circuits using operational amplifiers were designed for the current and voltage amplification and shift.
The circuit for the current signal conditioning is depicted in Fig. 2 (top), where a voltage shift and signal amplification is performed. The circuit is based on the HAS 50-S that provides a output voltage (V oi) that is proportional to the current which is flowing inside the hall-effect transducer element. In this way, a very good accurate and linear ±4V voltage signal is provided for a current range of±50A.
Considering the signal condition, the input voltage (Vi) at the Analog-to-Digital Converter (ADC) is expressed as:
Vi= 2(V oi−2) (1)
And the current signal (I) at the transducer element as:
I= 2(V oi−2) AM
VM (2)
Fig. 2. Signal conditioning circuits: current (top) and voltage (bottom)
With the previous signal conditioning, the relation between the circuit output signal (V ov) and the DC motor voltage (Vv) is given by:
V = 6V ov−VMAX (3)
where the VMAX is the nominal voltage applied to the DC motor, which in the present application is 12V.
The temperature of the DC motor housing is measured by a type K thermocouple, which signal is conditioned by using an AD597 circuitry. The motor speed and direction are measured by using an Omron E6B2, where the Z pulse pin is attached to an Arduino’s interrupt port allowing to detect the complete turn, while the ratio between A and B signals defines the rotation direction. Lastly, the motor’s vibration is measured by a CMPS11 compass, coupled to the motor housing, which provides the measurements already conditioned.
Other sensors were deployed to monitor the environment condition parameters, e.g., air temperature, humidity and pres-sure, allowing to correlate them with the motor conditions.
C. Motor Control Logic
An Arduino Mega was used to control the motor operation, as well as to retrieve the data from the sensors that is sent to the cloud. It also controls the brake system stepper motor, in this case using a ULN2003 power driver to logically control the motor coils, moving the grippers.
The control of the motor speed and direction was performed using the PWM (Pulse Width Modulation) technique in con-junction with the L298N H-Bridge shield. This way, a value between 0 to 255 in the analogue pin is used to set the motor speed, while its direction is controlled using a digital pin. Based on that, the motor operations are defined by controlling these two values direction. For instance, Fig. 3 (top) illustrates the behavior of such values in 6 motor operations.
Such operations were defined by control loops, coded based on finite states machine, where the transitions represent changes in the behavior of the speed/direction. Fig. 3 (bottom) illustrates the Arduino code of a simple control loop where initially, the speed linearly increases until the maximum (case 0), followed by a period where the maximum speed is kept constant (case 1), and finally by a period where the speed is reduced linearly until the motor stops (case 2). Among the implemented control loops, only 2 of them follows a closed loop, i.e., the encoder information is continuously analyzed, allowing to change the motor speed/direction when a given number of turns is reached. The other control loops are based on time intervals.
III. IOT COMMUNICATIONTECHNOLOGIES
The communication between the components in an IoT environment assumes an important aspect that is directly con-strained to devices and network resources, requiring specific protocols to attend different applications requirements. The data structure is another aspect that can affect the communi-cation and should be carefully defined in order to reduce the computation requirements and facilitate the ways the data is collected, preprocessed, transmitted, stored and analyzed. The next sections describe the most common lightweight protocols and how MQTT was used in this testbed.
switch(ctrlState) {
case 0: // linearly increase until the maximum speed
if((millis() - lastCycleTime) > TIME_INTERVAL){ lastCycleTime= millis();
motorRefSpeed++;
analogWrite(PWM_PIN, motorRefSpeed); }
if(motorRefSpeed == MOTOR_MAX_CTRL_SPEED){ ctrlState = 1;
} break;
case 1: // keep the maximum speed for some time
if((millis() - lastCycleTime) > STEADY_STATE_TIME){ lastCycleTime= millis();
ctrlState = 2; }
break;
case 2: // reduce the speed linearly until stop
if ((millis() - lastCycleTime) > TIME_INTERVAL){ lastCycleTime= millis();
motorRefSpeed--;
analogWrite(PWM_PIN, motorRefSpeed); }
if (motorRefSpeed == 0) {
ctrlState = 0; // restart the control loop
}
// for the sake of simplicity some code was omitted
break; }
A. IoT Lightweight Communication Protocols
Lightweight communication protocols are very important in IoT environments, being responsible to transmit the data through the network for a diversity of devices. A plethora of protocols have emerged, each one presenting different features and benefits that attend distinct application requirements.
In this context, the CoAP (Constrained Application Proto-col) provides HTTP interoperability with a reduced overhead, which uses UDP and multicast instead of TCP, and DTLS for the communications security. On the other hand, and probably the most commonly used IoT protocol, the MQTT employs a simple publish/subscribe protocol, using a minimal overhead and reliable communications. It is mostly used in applications with bandwidth or devices limitations.
Mostly used in the financing area, the Advanced Message Queuing Protocol (AMQP) also applies a publish/subscribe protocol but, contrary to MQTT, it offers mechanisms to guarantee the completeness of the transaction. This yields to a big overhead, being a drawback for lightweight IoT devices. More recently, DDS (Data Distribution Service) has re-ceived many attention since it offers important benefits when compared with others protocols. Particularly, instead of using a publish/subscribe protocol with a centralized broker, each node communicates in a peer-to-peer mode, using UDP multicast, which makes a good solution for the real-time data delivery.
B. Setting and Using MQTT
Considering the aforementioned and the motor testbed data requirements, particularly those related with reliability, loose-coupled and low-profile hardware, the MQTT protocol was selected. Fig. 4 illustrates the resulting IoT architectural per-spective. A Raspberry Pi, connected to the local network, was used to host an Eclipse Mosquitto MQTT broker. Through the Ethernet shield, the Arduino publishes the measured data that is later consumed by a Node-RED MQTT client, in a Cloud environment, which stores the data in a MongoDB database and also feeds an online monitoring dashboard.
Fig. 4. IoT electric motor testbed architecture
In the MQTT protocol, the messages are published follow-ing a hierarchical topic structure. Fig. 5 illustrates some of the defined topics, e.g., voltage, current, temperature and speed. Some control topics, e.g.,ctrlSpeedandctrlBrakeStatus, were also created to allow the synchronization of the control signals with the sensor data to enhance the data analysis tasks. The topics are published using the function client.publish(). Note that in the examples of Fig. 5 the values provided by the signal conditioning system are read from the analog pins and a voltage digital conversion (0-1023 to 0-5V) together with
// TOPICS DEFINITION
String topicVoltage = "motor/voltage";
String topicCurrent = "motor/current";
String topicTemperature = "motor/temperature";
String topicRPM = "motor/rpm";
//...
String topicReferenceSpeed ="motor/ctrlSpeed";
String topicBrakeStatus = "motor/ctrlBrakeStatus";
//...
// TOPICS PUBLICATION
client.publish(topicVoltage.c_str(),
String((analogRead(VOLTAGE_PIN) * (5.0 / 1023.0) * 6 - 12), 4).c_str());
֒→
֒→
client.publish(topicCurrent.c_str(),
String((((analogRead(CURRENT_PIN) * (5.0 / 1023.0) -2) * 2 * 50 / 4) / 8), 4).c_str());
֒→
֒→
client.publish(topicTemperature.c_str(),
String((analogRead(TEMPERATURE_PIN) * (5.0 / 1023.0)
/ 0.01), 4).c_str()); ֒→
֒→
Fig. 5. Examples of MQTT topic namespaces and publish functions
the aforementioned equations need to be applied to obtain the parameters in their respective unit of measurement.
IV. THEROLE OFBIGDATA IN THEIOT INFRASTRUCTURE One of the main challenges in IoT environments is the data management, namely the retrieval, transmission, storage and analysis. In this sense, data analytics and Big Data techniques are crucial to fully realize and leverage the IoT potentials.
A. Data Analytics along the IoT Architecture
An IoT environment comprises the Edge, Fog and Cloud layers [10]. Each IoT layer is characterized by the presence of hardware and software components that produce and/or consume different types and volume of data. In this context, regarding the data management, specially the data analytics aspects, it is possible to characterize each one of these layers according to their functional, data analysis, technological and implementation aspects, summarized in Fig. 6.
The Edge layer is characterized by heterogeneous devices, normally with restricted processing and storage resources, lim-iting the data analysis capabilities. The Fog layer comprehends
the components at the local network. This layer, besides being a requirement in many application domains since connecting all the things to the Cloud is not feasible for many kinds of devices and applications, can enhance the data analytics, reducing the amount of data and increasing the quality of the data send to the cloud, as well as endowing devices with self- and context awareness. The Cloud layer usually provides everything-as-a-service (XaaS). Given the large amount of available resources and data, this layer provides high level information to support decision making, planning and opti-mization systems.
Regarding the technological aspects, there is a plethora of widely used IoT and Big Data tools, (hardware/software) platforms and solutions, only briefly exemplified in Fig. 6.
B. Setting and Exploring Data Analysis Solutions
The deployment of the data analysis solution requires to define and develop the data acquisition and storage, and to perform data mining tasks, which encompass an exploratory data analysis (EDA), followed by the building and evaluation of the data models. In this sense, the preliminary experiments with the DC motor testbed explored some of the well known existing technologies (see Fig. 4).
The implementation of the data acquisition and storage, besides the aforementioned MQTT protocol, also considered the use of the Node-RED platform (nodered.org) and Mon-goDB database, both hosted in a Cloud server. Node-RED is a JavaScript-based platform with an extensive library of built-in functions (called nodes) and a user friendly built-interface that enables the fast and easy creation of flows that connect and combine IoT devices, services and applications. Some flows were developed to continuously retrieve the data published by the motor, integrate the data from the various sensors, check its consistence, and store the samples in the MongoDB. Also, thenode-red-contrib-graphspackage was used to create a dashboard to on-line monitor the raw data streams.
The data mining tasks were performed using the R platform, which comprises an excellent tool to perform the preliminary EDA, preprocessing tasks and execute several machine learn-ing algorithms. However, for solution deployment, other robust APIs can be used, such as, Weka and Apache Mahout, or Apache Spark and Storm for stream analysis.
Considering the DC motor testbed, several kinds of data analysis can be performed, regarding its electrical and me-chanical properties, as well as operational conditions. In this sense, at the Edge level (performed by algorithms running in the Arduino), the measurements can be filtered and smoothed to reduce the noise, and remove missing or erroneous values. For instance, knowing the variables boundaries and using simple logic or moving averages, values out of this range can be replaced to reduce the noise or indicate an abnormal-ity in the sensor system or environment. At the Fog level (performed in the Raspberry Pi) outliers and abnormality detection algorithms can be used to continuously monitor and identify abnormality behavior in the variables (e.g., voltage, temperature, vibration and speed). Time-series (TS) analysis
techniques can be used to develop and deploy predictive models in order to anticipate the future values of variables, and consequently the system conditions, and act properly to mitigate possible problems. Also other classification and predictive data models can be deployed to determine the general status and operational conditions of the motor (e.g., load, vibration, degradation, energy consumption).
At the Cloud level several algorithms for pattern recognition can be used to analyze the historical data and build the models to use at the Fog level. TS analysis techniques have also a great importance in this scenario, since the motor data is produced as a multivariate TS. This analysis can be used to extract features from operational data and then used to perform other tasks, for example, clustering, classification and prediction. For instance, the cluster analysis can be used to characterize the operations according to their performance (e.g., power consumption and speed) and quality (e.g., vibration).
V. ANALYSIS OFPRELIMINARYEXPERIMENTALRESULTS The motor testbed measures 14 samples of 15 raw variables per second, which can generate about 1.2 millions samples per day. The experiments comprise the execution of a sequence of the same or random operations (in this approach, one operation is related to the execution of one control loop described in Sec. II-C) and the collection of the data for a posterior analysis. For now, it is only covered the off-line data analysis in a batch and centralized mode, using the R platform. The packagesggplot2 and dygraphs were used to support the visualization, while wavelets and the functionhclustfor TS and cluster analysis.
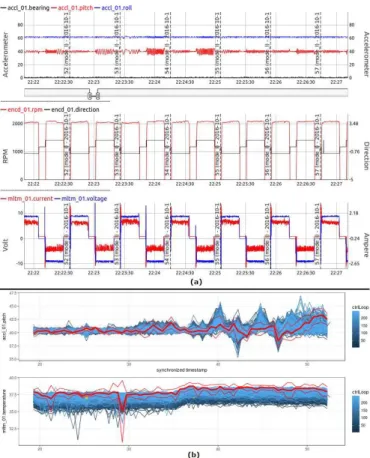
Initially, an EDA was performed to better understand the behavior of the motor in terms of its electrical, mechanical and operational aspects. Fig. 7 (a) illustrates the vibration, speed and electrical measurements of 6 executions of a given operation, where it is possible to identify 2 with abnormal vibration levels, as well as variation in the speed. Usually, the analysis of these magnitudes can be used to identify defects during the motor assembly phases or degradation during its life usage. Regarding the electrical parameters, the gap between the voltage and current curves illustrates that the motor has a different behavior according to the rotation direction.
The TS of each operation were synchronized (thus everyone started at the same time) and aggregated (2 samples per second) to analyze the variation in their behavior along the time. Some statistics were used to compute the mean and standard deviation values, thus determining the boundaries. Later, such boundaries can be used to verify the quality of the produced motor, or during its life-cycle, dynamic update the device monitoring rules. Fig. 7 (b) illustrates how the temperature and vibration vary along the execution of 250 op-erations, and their respective deviation boundaries. Regarding the temperature, it is possible to verify an increase of about 2 degrees during the experiment. The vibration levels presented a characteristic profile that in some moments went beyond the standard deviation boundaries.
Fig. 7. EDA: identification of (a) abnormal events and (b) general behavior
features were used later as input of a hierarchical clustering algorithm to perform two tasks: identify and cluster the different operations (see Fig. 3) and, considering the same operations, cluster them according to some features (vibration, energy consumption, temperature and speed). An example considering 100 operations is illustrated in Fig. 8. A clear distinction among the operations can be identified, but also the existence of subgroups among the same type of operation. On the other hand, the clusters A and G presented a greater similarity between them. The identified subgroups can be used to evaluate and differentiate the operations regarding the energy efficiency and quality (in term of vibration levels).
For instance, considering an electric motor used in a wash-ing machine, these kinds of analysis can be used in both contexts, at the end of the production line to test the motor after its production, as well as during its usage as a home appliance, detecting degradation and malfunction, in order to
Fig. 8. Hierarchical cluster analysis of the operations
adapt/optimize its behaviour, improve the customer support services and even the product future design.
VI. CONCLUSION
This paper presented the development of a smart and easy deployable but powerful electric motor testbed to explore and test several IoT and Big Data technologies. The smart motor testbed was achieved by equipping the motor with sensors and using an Arduino to control and collect data provided from these sensors, which is sent to the Cloud using the MQTT protocol, stored in a MongoDB and posteriorly analyzed using the R platform. The testbed showed to be feasible to produce, retrieve, transmit, store and analyze large amount of data.
The deployment effort was distributed between the IoT setup (hardware, control design and technology integration) and data analysis (EDA, TS analysis and clustering). The first showed to be robust to perform several control operations and properly measure and push the data to the other components. In this phase, EDA was widely used to understand the behavior of each parameter and define the analysis that can be per-formed in each IoT layer. On the other hand, the TS analysis showed to be challenging mainly due to the non-discrete-time data and the variable time take to perform each operation. The use of clustering techniques showed very promising results in the identification and assessment of control operations.
Future work is devoted to explore online data stream analysis technologies combined with multi-agent systems to support a distributed approach for data collection, analysis and visualization. Additionally, the use of a more challenging motor, e.g., an AC induction motor, may be explored.
REFERENCES
[1] L. Atzori, A. Iera, and G. Morabito, “The Internet of Things: A survey,”
Computer Networks, vol. 54, no. 15, pp. 2787–2805, 2010.
[2] S. Dey, A. Roy, and S. Das, “Home automation using Internet of Thing,” in2016 IEEE 7th Annual Ubiquitous Computing, Electronics & Mobile Communication Conference (UEMCON). IEEE, oct 2016, pp. 1–6. [3] K. Jadaan, S. Zeater, and Y. Abukhalil, “Connected Vehicles: An
Innovative Transport Technology,”Procedia Engineering, vol. 187, pp. 641–648, 2017.
[4] X. Fang, S. Misra, G. Xue, and D. Yang, “Smart grid—the new and improved power grid: A survey,” IEEE Communications Surveys Tutorials, vol. 14, no. 4, pp. 944–980, Fourth 2012.
[5] A. Zanella, N. Bui, A. Castellani, L. Vangelista, and M. Zorzi, “Internet of Things for Smart Cities,” IEEE Internet of Things Journal, vol. 1, no. 1, pp. 22–32, feb 2014.
[6] H. Kagermann and W. Wahlster and J. Helbig, “Securing the future of German manufacturing industry: Recommendations for implementing the strategic initiative INDUSTRIE 4.0,” ACATECH – German National Academy of Science and Engineering, Tech. Rep., 2013.
[7] P. Leitão, N. Rodrigues, J. Barbosa, C. Turrin, and A. Pagani, “Intelligent products: The grace experience,”Control Engineering Practice, vol. 42, no. 0, pp. 95 – 105, 2015.
[8] Cisco Systems, “Fog Computing and the Internet of Things: Extend the Cloud to Where the Things Are,” p. 6, 2016.
[9] F. Bonomi, R. Milito, P. Natarajan, and J. Zhu, Fog Computing: A Platform for Internet of Things and Analytics. Cham: Springer International Publishing, 2014, pp. 169–186.
[10] Y. Simmhan, “IoT Analytics Across Edge and Cloud Platforms -IEEE Internet of Things,” 2017. [Online]. Available: http://iot.ieee.org/ newsletter/may-2017/iot-analytics-across-edge-and-cloud-platforms [11] S. Nandi, H. A. Toliyat, and X. Li, “Condition monitoring and fault