methods of study
Dagobert SoergelPh.D. em Ciência Política pela Universidade de Freiburg – Freiburg - Alemanha. Professor da University of Maryland - Maryland, NY - USA.
www.dsoergel.com
E-mail: [email protected] [email protected]
Recebido em: 15/08/2014. Aprovado em: 23/1/2015. Publicado em: 07/08/2015.
Abstract
This paper discusses and illustrates through examples how meaningful or deep learning can be supported through well-structured presentation of material, through giving learners schemas they can use to organize knowledge in their minds, and through helping learners to understand knowledge organization principles they can use to construct their own schemas. It is a call to all authors, educators and information designers to pay attention to meaningful presentation that expresses the internal structure of the domain and facilitates the learner’s assimilation of concepts and their relationships.
Keywords: Information Science. Knowledge Organization. Information Retrieval.
Organização do conhecimento para o aprendizado. Conjecturas e métodos de estudo.
Resumo
Discute e ilustra, com exemplos, como o aprendizado significativo ou profundo pode ter apoio por meio de apresentação de material bem estruturado, ao oferecer aos aprendizes esquemas que possam usar para organizar o conhecimento em sua mente, auxiliando-os a entender princípios de organização do conhecimento que podem ser usados para construir seus próprios esquemas. É um chamado a todos os autores, educadores e designers de informação a considerar a apresentação significativa que expresse a estrutura interna do domínio e facilite a assimilação, pelo aprendiz, de conceitos e seus relacionamentos.
Palavras-chave: Ciência da informação. Organização do conhecimento. Recuperação da infomação.
La organización del conocimiento para el aprendizaje. Suposiciones y métodos de estudio.
Resumen
Examina e ilustra, con ejemplos, como el aprendizaje significativo o profundo puede ser apoyado a través de material de presentación bien estructurada, para proporcionar a los estudiantes los esquemas que pueden utilizar para organizar el conocimiento en sus mentes, y ayudarles a entender principios de organización del conocimiento que pueden utilizar para construir sus propios esquemas. Es un llamado a todos los autores, educadores y diseñadores de la información para considerar la presentación significativa que exprese la estructura interna del dominio y facilite la asimilación por el alumno de conceptos y sus relaciones.
INTRODUCTION
People use information to seek meaning, make sense, learn. These are just three terms for the same activity: building and updating structures in the mind. Structures relate entities - things, events, processes, abstract concepts.
Deep learning (MILLIS, 2010) requires learners to build structures in their minds, to understand relationships, causes and effects, implications. We discuss and illustrate how to assist learners in in this task by:
• Presenting material in a structured way that enables a reader/viewer to see relationships and use them to update and build structures in the mind;
• Designing interfaces with catalogs and other information systems as meaningful structures from which learners absorb structures subliminally as they interact with information systems;
• Teaching learners principles of KOS structure and presentation so that they can discern/develop the structure of a domain, organize knowledge in their minds, and create their own presentations. Most learning and sensemaking theories agree that peoples’ memories consist of structures that tie many pieces of information and knowledge together and that learners must assimilate new information in relation to these knowledge structures existing in their minds, fitting new facts into existing structures, updating these structures, or creating entirely new structures if the new information does not fit. (See ZHANG; SOERGEL, 2014 for a review.) There also is wide agreement that structured presentation of knowledge helps assimilation by learners. The effectiveness of learning depends a great deal on the existing structures that the learner can bring to bear
“The organization of material is very important. In the presentation of ideas by the teacher or writer, organization is needed for clear understanding and mastery on the part of the hearer or reader. In almost all kinds of material there are intrinsic and logical connections which can be used for arranging the material. When the student makes any acquisition he will find it to his ad-vantage to organize it, if it is not already organized; first, so that he can clearly understand it; second, so that he can recall it when he so desires. This logical organization is just the kind of thing that makes the results of learning superior to those of mnemonic systems. The intrinsic relationships among the facts are thus made clearer, which is precisely what it should be. Artificial systems fail to do this; indeed they may even lead one to neglect most significant relationships. The mastery of one who has command of a given field is largely due to the fact that he has organized his material; when he recalls, his facts are in groups, such as might appear in written form under paragraph, section, or chapter heads; when he learns new facts, they find their appropriate place immediately in his scheme of organization.”
(EDWARDS, 1925, p. 78-79 quoted BLISS, 1929, p. 87) on acquiring, assimilating, and constructing new (to her) knowledge. There is no reason to believe that learners can construct the best structures for various domains of knowledge without assistance. So helping learners to construct the best structures in their minds should start as early as possible and will have a cumulative effect.
Despite the importance of well-structured meaningful presentation on information for learning, instructional design literature does not appear to provide much guidance on how to structure knowledge for instructional presentation. This is where the field of knowledge organization comes in. This paper presents, through examples, several ways for structuring information for learning, acknowledging that the effectiveness of these proposals requires much study.
The importance of knowledge organization for education has been recognized for centuries; if it were recognized in practice today, there would be no need for this paper. Among strong proponents are Henry Evelyn Bliss (1929,1939)1 and Barbara Kyle in
discussions of the Classification Research Group (CRG) (MCILWAINE; BROUGHTON, 2000). Bliss also mentions the possibility that users will pick up and internalize schemas for the organization of knowledge from meaningful arrangement of books in libraries (and today from the arrangement of subject directories on the Web or the arrangement of menu choices) and use these schemas for the organizing knowledge in their minds. Millis (2010) emphasizes the importance of information organization for “deep learning”.
This paper is a call to sense, to thoughtfulness, to meaningful structure and against the many displays that show a lack of thought, sense, and meaning seen on the Web, in library catalogs, and elsewhere (see Figure 13a for an example). Educators, information designers, and others involved in creating such displays need support from Knowledge Organization professionals. This paper is also a call for more collaboration and interchange between information science, especially its subfield of Knowledge Organization, and education, especially instructional design, reading and writing, and educational outcome measurements. There is much the two fields can learn from each other. In particular, Knowledge Organization professionals must become familiar with how KO-related tools are used and tested in education and with the methods of such testing. Perhaps Section 4 of this paper will provide an impetus in this direction.
TOOLS FOR BUILDING STRUCTURES AND EXTERNAL REPRESENTATION OF STRUCTURES
There are a number of tools for structuring and presenting knowledge:
1. Entity-relationship modeling - the basis; 2. Schemas, frames, scripts, templates;
2.1 Facets and frames;
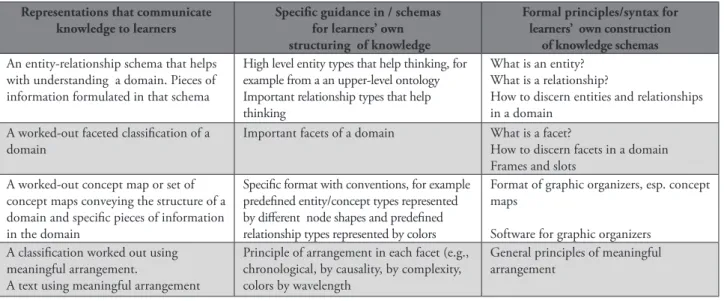
Figure 1 - From representations that communicate knowledge to formal KO principles
Representations that communicate knowledge to learners
Specific guidance in / schemas for learners’ own structuring of knowledge
Formal principles/syntax for learners’ own construction
of knowledge schemas
An entity-relationship schema that helps with understanding a domain. Pieces of information formulated in that schema
High level entity types that help thinking, for example from a an upper-level ontology Important relationship types that help thinking
What is an entity? What is a relationship?
How to discern entities and relationships in a domain
A worked-out faceted classification of a
domain Important facets of a domain What is a facet?How to discern facets in a domain Frames and slots
A worked-out concept map or set of concept maps conveying the structure of a domain and specific pieces of information in the domain
Specific format with conventions, for example predefined entity/concept types represented by different node shapes and predefined relationship types represented by colors
Format of graphic organizers, esp. concept maps
Software for graphic organizers A classification worked out using
meaningful arrangement.
A text using meaningful arrangement
Principle of arrangement in each facet (e.g., chronological, by causality, by complexity, colors by wavelength
General principles of meaningful arrangement
Source: created by the auhor
3. Semantic networks, concept maps, and other node-link diagrams;
4. Meaningful arrangement.
In addition, there are the principles of
componentiality (compound concepts expressed as
a combination of elemental concepts), hierarchical
inheritance, and inference that learners should be
able to apply in structuring knowledge in their minds; these are not further discussed in this paper. Tools for many representations and software that assists in knowledge construction are available in The Knowledge Forum described in Scardamalia (2003,2004) 2
The tools for organizing and presenting knowledge can be used by authors and by learners (Figure 1): • By authors to structure documents that
communicate knowledge to learners;
• By learners to develop and present their own structures as they assimilate information - a constructivist approach where the learner is “in the driver’s seat “ (BROOKS; BROOKS, 2001). Some of these tools can also be used for testing and for probing into the cognitive structure students or others hold in their minds.
The next section will discuss each of these approaches in turn as they might apply to learning. For some of the tools there is empirical evidence of how well they work, for others this paper defines interesting research questions. Results of any such studies, past and future, must be looked at with great caution because they depend on many factors, including3:
• The characteristics of the learner;
• Domain/topic of learning and the type of knowledge to be learned;
• The conceptual quality of representations; • The quality of the information display (paper or
screen) and/or of the interaction with computer systems.
USING KNOWLEDGE STRUCTURES AS TOOLS FOR LEARNING: EXAMPLES
This section discusses first entity-relationship modeling which forms the conceptual basis for schemas / frames and semantic networks / concept maps. There are many ways to show knowledge structures to learners for any of the three uses shown in Figure 1. Tools that are meant to assist learners in structuring information are known as graphic organizers: “A graphic organizer is a visual and graphic display that
Figure 2 - Entity-relationship modeling of information about animals (partial)
Entity types Relationship types
Object Organism Taxon Length Weight Color LocomotionType SoundType GeographicLocation GeographicRange Biome Habitat TimeOfDay ActionType Duration CommunicationMethod Organism Organism Organism Organism Organism Organism Organism Organism Organism Organism Organism Organism Organism Organism Organism Organism Organism Organism <belongsTo> <hasHeight> <hasWeight> <hasColor> <hasPart> <movesIn> <makesSound> <foundIn> <livesIn> <livesIn> <eats> <eatsAtTime> <getsFoodThrough> <eatenBy> <activeAt> <communicatesBy> <hasEnemy> <hasLifespan> Taxon Length Weight Color Object LocomotionType SoundType GeographicRange Biome Habitat Object TimeOfDay ActionType Organism TimeOfDay CommunicationMethod Organism Duratrion Note: <eatenBy> implies <hasEnemy> Source: created by the auhor
depicts the relationships between facts, terms, and or ideas within a learning task.” Graphic organizers can take many forms: a simple outline, a table, a structure-of-an-argument diagram, a concept map with blank spots. Graphic organizers have been shown to improve learning. (HALL; STRANGMAN, 2002, 2013, an excellent introduction). On using structured knowledge to support learning see Jonassen et al. (1993) and other works by Jonassen.
ENTITY-RELATIONSHIP MODELING (E-R MODELING)
An entity-relationship model provides a vocabulary for expressing data/knowledge in a domain. A worked-out model can be helpful to a learner in grasping the essential structure of a domain and to make and organize statements in a domain, for example, about animals (Figure 2). Having a learner work out an entity-relationship model - with corrective feedback from the teacher/mentor/coach as needed - leads to even deeper understanding and equips the learner to develop a deep understanding of other domains. Figure 2 shows a simple worked-out E-R model for information about animals. This model forms the basis for defining facets and a resulting facet frame represented in a graphic organizer as shown in Section 3.2.
At a much higher level, there are upper-level ontologies, RO, the new OBO Relations Ontology, can be used in conjunction with the Basic Formal
Ontology (BFO), which defines very general entity
types, such as, roughly speaking, thing and process.4
There are other schemes of very general relationship types, for example the link types defined in McCagg & Dansereau (1991) for what they call knowledge maps
or k-maps, such as influences, part; characteristics (p. 320, Figure 2), relationship or link types defined for hypertext, or the relevance relationships from Huang & Soergel (2013) illustrated in Figure 3. Relevance relationships help people think.
4 See http://code.google.com/p/obo-relations/ and http://ncorwiki.buffalo.edu/index.php/Basic_Formal_Ontology_2.0 and, respectively. 5 Explore at http://sig.biostr.washington.edu/projects/fm/index.htmlt)
Hypothesis 1
Students who learned the entity types and relationship types in a domain will learn more from reading, integrate what they learned better with previous knowledge, recall what they learned over a longer time, are better able to ask questions, and can write better in the domain.
An E-R schema is an ontology. It can be fleshed out by giving for each entity type the possible values. In practice, ontologies are developed primarily for the purpose of structuring data in databases. But a good ontology is very useful for teaching/learning, providing more return on the enormous investment of intellectual effort. This requires a human-readable version of the ontology with attention to meaningful arrangement (see Section 3.4). As an example, consider the Foundational Model of Anatomy (ROSSE; MEJINO, 2003)5, see Figure 4. The
complete system includes a wealth of anatomical knowledge structured by this schema. We propose that this ontology, properly presented, could be quite helpful to students in an introductory anatomy course.
Figure 3 - Relevance relationships that help people think
User topic ‘Food in Auschwitz’ for illustration
Information items (segments of Holocaust survivor interviews) can relate to the topic in different ways:
Direct relevance: Direct evidence for what the user asks for
Example: In an interview passage a Holocaust survivor talks about food available to Auschwitz inmates.
Indirect relevance: From which one can infer something about the topic
Example: A Holocaust survivor talks about seeing emaciated people in Auschwitz
Context relevance: Provides background/context for topic
Example: A Holocaust survivor talks about physical labor of Auschwitz inmates
Comparison relevance: Provides information on a similar or contrasting situation Example: A Holocaust survivor talks about food in the Warsaw ghetto
Hypothesis 2
Student who understand these relevance relationships prepare richer descriptions and analyses of historical events using more and more types of information
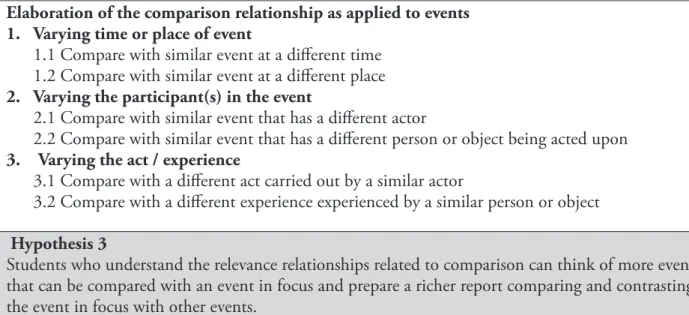
Elaboration of the comparison relationship as applied to events 1. Varying time or place of event
1.1 Compare with similar event at a different time 1.2 Compare with similar event at a different place
2. Varying the participant(s) in the event
2.1 Compare with similar event that has a different actor
2.2 Compare with similar event that has a different person or object being acted upon
3. Varying the act / experience
3.1 Compare with a different act carried out by a similar actor
3.2 Compare with a different experience experienced by a similar person or object
Hypothesis 3
Students who understand the relevance relationships related to comparison can think of more events that can be compared with an event in focus and prepare a richer report comparing and contrasting the event in focus with other events.
Source: Huang & Soergel, 2006
Figure 4 - Foundational Model of Anatomy
Entity types Relationship types
Schematic representation of the principal classes of the Anatomy Taxonomy. (Rosse & Mejino, 2003, Fig. 4, p. 486)
(Part of Rosse & Mejino, 2003, Fig. 8, p. 491)
Anatomical transformation relationships “describe the transformation of anatomical entities during the ontogeny of an organism”.(p. 481)
Hypothesis 4
Students who are taught anatomy using the Foundational Model of Anatomy have a better grasp of the structure of the body.
Source: Created by the auhor
SCHEMAS, FRAMES, SCRIPTS, TEMPLATES
“Schemata can be loosely defined as patterns which represent the way experience and knowledge are organized in the mind.” (MEURER, 2008; see RUMELHART, 1980 for a good introduction, http://en.wikipedia.org/wiki/Frame_(artificial_ intelligence) a good introduction to schemas of the frame flavor). A schema organizes the different aspects of a topic (such as different pieces of information about some object, elements of an argument, sections of a document, steps in a process into a coherent structure. The “slots” in a schema or frame can be arranged in a linear order (most often) or in a 2-D network structure. Such a schema elicits the information needed to describe an object, such as an animal (Figure 5) or the material aspect of a 2-D art object (Figure 11); thus it helps learners to develop a mental framework and use that framework as a guide for inquiry and for organizing information in their minds. A schema,
Figure 5 - Slots for a graphic organizer on animals (comprehensive list to choose from) Student Name ______________ Animal Name ______________ | Text or pictures Classification - My animal is a - What kind of animal? - This class of animals is known for:
Appearance - What does it l look like - Describe your animal. Looking at your animal, what do you see? Body, shape | Size, Height |Weight | fur/feathers | Color(s)
Body parts: Face, facial features (incl. teeth, beak), Legs — number and length (incl. claws ) How does the animal move? (ex: hop, slither) - How does your animal travel?
Sounds it makes - If your animal makes any sounds, what do they sound like? Home (Biome + habitat + range) - Where does the animal live?:
Detailed description of its habitat(home) (ex: rainfall, temperature, soil, plants , part of the world) Range: The areas of the world where your animal can be found. Continent(s), country (ies) Biome (a region that has similar climate and plants throughout). Check one)
___ocean ___rainforest ___tundra ___freshwater ___deciduous forest ___coniferous forest ___grassland
Habitat (the natural environment where an animal lives. It includes its shelter and the area in which it getsits food. - Describe your animal’s habitat. - Habitat: Where do they live?
How has the animal adapted to its habitat? (ex: coloring, hibernation, heavy fur in winter)
especially a facet frame, can also be used to elicit components of a query for retrieval.
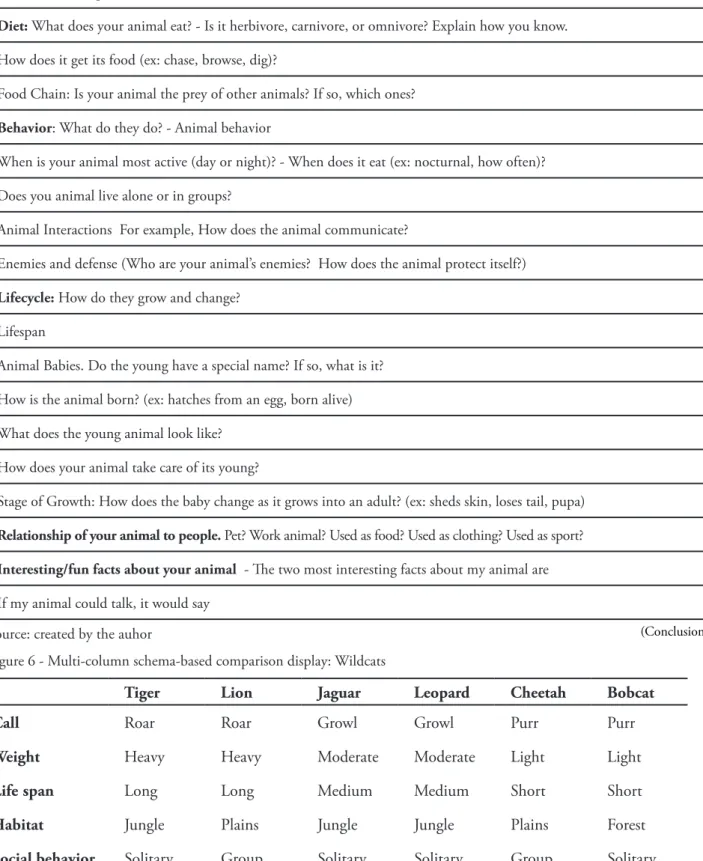
This section gives a few examples to illustrate how schemas can help learning. Figure 5 shows a pre-constructed schema based on the E-R model from Figure 2 in form graphic organizer; from the rather a large list of slots a selection should be made for the specific learners and learning task. Such an organizer helps learners to organize information about animals. Even deeper learning might be achieved by having learners construct their own schema. For example, give a team of students the task of comparing three animals so they must come up with a schema of characteristics on which the animals can be compared. Figure 6 gives a schema for analyzing a scientific theory and Figure 7 gives an example of a schema to structure a text, in this case the presentation of a course unit (which in the general definition used in discourse analysis is a text).
Diet and Feeding Habits
Diet: What does your animal eat? - Is it herbivore, carnivore, or omnivore? Explain how you know. How does it get its food (ex: chase, browse, dig)?
Food Chain: Is your animal the prey of other animals? If so, which ones? Behavior: What do they do? - Animal behavior
When is your animal most active (day or night)? - When does it eat (ex: nocturnal, how often)? Does you animal live alone or in groups?
Animal Interactions For example, How does the animal communicate?
Enemies and defense (Who are your animal’s enemies? How does the animal protect itself?) Lifecycle: How do they grow and change?
Lifespan
Animal Babies. Do the young have a special name? If so, what is it? How is the animal born? (ex: hatches from an egg, born alive) What does the young animal look like?
How does your animal take care of its young?
Stage of Growth: How does the baby change as it grows into an adult? (ex: sheds skin, loses tail, pupa) Relationship of your animal to people. Pet? Work animal? Used as food? Used as clothing? Used as sport? Interesting/fun facts about your animal - The two most interesting facts about my animal are If my animal could talk, it would say
Source: created by the auhor
Figure 6 - Multi-column schema-based comparison display: Wildcats
Tiger Lion Jaguar Leopard Cheetah Bobcat
Call Roar Roar Growl Growl Purr Purr
Weight Heavy Heavy Moderate Moderate Light Light
Life span Long Long Medium Medium Short Short
Habitat Jungle Plains Jungle Jungle Plains Forest
Social behavior Solitary Group Solitary Solitary Group Solitary
Range Confined Vast Confined Confined Vast Confined
Source: Kauffman et al., 2010
Figure 7 - A schema for analyzing / learning about a scientific theory (DICEOX)
1.
D
escription A short summary of the theory, which should include (a) phenomena, (b) predictions, (c) observations, (d) definitions.2.
I
nventor/history A brief account of the theory’s history, which should include (a) name(s), (b) date, (c) historical background.3.
C
onsequences A concise summary of how the theory has influenced man. This shouldinclude (a) applications, (b) beliefs.
4.
E
vidence A short summary of facts that support or refute the theory. This shouldinclude (a) experiments, (b) observations.
5.
O
ther theories. A concise summary of theories dealing with the same phenomena. These areusually of two types: (a) competing theories, (b) similar theories.
6.
X
-tra information An open category that should include any important information not inone of the other five DICEOX categories Source: Brooks & Dansereau, 1983
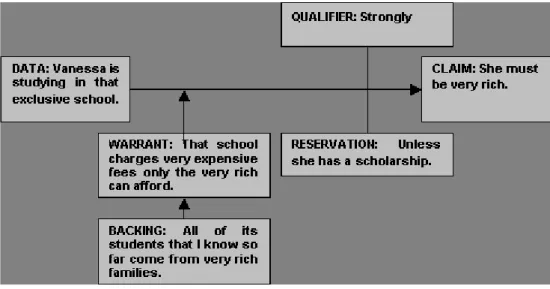
Figure 8 - An argument map: Toulmin’s model of argumentation
Source: Demeterio, 2001
Figure 9 - A schema or script for a course unit introducing a concept
Concept An explicit statement of the
concept
Background A reactivation of previous
knowledge
Idea A statement of the basic idea
or an analogy to illustrate it
Example 1 A concrete example of the
concept
Example 2 A counterexample (if possible)
(Conclusion)
Example 3 Another example of the
concept
Summary A resume of the material
Questions A series of questions to test
comprehension of the concept
Problem A problem with real data to be
solved in class
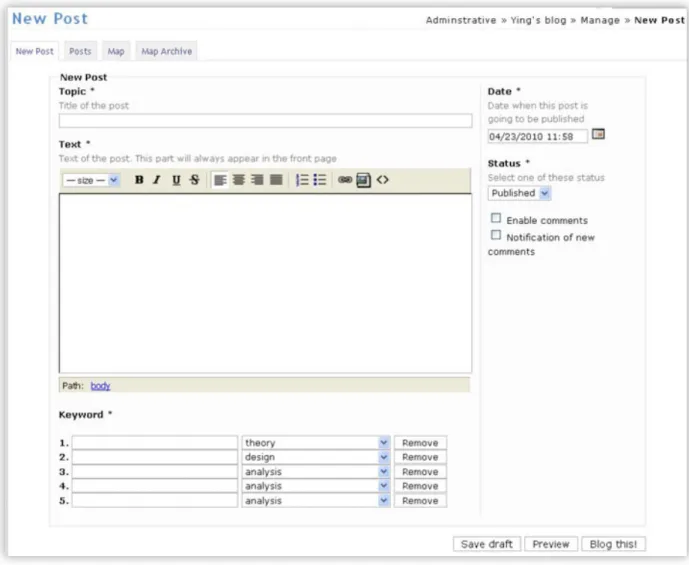
Figure 10 - Template for creating discussion board posts with keywords
As an aid to students’ reflections, the template provides a drop-down list of general categories (including theory, design, and analysis) one of which must be specified for each keyword.
Source: Xie and Sharma (2011a, p. 699), also in Xie & Sharma (2011b, p.5)
FACETS
Facets are a special case of slots in a schema or frame. A schema of facets focuses on defining or describing a topic or object through a combination of elemental concepts or semantic features, as in:
girl = human ⊓ child ⊓ female (facets or slots: Taxon, AgeGroup, Sex)
mare = equine ⊓ adult ⊓ female
This use of facets can be considered the simplest form of description logic. (For a primer of description logic see KRÖTZSCH et al., 2013.) Facet analysis is a powerful tool for understanding the conceptual structure of a domain and for formulating queries. Learners can be taught both the principles of faceted classification and the use of faceted schemes (VICKERY, 1960).
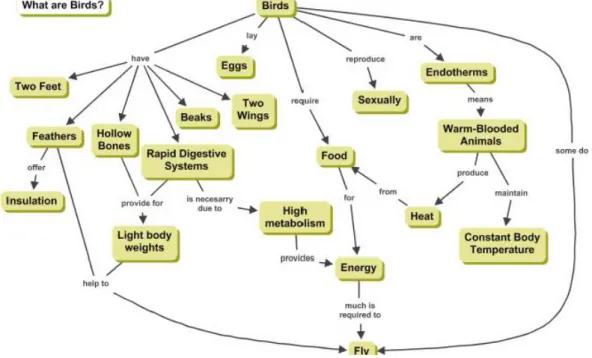
Figure 12 - Concept map about birds
Source: Cañas & Novak
Figure 11 - A facet frame for material description of 2-D art object A coating or medium (such as paint, pencil, ink)
B sub-coating (in the description “pencil over ink”, ink is the sub-coating) C surface to which the medium is applied (canvas, wood, glass, etc.) D Subsurface on which the surface is mounted
E technique (how the coating is applied to the surface, such as painting, spraying, printing process) (often implied rather than given explicitly) Source: Ahn et al. (2014)
SEMANTIC NETWORKS, CONCEPT MAPS, AND OTHER NODE-LINK DIAGRAMS “Concept maps are graphical tools for organizing
and representing knowledge. They include concepts, usually enclosed in circles or boxes of some type, and relationships between concepts indicated by a connecting line linking two concepts. Words on the line, referred to as linking words or linking phrases, specify the relationship between the two concepts.” (NOVAK; CANAS, 2006,2008; see NOVAK, 2010 for extensive discussion; see EDUTECH Wiki for a good short introduction with illustrations of different
types of concept maps). Both presenting information in the form of preconstructed concept maps and having learners construct their own concept maps have been found to improve learning for many (but not all) learners in many conditions; for a review see Nesbit & Adesope (2006), especially the conclusions, p. 434. Many concept maps are hierarchical branching out from a center; that is just a different graphic presentation of a frame. The concept map in Figure 12 shows more complex connections between concepts.
Concept maps can be drawn by learners / authors by hand or using software; or a learner can produce a list of concepts and their relationships and have a computer program arrange them in a map (as in XIE; SHARMA, 2011a, p. 695). Concept may include representations of concepts other than words (perhaps rather vague); Yen et al. (2012) allowed for images, possibly taken by students. Some “concept” maps include other entities (people, events, … )
A concept maps that shows the relationships among concepts treated in a text can be used as a guide to assist in understanding the text or to assess the text writer’s grasp of the text’s subject, for example, Lima (2006) and Hsu (2013). There is software to extract from a text important concepts and their relationships and display them as a concept map, for example, Oddy et al. (1982) (a simple algorithm to explicitly analyze information need that is described in a paragraph, Carley (1997) and Carley et al. (2007).
HIERARCHY AND MEANINGFUL ARRANGEMENT
Meaningful arrangement collocates related subjects and, at a higher level, expresses intrinsic relationships in the subject domain, such as time sequence or levels of complexity or a prerequisite sequence important for learning. In a physical library collocation minimizes walking when assembling books on related subjects. In a Web directory, collocation reminds users of related subjects. A user who sees subjects close together forms an association in the mind. So meaningful sequence is important, and the effort to determine the right sequence pays off. Bliss (1929) provides many insights on the meaningful arrangement of the system of the sciences that are still useful today. Consider Figure 13a. The arrangement of the subdivisions of the animal kingdom in the Britannica Elementary Encyclopedia does not reflect the standard taxonomic order in biology and adds two odd-man-out categories at the
6 www.teacherspayteachers.com/Product/Animal-Report-template-and-concept-map-82871
bottom. One graphic organizer lists choices for the class of and animal arranged in entirely unhelpful alphabetical order:
amphibians, birds, fish, insects, mammals, reptiles6
To prepare children for later biology lessons, the arrangement in Figure 13b is far preferable. It takes some work to find the modern approach to taxonomy as represented in Figure13c and simplify it for children. Figure 13b also uses terms children can understand, taking them from there to scientific names. Icons could be added. The display may need to be simplified depending on the age of the intended audience. Figure 14 gives another example.
Meaningful hierarchy can be very useful in laying out the concepts that students should understand in a course or learning goals and objectives. There are many examples:
• The general Taxonomy of Educational Objective first created in 1956 under the editorship of Bloom, then revised in Anderson & Krathwohl (2001); • Subject-specific curriculum frameworks, such
as the Atlas of Science Literacy, curriculum frameworks issued by the College Board, for example in physics (COLLEGE BOARD, 2014), or the MIT Biology Concept Framework (Figure 15, the sequence at the top level could be further improved);
• Standards of Learning issued and used by countries, provinces/states, and school systems across the globe, such as, in the US, the Common Core State Standards (NATIONAL GOVERNORS ASSOCIATION, 2010).
Principles from knowledge organization could be used to improve the arrangement of such standards, to improve retrieval access, and to correlated these standards among themselves and with Knowledge Organization Systems that are widely used in libraries and other information systems.
Figure 13 - Classification of animals
a. Britannica Elementary:
Menu for Animal Kingdom
b. Meaningful arrangement
Animal Kingdom
Animals without a spine (invertebrates)
Snails, octopus, mussels (mollusks) Bugs (insects), spiders, crabs (arthropods)
Animals with a spine (vertebrates) Fish
Frogs, toads, salamanders (amphibians) Lizards&snakes, crocodiles, dinosaurs, birds
Lizards&snakes, crocodiles, dinosaurs (reptiles)
Birds
Elephants, whales, cows, dogs, bats, mice, monkeys
(mammals)
c. Vertebrates cladogram (basis for b.)
http://users.rcn.com/jkimball.ma.ultranet/BiologyPages/V/Vertebrates.html
Hypothesis 5
Young students who use the animal home page with the meaningful arrangement will over time absorb the sequence and perceive a progression. When much later in biology the structure of the animal kingdom and the evolution of animals are discussed, these students will understand more quickly
Figure14 - Meaningful arrangement of body systems (by increasing complexity and integrative function) XF body system or organ
XG . musculoskeletal system XH . skin system
XJ . cardiovascular system XK . respiratory system
XL . mouth, larynx, vocal organ XM . digestive system
XN . urogenital system XP . urinary system XQ . reproductive system XR . blood, immune system XS . blood
XT . immune system XU . endocrine system XV . sensory system XW . nervous system
XY . . peripheral nervous system XZ . . central nervous system XZ8 . . . brain
Source: Alcohol and Other Drug Thesaurus (http://etoh.niaaa.nih.gov/aodvol1/aodthome.htm) Figure 15 - MIT Hierarchical Introductory Biology Concept Framework (BCF)
(http://web.mit.edu/bioedgroup/HBCF/CBE-Summer2004.htm
(a) Top level
1. Biology is based on observational and experimental science.
2. At the molecular level, biology is based on three-dimensional interactions of complementary surfaces.
3. The cell is the basic unit of life.
4. All cells share many processes/mechanisms. 5. Cells interact with other cells.
6. Cells are created from other cells.
7. DNA is the source of heritable information in a cell. 8. A gene is the functional unit of heredity.
9. The structure of DNA dictates the mechanism of the production of nucleic acids and proteins. 10. Sexual reproduction is a powerful source of variation.
11. Life processes are the result of regulated chemical reactions. 12. Proteins perform many varied functions in a cell.
13. Recombinant DNA technology allows scientists to manipulate the genetic composition of a cell. 14. The expression of genes is regulated.
15. All carbon-containing biomass is created from CO2.
16. Populations of organisms evolve because of variation and selection. 17. Organisms and the environment modify each other.
18. In multicellular organisms, multiple cell types can work together to form tissues which work together to form organs.
(b) Section 10 in detail.
Placing essential details into the lower levels of the hierarchy provides them with a context that makes them easier to understand
10 Sexual reproduction is a powerful source of variation.
10-1 Sexually reproducing diploid organisms get one copy (allele) of each gene from each parent and pass one allele on to each of their offspring at random. See 8-3. 10-1-1 One exception is sex-chromosome encoded genes in males.
10-1-2 Alleles are passed on to offspring without respect to the phenotype they confer. 10-1-3 An individual passes only one allele of each gene to its offspring. See 6-3-1. 10-1-3-1 Exception in 10-1-1 here applies for males and females.
10-1-3-2 The phenotype of an individual depends on the combination of alleles from both parents. 10-1-3-2-1 See exception in 10-1-1.
10-1-4/16-4-1 Only mutations in germ line cells will be passed on to the offspring. See 6-3, 10-2-2. 10-1-5 Somatic mutations are passed on to any descendants of the mutated cell within the organism, and can cause non-inherited disease. 10-2 Diversity is introduced in gamete formation.
10-2-1 Sexual reproduction allows for great diversity and fast change (through bringing together genetic information from two parents). See 6-3. 10-2-2 Gamete production in meiosis (2nà 4nà 2nà n) allows for reshuffling of parental genetic information through independent segregation of chromosomes. See 10-1-2. 10-2-3 Recombination—the exchange of parts of chromosomes between homologous pairs of chromosomes—increases the rate of reshuffling of parental genetic information
compared to 10-2-2 alone. See 8-7-1.
10-2-3-1 Recombination occurs during meiosis, after the DNA has been duplicated and the homologous chromosomes are lined up.
METHODS OF STUDY
This section follows the framework for analyzing a research topic shown in Figure 16. Figure 16 - Framework for analyzing a research topic
1 Research questions / foreshadowing questions (aspects of the topic)
2 Impact / significance
Why do you care? Will other people care? (not to be confused with statistical significance)
Practical significance
Theoretical significance / significance for the discipline
(basis for gaining more knowledge, relationship to other results, basis for generalization)
3 Major variables 4 Methods
5 Results (when done) Source: created by the auhor
Research questions / foreshadowing questions (aspects of the topic).
The general research question this paper is concerned with is:
How do methods and tools for learning and instruction that are based on knowledge organization principles affect learning?
For actual research studied this question needs to be specialized; at the end of Section 4.1 Major variables we present a template for doing so.
Impact / significance. Practical, theoretical
The topic has high practical significance. Using educational materials designed using knowledge organization principles as discussed in previous sections has the potential to achieve better educational outcomes:
• Students have a better grasp of subjects;
• Students have better cognitive strategies, critical thinking;
• Great potential benefit to the economy, government, society at large.
More broadly, many types of information presentation can potentially be improved using knowledge organization principles, allowing users to more quickly assimilate information and to more easily develop meaningful structures in their minds and make sense of the information. So the principles discussed can be,
and to some extent are, applied in human-computer interaction, an area that is closely linked and overlaps with instructional design, conceptually if not always in practice.
The topic has high theoretical significance, both in information science and in neighboring fields, especially psychology and cognitive science, including such areas as reading and interpretation of graphical representations. In information science, the task of structuring information for ease of comprehension and learning may inspire a search for deeper understanding of the conceptual structure of subject domains. Studying how people assimilate and process well-structured presentations and use them to update and improve structures in their minds may well contribute to our understanding of how the mind works.
MAJOR VARIABLES
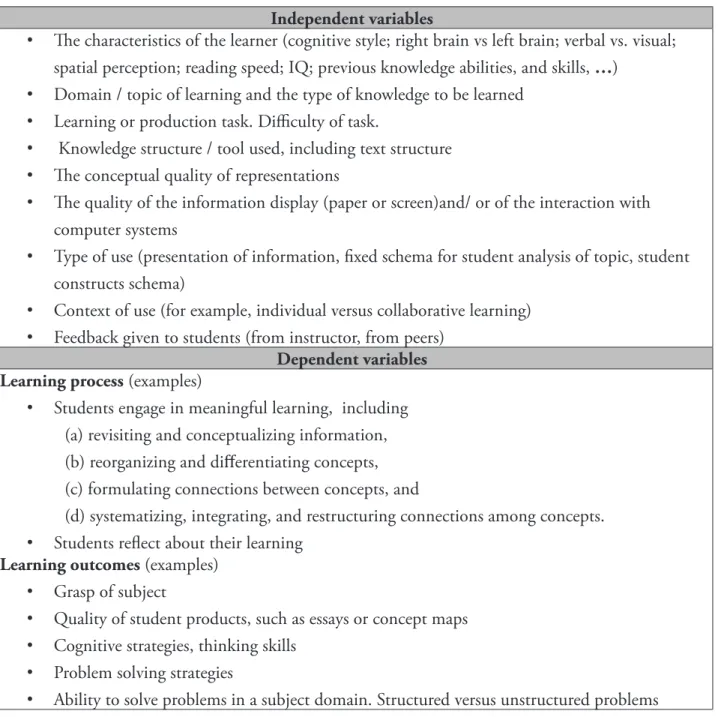
Figure 17 shows an overview of independent and dependent variables to be considered in studying the effects of knowledge organization on learning. A fairly comprehensive list can be found at www. dsoergel.com/KOSForLearningVariables.
Figure 17 - Independent and dependent variables. Overview
Independent variables
• The characteristics of the learner (cognitive style; right brain vs left brain; verbal vs. visual; spatial perception; reading speed; IQ; previous knowledge abilities, and skills, …)
• Domain / topic of learning and the type of knowledge to be learned • Learning or production task. Difficulty of task.
• Knowledge structure / tool used, including text structure • The conceptual quality of representations
• The quality of the information display (paper or screen)and/ or of the interaction with computer systems
• Type of use (presentation of information, fixed schema for student analysis of topic, student constructs schema)
• Context of use (for example, individual versus collaborative learning) • Feedback given to students (from instructor, from peers)
Dependent variables Learning process (examples)
• Students engage in meaningful learning, including (a) revisiting and conceptualizing information, (b) reorganizing and differentiating concepts, (c) formulating connections between concepts, and
(d) systematizing, integrating, and restructuring connections among concepts. • Students reflect about their learning
Learning outcomes (examples) • Grasp of subject
• Quality of student products, such as essays or concept maps • Cognitive strategies, thinking skills
• Problem solving strategies
• Ability to solve problems in a subject domain. Structured versus unstructured problems Source: created by the auhor
As can be seen, many factors influence learning, such as (to repeat the most important ones from Figure 17: • The characteristics of the learner;
• Domain / topic of learning and the type of knowledge to be learned;
• The conceptual quality of representations; • The quality of the information display (paper
or screen) and/or of the interaction with computer systems.
This dependence on many variables presents a major caveat for study design: Aggregate results (such as might be presented based on studying the effect of a tool or presentation format in a classroom) may show
no effect when for individual students, depending on their characteristics, there may be an effect.
The question is not Does a tool work?
But: For whom, in what circumstances does
In education there is considerable discussion of Aptitude-Treatment Interaction (SNOW, 1989) and its instructional design corollary, Aptitude-Treatment Matching (CRONBACH; SNOW, 1981).
This multi-dependence requires that research questions be formulated very carefully. The template
Even this formulation does not capture the complexity of reality. Understanding, abilities, and skills are formed through a number of experiences that build on and interact with each other.
A FEW REMARKS ON METHODS Conduct of studies and sampling
Many studies are done in laboratories or in classrooms that are used as laboratories. Often outcomes are measured a short time after a learning experience, but what really counts are long-term
effects. Measuring learning outcomes at the end of a course is better, but still not enough. On the other hand, over the long term there may be many other influences on the knowledge or skill to be measured, so that the contribution of the learning experience under investigation is hard to determine. Not all effects are measurable; often the most interesting or important effects are not, making for a rather impoverished image of reality for those researchers and proponents of quantitative assessment for whom what cannot be measured does not exist. Figure 18 - A template for constructing precise research questions
How does
a given method / tool for learning and instruction that is based on knowledge organization principles
in a situation characterized by
• The characteristics of the learner
• Domain / topic of learning and the type of knowledge to be learned • Learning or production task. Difficulty of task.
• Knowledge structure / tool used, including text structure • The conceptual quality of representations
• The quality of the information display (paper or screen)and/ or of the interaction with computer systems
• Type of use (presentation of information, fixed schema for student analysis of topic, student constructs schema)
• Context of use (for example, individual versus collaborative learning) Feedback given to students (from instructor, from peers)
affect
the learning process or a specific characteristic of the learning process and/or
the learning outcome or a specific characteristic of the learning outcome Source: created by the auhor
shown in Figure 18 can be used as a guide. Reading research, which is quite relevant in the context of this paper, heeds this principle to a considerable extent; see, for example, Dickson & Kameenui (1995).
While for some random sampling is the holy grail of selecting participants for a study, random sampling in assignment to the treatment and control groups is often not possible. Consider hypothesis 5 above. Assigning young children to using websites on animals with different top-level menus and then study these same children in high school biology is impractical (and for a researcher who believes that meaningful arrangement is better for learning would be unethical). So the only practical way to study this question is to try to find out from the high school biology students what kind of reports on animals they did as young children and what websites they used (assuming they remember). But then we do not know whether the students who used a website with meaningful arrangement differ systematically on some other characteristic that may influence how well they understand high school biology.
Qualitative methods, observing people in natural settings, examining work products, asking people to self-report about their learning, in-depth case studies have a big role to play here and may often lead to insights that cannot be achieved in any other way. Again, and to conclude this section: It is very important to collect as much data about each study participant as feasible so that one can study interaction among many factors. Big Data may help if it is possible to correlate data about the same person from different data sets.
MEASURING LEARNER CHARACTERISTICS A discussion would go well beyond the scope of this paper. See, for example, Psychological testing (Wikipedia), Kubiszyn & Borich (2013).
MEASURING LEARNING OUTCOMES
Studies of using the kinds of tools described in this paper often use performance in a course (tests of knowledge and/or problem solving ability, papers) as outcome measure. Tests for reading comprehension (Morsy 2010) are also important. The quality of essays has also been measured by using a program to abstract a concept map that captures the relationships
covered in the essay (see Section 3.3) and then measuring the quality of the concept map.
Discussions about using concept maps as
assessment tools and measures of concept map quality abound (e.g., CHAMPAGNE et al., 1981; NOVAK; GOWIN, 1984; JONASSEN et al., 1997; MCCLURE et al. 1999; RICE et al. 1998; RUIZ-PRIMO, 2004). Ruiz-Primo et al. (2001) compared two of the most commonly seen concept maps: a highly directed version called ‘‘fill-in-the-map’’ and a less-directed version called ‘‘construct-a-map-from-scratch.’’ (XIE; SHARMA, 2011a, p. 703).
Naveh-Benjamin et al. (1986), based on previous work by others, discuss the “Ordered Tree Technique” to infer student’s cognitive structures. The technique assumes that people store concepts in hierarchical trees and that the tree structure largely determines the order in which a person recalls concepts or arranges a set of give concepts; concepts in a bottom-level chunk (bottom-level concepts linked to a common parent) are recalled together. From the order of recall or arrangement one can than infer the hierarchy tree in the person’s mind and compare that tree with the “ideal” tree developed by a domain expert.
A Cognitive strategies and critical thinking are hard to measure, but there are tests available, see Critical Thinking Sources.
Checking structures for their meaningfulness for a given audience. One way to approach this issue is semiotic inspection, part of the method of semiotic engineering (Semiotic engineering, Wikipedia; DE SOUZA et al., 2006; PRATES; BARBOSA, 2007).
RESULTS
This section gives several examples of studies that assessed the effectiveness of some of the tools discussed in this paper for learning; it is not a complete review. The methods used are mostly
quantitative; few studies consider individual variations, and we found no studies that explored in depth the mechanisms by which the tools interact with the learner’s mind.
EFFECTIVENESS OF TEACHING ENTITY-RELATIONSHIP MODELING AND MODELS
We found no examples of teaching general relationship types to enhance ways of thinking or entity-relationship schemas or ontologies to increase understanding of a subject domain.
EFFECTIVENESS OF SCHEMAS, FRAMES, SCRIPTS, TEMPLATES
There are a number of studies on schemas as tools for learning. Kauffman et al. (2011) found that using a template for note taking as compared with free-form note taking increased “both the amount of information gathered and achievement”, especially with a template using the Multi-column schema-based comparison display (which they call “matrix”, Figure 6). Kaufman (2010) found such displays are effective for communicating information, improving both recall of facts and recognition of patterns. Argument maps are special type of template (Figure 8). Christopher et al. (2013) (in a more extensive follow-up to CHRISTOPHER et al., 2010) compared argument map reading and construction with hierarchical outlining, text summarization, and text reading as learning methods. They found that argument map reading and construction significantly increased subsequent immediate recall for arguments in both passive and active learning settings.
Xie & Sharma (2011b, p.4) summarize Scardamalia (2003) as follows: “Attaching appropriate keywords requires students to stop, think, and re-conceptualize and categorize their writing with keywords” and found in their own study that tagging blog posts promotes reflection and critical thinking. See also the earlier study by Davis (2003).
A schema can specify a way of thinking about a topic, for example, DICEOX. A schema for analyzing /
learning about a scientific theory (Figure 7). Brooks & Dansereau (1983) studied how this schema affects processing of texts about scientific theories and found that (1) text with a high-level organization following the DICEOX schema facilitates recall (possibly in the same way in which story grammar facilitates story understanding) and (2) simply learning the schema helps with recall while reading text not organized by DICEOX - DICEOX becomes part of the intellectual toolbox of the learner.
Research in reading comprehension is very relevant here. It shows the importance of text organization, schemas, and meaningful structure. It also shows that results are best when a text is well organized and the reader has knowledge of text organization and schemas. This topic deserves its own review from a knowledge organization perspective. We just give a few pointers: Mann &Thompson (1988) (on rhetorical relationships that make up text structure, Rhetorical Structure Theory); Dickson & Kameenui (1995) (an extensive analytical review of the literature); Gersten et al. (2001) (a review focusing on students with learning disabilities); McCrudden (2004); Kendeou & Broek (2007); Hess (2008) (very useful summary of text structure elements); Meurer (2008) (Schemata and reading comprehension); Butler (2010) (review of comprehension instruction); Morsy (2010) (review of measures of reading comprehension).
EFFECTIVENESS OF SEMANTIC NETWORKS, CONCEPT MAPS, AND OTHER NODE-LINK DIAGRAMS.
Concept maps have been studied extensively; the main message is that, while concept maps are useful as tools to convey information, students learn most from constructing their own concept maps, particularly if they do so collaboratively or receive feedback in other ways.
7 They give many references on the effectiveness of concept maps; for still further references on concept map effectiveness see http:// edutechwiki.unige.ch/en/Concept_Maps.)
The meta-analysis by Nesbit & Adescope (2006) concluded that concept maps have small positive effects on learning. In their literature review, Chmielewski & Dansereau7 (1998) state that:
Spatial-semantic displays have been found to be effective (a) in cooperative interactions (Patterson, Dansereau, & Wiegmann, 1993) [confirming the usefulness of concept maps in collaboration, Scardamalia (2003) found that mapping bulletin board posts helped students to construct knowledge collectively]” (from (Xie & Sharma 2011b, p.4),
(b) as pre- and post-study aids (Alverman, 1981; Moore & Readance, 1984),
(c) as substitutes for traditional text (Darch, Carnine, & Kameenui, 1986), and
(d) for updating and editing knowledge (Chmielewski, Dansereau, & Moreland, 1997) [The found that “knowledge maps are more effective than text for facilitating the integration of knowledge”}
Xie & Sharma (2011a, p. 695, 2011b, p. 4) found that constructing concept maps helps “students to make connections between different parts of an experience” and “ to manipulate concepts into a meaningful picture of their own knowledge or learning”. Xie & Sharma (2011b) suggest that creating “ordered trees” (NAVEH-BENJAMIN et al., 1986, see Section 4.4) can help “students to think about concepts, the relationship between these concepts, and the structure of an entire course.” Chmielewski & Dansereau (1998) further found that mapping training helped people learn from text when not explicitly using a mapping strategy, in other words, using knowledge mapping techniques alters a person’s information-processing strategies and skills when these techniques are not explicitly used.
As an example of interaction of variable, Morse, & Jutras (2008) studied a science course in which students created their own concept maps each week and, in one section, also met in teams to construct a team concept map. They found that for their students concept maps without feedback had no significant effect on performance, whereas concept maps with feedback from team members produced a measurable increase in student problem-solving performance and a decrease in failure rates.
Concept maps are useful for organizing information and thoughts about a topic. Chung & Neuman (2007) observed that for students collecting information for a class assignment concept maps, introduced by the researchers as way to probe students’ thinking as they searched for information, became a major tool to organize their information (p. 1514) and that students used the main concepts reflected in their maps as conceptual guides (p. 1513). They also observed that the technique of concept mapping influenced students’ information seeking and use but did not pursue this effect in their study (p. 1508). This is consistent with Gordon’s (2000) finding that having students draw concept maps of a search topic resulted in better searches; she found that, … concept mappers were able to use a large number of search words, use a greater variety of search terms, and use opening moves more frequently, such as query reformulations and search options. (cited form CHUNG; NEUMAN, 2007, p. 1505).
EFFECTIVENESS OF MEANINGFUL ARRANGEMENT
There is hardly any research on this to be found. Kauffman et al. (2010) observed that the multi-column schema-based comparison display on wildcats (Figure 7) was most effective if both the rows (the schema for describing the items, in the example wildcats), and the columns (the items to be compared) were arranged in a meaningful (logical) order.
CONCLUSION
The underlying theme of this paper is the meeting of conceptual structures in the mind and presented on external media. External representations should be structured so that the reader or viewer can integrate the data and structures presented with the structures that exist already in his or her mind, changing and improving the structures in the mind as needed. Our major tenet is meaningful external structures that represent reality and other people’s thought facilitated the formation of meaningful and useful structures and interpretations of reality in the mind.
Creating such meaningful representations is hard work and requires deep understanding of both the subject matter to be represented and the intended audience. This is why we often see arbitrary and poor structures that are not helpful. Finding out what representations work best and acting on the findings would be greatly helped by the coming together of several communities working on these problems, often addressing the same issues under different guises, namely knowledge organization and the broader field of information science; human-computer interaction, information design, instructional design; education, especially reading research or, more broadly, communicative literacy, cognitive science, and linguistics. Such boundary crossing will give each community a larger arsenal of research methods and lead to the discovery of general principles that underlie seemingly separate phenomena and ultimately better design to benefit learners and users.
NOTE
A first much smaller version of this paper appeared as Soergel 2014
ACKNOWLEDGMENTS
I thank Eileen Gardner and Jill Perttula for assistance in compiling the bibliography and extracting and synthesizing information for this paper.
REFERENCES
AMERICAN ASSOCIATION FOR THE ADVANCEMENT OF SCIENCE. Atlas of science literacy, v.1. Mapping K–12 science learning, 2001. Retrieved from:
<http://www.project2061.org/publications/atlas/>.
AMERICAN ASSOCIATION FOR THE ADVANCEMENT OF SCIENCE. (2007). Atlas of science literacy, v.2. Mapping K–12 science learning, 2007. Retrieved from:
<http://www.project2061.org/publications/atlas/>.
AHN, J. et al. Mapping between ARTstor terms and the Getty Art and Architecture Thesaurus. Submitted to International Society for Knowledge Organization (ISKO) Conference 2014.
ANDERSON, L.W.; KRATHWOHL, D.R. A taxonomy for learning, teaching, and assessing: a revision of bloom’s taxonomy of educational objectives. [S.l.]: Pearson, 2001. 336p.
BLISS, H. The organization of knowledge and the system of the sciences. New York: H. Holt and Company, 1929. 460p. BLISS, H. The organization of knowledge in libraries and the subject-approach to books. New York: The H.W. Wilson Company, 1939. 335p. BORÉM, G.A.; LIMA, O. (2007). Modelo hipertextual - MHTX: um modelo para organização hipertextual de documentos hypertext model: HTXM: a model for hypertext organization of documents. Revista de Ciência da Informação. v.8, n.4. Retrieved from:
<http://www.dgz.org.br/ago07/Art_03.htm>.
BROOKS, L.W.; DANSEREAU, D.F. (1983). Effects of Structural Schema Training and Text Organization on Expository Prose Processing. Journal of Educational Psychology. v.75, n.6, p.811-820, 1983.
BROOKS, J.; BROOKS, M. In search of understanding: the case for constructivist classrooms, ASCD. 2nd ed. [S.l.]: Pearson, 2001. 136p. BUTLER, S. et al. A review of the current research on comprehension instruction. 2010. Retrieved from:
<http://www2.ed.gov/notclamped/programs/readingfirst/support/ compfinal.pdf>.
CARLEY, K.M. Extracting team mental models through textual analysis. Journal of Organizational Behavior, v.18, p.533–558, 1997. CARLEY, K.M. et al. ORA user’s guide 2007 (Technical report). Carnegie Mellon University, School of Computer Science, Institute for Software Research. Retrieved form: <http://www.casos.cs. cmu. edu/projects/ora/publications.php>. Access: dec,, 2007.
CAÑAS, A.; NOVAK, J. Constructing your first concept map. Retrieved form: <http://cmap.ihmc.us/docs/ ConstructingAConceptMap.html>. Access: 30 jan. 2014. CHAMPAGNE, A. B. et al. Structural representations of students’ knowledge before and after science instruction. Journal of Research in Science Technology, v.18, p.97-111, 1981.
CHMIELEWSKI, T.L.; MORELAND, J.L.; DANSEREAU, D.F. Integrating new information into prior knowledge. In: ANNUAL CONVENTION OF THE AMERICAN PSYCHOLOGICAL ASSOCIATION, 1997.
CHMIELEWSKI, T.; DANSEREAU, D. Enhancing the recall of text: knowledge mapping training promotes implicit transfer. Journal of Educational Psychology, v.90, n.3, p. 407-413, 1998. THE COLLEGE BOARD. (2014). AP physics 1: algebra-based and AP physics 2: algebra-based course and exam description. Including the curriculum framework. Effective Fall, 2014. Retrieved from: <http://media.collegeboard.com/digitalServices/ pdf/ap/ap-physics-1-and-2-course-and-exam-description.pdf>. CLASSIFICATION RESEARCH GROUP. Retrieved from: <http://en.wikipedia.org/wiki/Classification_Research_Group>. Access: 30 jan. 2014.
CRITCAL THINKING SOURCES. (nd). Critical thinking testing and assessment. Retrieved from: <http://www.criticalthinking.org/ pages/critical-thinking-testing-and-assessment/594>.
CRONBACH, L.J.; SNOW, R.E. Aptitudes and instructional methods: a handbook for research on interactions. New York: Ardent Media, 1981. Retrieved from: < https://books.google.com. br/books?id=i6u9zjdu3wsC&printsec=frontcover&dq=Aptitudes+a nd+instructional+methods:+a+handbook+for+research+on+interact ions&hl=pt-BR&sa=X&ei=1M-7VI