AR
TICLE
Mortality by road traffic accidents in adolescents and young
people, Brazil, 1996-2015: will we achieve SDG 3.6?
Abstract This paper aims to analyze the main characteristics of Road Traffic Accidents (RTA) mortality in Brazil for the period 1996-2015, focusing on the 10-29 years’ age group. This is a two-step study consisting of (i) a bibliographic re-view on the topic of traffic violence in Brazil, and (ii) a study on RTA mortality in the Mortality Information System (SIM). The former situates the state of the art of scientific production on the theme and produces the theoretical reference for the analysis of the latter. During the period, about 39,000 people died by RTA, of which about 13,200 adolescents and young people died. The coun-try should curb mortality to somewhere around 19,500/year and, among adolescents and young people, to 6,500/year to achieve SDG 3.6. With the establishment of the Brazilian Traffic Code (CTB), RTA mortality rate fell between 1997 and 2000. The rate increased in the subsequent decade. The focus on adolescents and young peo-ple help us understand that, in the post-CTB and Prohibition, male black and brown motorcyclists became the main victims. The literature provides data analysis and shows that reduction is cur-rently submitted to an articulated discussion that involves worker’s health, gender, employment, ur-ban mobility and advertising policies. Concerning SDG, this means that achieving SDG 3.6 is a pro-cess that involves interacting with policies target-ing other SDGs.
Key words Traffic accidents, Policies, SDG
Marcelo Rasga Moreira 1 José Mendes Ribeiro 1 Caio Tavares Motta 1 José Inácio Jardim Motta 1
1 Departamento de Ciências Sociais, Escola de Saúde Pública, Fiocruz. Leopoldo Bulhões 1480, Manguinhos. 21041-210 Rio de Janeiro RJ Brasil.
M
or
eir
a MR
Introduction
A global problem, traffic violence received par-ticular attention from the United Nations, which included it in the Sustainable Development
Goals (SDG) and Agenda 2030, via target 3.6: by
2020, halve the number of global deaths and
inju-ries from road traffic accidents1.
In Brazil, from 1996 to 2015, 21.057.086 people died, of which 2.656.875 were due to External Causes (12.6%). Among the External Causes, Road Traffic Accidents (RTA) appear as the second most recurring cause, accounting for the death of 733,120 people (27.6% of the deaths from the cause and 3.5% of the total deaths for
the period)2. Of the total number of road traffic
fatalities, 264,643 (36.1%) were people aged 10-29 years, which means that, in Brazil, from 1996 to 2015, on average, 36 young people/day died by RTA.
The data are more conclusive when working morbidity: from 1998 to 2015, 2.272.068 peo-ple were hospitalized by RTA, and 1.046.225 (46.0%) were aged 10-29 years, an average of
159/day3. Thus, young people are one of the
pri-mary victims of this manifestation of violence and, therefore, the universe of this study focuses on their mortality by RTA.
National initiatives to cope with traffic vi-olence have focused on legislation with more punitive tendencies, such as the 1998 Brazilian Traffic Code (CTB) and Law Nº 11.705 of 2008 (Prohibition). Although punitive measures and sanctions are appropriate, it is imperative to un-derstand that manifestations of violence are pol-ysemic and complex, and require a holistic analy-sis of the relationships that give rise to them.
In the case of traffic violence, one cannot discuss coping measures that do not analyze, among others, issues of worker health (motorcy-cle courier drivers and other categories of drivers with high exposure to RTA); mental health (both with respect to the psychological conditions for driving concerning the use of alcohol and oth-er drugs); poor presoth-ervation of roads and public highways; media appreciation of cars’ speed and drivers’ audacity; public policies and societal ac-tions covering the automotive industry the devel-opment of safe vehicles with accident prevention technologies; public transport, urban mobility and sustainable cities; and traffic education poli-cies for drivers and in schools.
With this in mind, this paper intends to con-tribute to the debate and fight against traffic vio-lence. Thus, it assumes the objective of analyzing
the main characteristics of RTA-related mortality in Brazil among people aged 10-29 years, from 1996 to 2015, seeking to subsidize policies that facilitate target 3.6 of the SDGs/2030 Agenda.
Methodological aspects
The study was carried out in two articulated stag-es. The first one consisted of a bibliographical
re-view of the topic of traffic violence in Brazil. The
second one consisted of a study on mortality by RTA in the Mortality Information System (SIM). The proposal is that the former locates the state of the art of scientific production on the theme and produces the theoretical reference for the analysis of the latter.
Brazil has a historical difficulty in delimiting “adolescence” and “youth”: there are divergent definitions; some other definitions are not diver-gent and focus their analysis on different charac-teristics (some in chronology and biology, oth-ers in the social issue, for example); legislations are in place, such as the Statute of the Child and
Adolescent (ECA)4 and the Youth Statute (EJ)5,
which formalize different age segments; and we have the SIM, which works with its age groups.
As it is of interest to the paper to study Bra-zilian traffic violence and, from there, to make a contour of adolescents and young people, we adopted the 10-29 years’ age group. This option covers and articulates three essential references for the study: (i) the Youth Statute, which defines as “young” people aged 15-29 years; (ii) the ECA, which considers as “adolescents” people aged 12-18 years; and (iii) WHO, which establishes the
period between 10-19 years as “adolescence”6.
The bibliographic review focused on the sci-entific production published in the SciELO da-tabase. The research conducted on July 19, 2017,
adopted as search strings traffic, traffic violence
and traffic safety, and as search fields, Title and
Summary (free translation of words and sentences
from Portuguese).
In parallel, the SIM was investigated for deaths caused by Road Traffic Accidents. The time bracket 1996-2015 was adopted to cover the entire period in which the System codifies its
in-formation according to the 10th Revision of the
International Classification of Diseases (ICD-10)7.
In ICD-10, Transport Accidents8 are in
e C
ole
tiv
a,
23(9):2785-2796,
2018
Pedal cyclist (V10-V19), Motorcycle rider (V20-V29), Occupant of three-wheeled motor vehicle (V30-39), Car occupant (V40-V49), cupant of pick-up truck or van (V50-V59), Oc-cupant of heavy transport vehicle (V60-V69), Bus occupant (V70-V79), Other road traffic accidents (V80-V89), Water transport accidents (V90-V94), Air and space transport accidents (V95-V97), Other and unspecified transport ac-cidents (V98-V99).
This paper will consider the types of victims related to Road Traffic Accidents (V01 to V89).
Traffic Violence in Brazil:
reflections from a bibliographical review
The literature review revealed the role of the health sector in studies on traffic violence: of the 170 papers, 135 (79.4%) were published in
jour-nals in this field, with emphasis on Cadernos de
Saúde Pública (24), Revista de Saúde Pública (20)
and Ciência & Saúde Coletiva (17), which
con-centrate 45.2% of the works. Another 22 papers (12.9%) stem from the field of Psychology and Social Psychology. The remaining 13 (7.6%) are distributed across Social and Political Sciences (4), Geography and Geosciences (2), Demogra-phy (3), Economics (1), Architecture and Urban-ism (2), and Media (1) journals.
The oldest paper of this review was published in 1972. From that year until 2001, another 19 were published. Since then, the number of papers has grown considerably: from 2002 to June 2017, 151 were published in an annual upward move-ment.
The 170 selected papers were classified into 8 categories created from the object of study of the papers, which becomes the criterion of
inclu-sion and excluinclu-sion in the categories: Alcohol and
Drugs: papers whose objects are blood alcohol
levels and TA-related psychoactive alterations;
Attention and Care: characteristics and strategies
of care for traffic victims; Behavior: behaviors
and risk behavior conducts and patterns in
traf-fic; Gender: discourses and patterns of conduct
by gender in traffic relationships; Costs: hospital
expenses and loss of productivity of the injured
in traffic; Work Accidents: impact of traffic
vio-lence on the achievement of work and health of
workers; Promotion and Prevention: public
pol-icies to fight against traffic violence; and
Mor-bimortality: epidemiological profile of fatal and
non-fatal victims.
Morbimortality (61 papers, 35.9% of the
to-tal)is the one that gathers more papers, followed
by Promotion and prevention (32, 18.8%);
Behav-ior (23, 13.5%); Work Accidents (18, 10.6%);
At-tention and Care (16, 9.4%); Alcohol and Drugs
(15, 8.8%); Gender (3, 1.8%); and Costs (2, 1.2%).
The following is a summary of these catego-ries to construct the theoretical reference of the paper, which is the basis of the analysis of data on mortality of adolescents and young people, presented later.
Behavior
The papers in this category discuss the re-lationships that involve traffic issues in Brazil, highlighting social, cultural, status and power aspects.
Rozestraten9 analyzes the traffic as a social
problem in which cars, pedestrians, buses, mo-torcycles, bicycles, trucks, etc. move according to their interests and positions, in different direc-tions, disputing space. The author concludes that
the interests of persons participating in the traffic
are not the same and necessarily clash.
Pitanga10 stresses that by producing a situation
of constant conflict and tension in a space that is believed to be equal for all – the street – traffic tends to become a socially hierarchical space.
Thus, in Brazil, the vehicle emerges not only as a means of locomotion but as an instrument of status and oppression, becoming a symbol of superiority, object of desire and social ascension, with which the “motorized citizen” enjoys power, freedom, and sense of privilege.
Hantower11 affirms that the conflict between
pedestrians and drivers is a reflection of the in-equality expressed in national traffic, where ve-hicular traffic is privileged in front of pedestrians. Based on the 2012 National School Health
Survey (PeNSE), Duarte and Garcia12 evaluated
the prevalence and factors associated with the be-havior of schoolchildren under the age of 18 who drive without a license in Brazil. Of the 106.621 survey respondents, 27.0% said they had driven at least once in the previous 30 days, while 12.9% said they frequently drove (4 or more times). Re-alizing a prevalence of this behavior in males, the authors consider that, to adolescents, the act of driving is a symbol of social status not allowed for the children, an expression of independence of the parents’ vigilance. Driving would be part of a process of conquest and establishment of au-tonomy, interaction and social acceptance.
Sauer and Wagner13 argue that the pressure
M
or
eir
a MR
young people more susceptible to risky behav-iors that influence driving: alcohol and drug use, speeding, illegal maneuvers, carelessness with safety equipment, a feeling of omnipotence and a tendency to overestimate their abilities.
Gender
In addition to hierarchizing the different qualities of road users and distinguishing ado-lescent groups, the papers gathered here indicate that traffic also reflects values, stereotypes, and behaviors based on gender and gender relation-ships.
Investigating perceptions about drivers, in
Recife, in 2005, Almeida et al.14 identified that
female drivers tend to perceive themselves and to be perceived by men as prudent, attentive and cautious, with a tendency to obey traffic rules, practicing a more defensive direction, with a greater vision of danger and causing fewer ac-cidents. On the other hand, they are also seen as slow, insecure and dangerous drivers. Men see themselves and are seen by women as reck-less and aggressive at the wheel: they jump the queues, they make risky maneuvers, they brake at the last minute. However, they are identified as safer and more determined. Authors affirm that these perceptions reflect a patriarchal society that encourages men not to respect the rules of traffic to assert themselves as machos, imposing them-selves by virility.
In another paper, when comparing the risk behavior among men and women involved in RTA from a survey of 609 victims attended in
emergencies in Porto Alegre, Saldanha et al.15
found that more than 70% of the victims were male. Of these, 75.2% were drivers. Among wom-en, 18.6% were drivers. The study showed a high-er frequency of alcohol, marijuana, and cocaine use among men, and greater use of anxiolytics among women.
These papers consolidate an understanding that, to achieve the reduction proposed by SDG 3.6, not only repressive measures should be ad-opted, which also explains the option of starting the analysis of the bibliographic review by such categories.
Alcohol and Drugs
Papers in this category work on alcohol, mar-ijuana, stimulants, opiates and so forth as risk factors in the driving of vehicles, causing psycho-physical and neuromotor changes in the drivers,
compromising the coordination, the integrity of the reflexes and the peripheral vision; modifying the perception of speed, the reaction time, the ability to concentrate, vigilance and alertness; causing sedation, drowsiness and indifference to external stimuli; and compromising, also, the
maintenance of self-criticism16,17.
Studying risk factors associated with accidents and violence in the city of Rio de Janeiro, between
1998 and 2005, Cruz et al.18 identified that, of the
1,300 medical records of the Forensic Medicine Institute in which positive blood alcohol levels were identified, 570 (43.8%) were from RTA.
When investigating the risk of frequent alco-hol abuse in traffic accidents, based on the 2013 National Health Survey of 2013, Damacena et
al.19 found that young people should be the focus
of public policies on the issue of motor vehicle
traf-fic accidents and alcohol abuse.
In view of this reality, the principal measures adopted in Brazil are the repressive hardening of
legislation, as Nascimento and Garcia20 point out:
Decree-Law No. 3.651, of 1941, which sanctioned drivers in a state of proven drunkenness; Resolu-tion No. 737 of the CONTRAM, of 1989, which regulates the actions and means of proving the driver’s drunk driving; institutionalization of the CTB, which criminalizes the act of drunk driv-ing; and the enactment of Law No. 11.705 (Pro-hibition), which creates zero tolerance to alcohol in drivers and establishes mechanisms of super-vision and punishment.
Work Accidents
The papers in this category show that RTA also converge with occupational accidents.
In the 1970s, when analyzing fatal work ac-cidents in the city of Campinas, Ferreira and
Mendes21 found that motor vehicle traffic
acci-dents accounted for 50.1% of all fatal work
ac-cidents, emerging as the most frequent external
cause for this type of accident, and transport
ve-hicles’ drivers were the most affected professional
category. As a result, they stated that work and traffic accidents are indissociable, warning the company’s responsibility in their prevention.
Particular attention should be paid to RTA in-volving motorcycles. A cheap alternative to cars, efficient in the combination of transport-work in the chaotic traffic of large cities, and an option to inefficient collective transportation, motorcycles predominate in the delivery market, providing a possibility of income for young people without
e C
ole
tiv
a,
23(9):2785-2796,
2018
Studying the characteristics of motorcycle courier drivers’ accidents in Londrina and
Mar-ingá, in 2005-2006, Soares et al.23, found that
82.9% of the respondents reported accidents at work and 56.3% knew colleagues that had been removed from work due to motorcycle accidents.
According to the Denatran23, in Brazil, the
motorcycle fleet increased by 137.8% between 2002 and 2008 and consecrated as the most pop-ular means of individual transport in the
coun-try, totaling about 25% of the national car fleet22.
On the other hand, a 190.5% increase in the number of RTA fatalities involving
motor-cyclists23 was recorded between 2000 and 2006.
Also, motorcyclists were seven times more likely to
show a higher risk of death, four times more likely to show bodily injury and twice as many pedestrian
trampling compared to car drivers22.
The behavior of motorcycle courier drivers is due to pressure from customers and companies for faster deliveries; poor employment relation-ships, which involve the lack of formal contracts and traveling expenses compensation; low wages; stressful working hours; productivity pressure;
and the permanent risk of accidents22-25.
Truck drivers also face long working hours, low wages, rush to get to the destination, few sleep hours, poor quality of health and life and frequent risk of accidents. This makes them ex-tremely amenable to the use of amphetamines,
potent stimulants with very high risk for RTA26.
According to the National Department of Transportation Infrastructure, 331,652 traffic ac-cidents (TA) were registered on federal highways in 2011. Of these, 93,066 (28.1%) involved trucks. As a result, truck drivers ranked second among deaths and were those most affected by
morbidi-ty, especially temporary and total disability27.
Promotion and Prevention
Because of the relationships studied so far, one of the most important aspects of coping with traffic violence is promotion and preven-tion strategies.
In this context, the Conferences of Moscow (2009) and Brasília (2015) were significant
mile-stones. Pavarino Filho28 considers that both have
the same bases, and Brasília’s document is more specific and detailed, emphasizing risk and vul-nerability; morbimortality; equity and inclusion; goals and indicators; and capacity building and education.
Nardi et al.29 highlight the main
recommen-dations of the Brasilia Declaration: adoption of
legislation to ensure investment in safe infra-structure on highways and urban roads; speed-ing control; copspeed-ing with alcohol abuse; and care
of victims. It also recommends the prioritization
of sustainable means of transport (...) the safety of pedestrians, cyclists, motorcyclists and public
trans-port users.
Studying RTA-related mortality in young people aged 0 to 19 years in Brazil, Faria and
Braga30 consider that the measures adopted
pri-oritized motor vehicles, and it was necessary (...)
to reorganize traffic and urban areas to ensure the rights of the pedestrian-citizen and break with the practices that promote segregation and isolation of
communities. They also consider traffic education
as a fundamental tool to reduce morbimortality in the medium and long term, in a process that
leads children and adolescents to (...) reflect on
the ethical aspects of traffic behavior, to understand
the reasons for traffic rules (security for all people).
Attention and Care
When not avoided, RTA must receive emer-gency care that according to the papers in this category must be provided before the victim’s ar-rival at the hospital. According to Malvestio and
Cardoso de Sousa31, prehospital care in the first
minutes after the trauma, with resuscitation and stabilization measures, can prevent the
worsen-ing of the condition and influence the survival of
the victim, keeping it in a position to come alive
until hospital treatment is possible. The authors
highlight the role of the Pre-Hospital Mobile Care (APH), technology of initial care for trauma patients, with two modalities: Basic Life Support, which does not perform invasive procedures; and Advanced Life Support, which performs them.
Pointing out that 40% of deaths occur in the
prehospital phase of care, Ladeira and Barreto32,
affirm that the first hour (Golden hour) after the
occurrence of a traumatic injury is (...) the critical
time for the institution of treatment that will change
the prognosis. Thus, the pre-hospital care time is
shown by total time: response time (accident
oc-currence, calling the mobile unit, call reception, exit of the ambulance and arrival at the scene),
scene time (time spent at the scene), time of
trans-port (time between the scene and the hospital)32,33.
According to Pereira and Lima34, the reduced
M
or
eir
a MR
A study on the perception of traffic accident victims attending an emergency hospital in the
city of Fortaleza points out that hospitalization is
experienced with depression, anxiety, fear, sadness, concern, misinformation about the severity of the case, the prognosis, rights and duties linked to the traffic accident, of the legal, economic and social
implications35.
These issues are exacerbated by fears of a return to daily life since treatment requires out-patient follow-up, rehabilitation, drug therapy continuity and costs with traveling means, which hinders return to work and increases uncertain-ties and concerns. This shows that care provided to LTA victims extends until after the accident and should support the resumption of daily activities.
Morbimortality
In Brazil, in 1950, 19% of the passengers of vehicles were transported by bus and 6.5% by au-tomobiles; in the 1970s, these numbers increased to 66.3% and 22.2%, respectively. This change
di-rectly affected morbimortality by RTA36.
Laurenti et al.37 point out the significant
in-crease in the traffic mortality coefficient in the city of São Paulo between 1950 and 1970: from 12.2 to 22.4 deaths per 100,000 inhabitants.
Mello Jorge and Latorre38 show that, from
1978 to 1989, the annual deaths by RTA in the country increased from 17,795 to 27,611, peak-ing in 1986 with 29,574 deaths. They also found that these deaths were concentrated in young male adults.
Marín and Queiroz39 reinforce this
observa-tion: in 1997, 73.1% of RTA cases involved males, and young people being the primary victims.
Bacchieri and Barros22 discuss the
effective-ness of the Brazilian Traffic Code, in a study that covers the period from 1998 to 2010, stating that
(...) Strict laws, higher fines, and chapters
dedicat-ed to traffic dedicat-education suggestdedicat-ed that the problem would be solved. However, maintenance and, in some cases, increased mortality and hospitalization rates due to accidents prevailed.
Based on the 2013 National Health Survey,
Malta et al.40 pointed out that 4 out of 5 adults 18
years of age or older reported wearing a seat belt in the front seat; only half reported using belts in the back seat; the use of helmets was declared by about 80% of the respondents, in both drivers and passengers; and that the use of such equip-ment is less frequent in rural areas, in the North and Northeast, and among young people aged 18-29 years.
Farage et al.41 analyzed the effectiveness of
traffic safety measures in the Federal District be-tween 1992 and 1997. They found that, although there was an increase in the coefficients of vic-tims of traumatic brain injury by RTA, there was a reduction in cases of severe head trauma and the resulting deaths. They suggested that the safe-ty measures studied are effective in reducing the severity of accidents and the number of deaths but are not adequate to reduce the number of accidents.
Costs
Based on data from the SIH/SUS, Andrade
and Mello Jorge42 indicate that, in Brazil, in 2013,
the total expenditures of 170,805 RTA-related admissions exceeded R$ 230 million. They also point out that motorcyclists accounted for 51.9% of hospitalizations, which generated costs of R$
114,810,444.93. The same authors43 analyzed
the impacts of RTA through the social costs ex-pressed by Potential Years of Life Lost: in 2013, the 42,266 RTA-related deaths recorded in Brazil generated a loss of more than 1,300,000 Potential Years of Life Lost, with a mean proportion of 33.8 years lost/death.
These studies conclude the overview dis-cussed in this review, thus establishing the refer-ence that will analyze the mortality data shown below.
Mortality due to Traffic Accidents in Brazil: 1996 to 2015
Graph 1 shows the RTA mortality rate in Bra-zil between 1996 and 2015, contextualizing it in the general mortality rates and by external caus-es. While the overall mortality rate shows growth from 2008 onwards, the others indicate stability, and mortality by RTA declines in 2015, which, if confirmed in later years, indicates a downward trend.
e C
ole
tiv
a,
23(9):2785-2796,
2018
Graph 1. Brazil - General Mortality, Mortality due to External Causes and Land Transport Accident Mortality. 1996 to 2015.
Source: MS/SVS/CGIAE – Mortality Information System – SIM. 569,3 566,0 583,8 588,0
557,5 557,8 562,8 566,7 564,0 546,6 552,4 569,5 568,0 576,1
596,0 608,4 609,0 602,1 605,1 618,3
74,6 74,9 73,7 73,2 69,7 70,2 72,5 71,6 70,2 69,3 68,7 71,2 71,7 72,4 75,1 75,8 78,4 75,5 77,4 74,4
22,1 22,3 19,4 18,5 17,1 17,7 18,8 18,7 19,3 19,5 19,5 20,3 20,2 19,6 22,5 22,5 23,1 21,0 21,6 18,9
0,0 100,0 200,0 300,0 400,0 500,0 600,0 700,0
1 9 9 6 1 9 9 7 1 9 9 8 1 9 9 9 2 0 0 0 2 0 0 1 2 0 0 2 2 0 0 3 2 0 0 4 2 0 0 5 2 0 0 6 2 0 0 7 2 0 0 8 2 0 0 9 2 0 1 0 2 0 1 1 2 0 1 2 2 0 1 3 2 0 1 4 2 0 1 5
Tx. Mortalidade Geral/100.000 Tx. Mortalidade por Causas Externas/100.000 Tx. Mortalidade por ATT/100.000
General Mortality Rate/100,000 Land Transport Accident Rate/100,000 External Causes Mortality Rate/100,000
Graph 2. Brazil –Land Transport Accident (LTA) Mortality among Young people aged 10 to 29 years. 1996 to 2015 (n = 264,643).
Source: MS/SVS/CGIAE – Mortality Information System – SIM. 8,4
7,3
6,0 5,6 5,5 5,4 5,3 5,4 5,1 5,2 4,6 5,1 4,9 4,9 4,5 4,3 4,7 4,3 4,0 3,5
19,4 19,1
16,1 15,6
14,4 14,6 16,0 15,3 16,0 15,5 15,8
18,7 19,3 17,5
20,1 20,9 21,5 20,0 21,4
18,2 30,5 31,2
26,5 25,4
23,3 24,1
27,0 27,1 28,5 28,4 29,0
29,6 30,5 30,5
34,4
33,1 33,7
31,2 31,5 28,1 29,8 31,5
26,0
23,7 22,8 24,1 25,9 26,6
27,9 28,9 27,9 27,1 27,7 26,7
31,3 30,6 30,7
27,8 29,4
25,8
1996 1997 1998 1999 2000 2001 2002 2003 2004 2005 2006 2007 2008 2009 2010 2011 2012 2013 2014 2015 10 a 14 anos 15 a 19 anos 20 a 24 anos 25 a 29 anos
M
or
eir
a MR
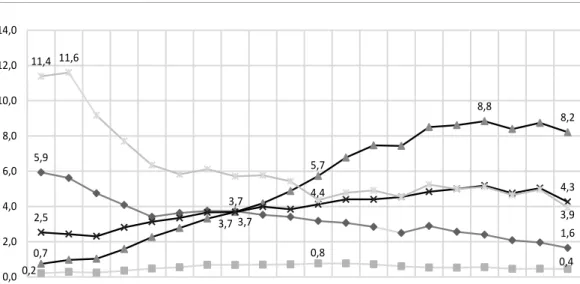
Graph 3 shows the five most recurrent victim types among the subjects studied in the paper for the period studied. We wish to explain that “Oth-er RTA” is a classification of ICD-10 that includes the items “V80-V89 Other road traffic accidents”, grouping the following victims: Animal-rider or occupant of animal-drawn vehicle (V80); Occu-pant of railway train or railway vehicle (V81); Occupant of streetcar (V82); Occupant of special vehicle mainly used on industrial premises (V83) Occupant of special vehicle mainly used in agri-culture (V84) Occupant of special construction vehicle (V85), Occupant of special all-terrain or other motor vehicle designed primarily for off-road use (V86); Traffic accident of specified type but victim’s mode of transport unknown (V87) Nontraffic accident of specified type but victim’s mode of transport unknown (V88); Motor- or nonmotor-vehicle accident, type of vehicle un-specified (V89).
Graph 3 illustrates a fundamental reality: motorcyclists, who in 1996 had a negligible mor-tality rate, became the main RTA victims in 2006. At the same time, there is a substantial re-duction in the Pedestrian mortality rate: while in 1996 this was the second most recurrent type of
victim, from 2004 onwards it became the fourth, with a consistent and considerable decline.
Also, the victims included in “Others RTA”, which start the period as the most recurrent, show a sharp decline until 2006, ending the pe-riod as the third most recurrent, well below its initial level.
Table 1 shows the traffic mortality according to the four main types of victims, organized by age group and gender, showing the inversely pro-portional relationship among the death risks in traffic by gender: the higher the female age group, the lower the risk; the higher the male age group, the higher the risk.
Thus, mortality by RTA falls predominantly on males. This relationship is even stronger when it focuses on motorcyclists who, since the age of 15, are already 85.5% of the victims, reaching 91% between 20 and 24 years.
Finishing this part, Graph 4, for the period studied, distributes deaths among the four main types of victims by skin color/race. It is noticed that, among adolescents and young people, pe-destrians and motorcyclists are mostly black and brown. Among car occupants and other RTA, most dead people are whites.
Graph 3. Brazil - LTA mortality among young people aged 10 to 29 years, according to the main types of victims. (n = 258,335).
Source: MS/SVS/CGIAE – Mortality Information System – SIM. 5,9
3,7
1,6
0,2
0,8
0,4 0,7
3,7
5,7
8,8
8,2
2,5
3,7
4,3 11,4 11,6
4,4
3,9
0,0 2,0 4,0 6,0 8,0 10,0 12,0 14,0
1996 1997 1998 1999 2000 2001 2002 2003 2004 2005 2006 2007 2008 2009 2010 2011 2012 2013 2014 2015
e C ole tiv a, 23(9):2785-2796, 2018 Discussion
Halving traffic deaths by 2020, as outlined in SDG 3.6, is a bold goal. In this context, Brazil emerges as a country in which this type of mortality has impacting rates that have remained stable in the last 20 years.
In the 20 years studied here, an average of about 39,000 people/year died by RTA, of which about 13,200 adolescents and young people. Aimed at SDG 3.6, the implemented public poli-cies should aim to reduce this mortality to some-thing around 19,500/year and, among adoles-cents and young people, to 6,500/year.
It is a sad fact that even the success of such policies, which is difficult to attain, would still keep mortality at a high level. Perhaps the most socially healthy action for Brazil would be to increase its reduction targets. However, at this moment, the paper focuses on the indication of subsidies to support policies that facilitate the SDG 3.6.
The first point to note is that the establish-ment of the CTB and more punitive legislation led to a decline in the mortality rate by RTA, especially between 1997 and 2000. However, the rate increased progressively in the following
decade22, indicating the limited capacity of this
legislation of producing results. We need to know the reasons.
Based on the discussion of several
au-thors19,28,29,41, a national evaluation of the
adher-ence of states and municipalities to comply with Prohibition, its implementation and execution, relating it to local morbimortality data, would indicate gaps, successful experiences and lines which would act as a valuation and improvement of the national legal framework.
The focus on adolescents and young people helps to understand the increased RTA mortality, by evidencing the change in the profile of traffic victims in the post-CTB and Prohibition peri-ods, showing that the primary victims in this age group were male, black and brown motorcyclists. Policies that focus on this audience are priorities.
Such policies must take into account the social relationships that involve this reality: ur-ban mobility patterns that privilege individual transportation; road network with conservation problems; social hierarchization of streets and
traffic10; traffic as an assertion of power and
gen-der bias14; labor market whose tele-delivery and
transportation sector employs black and brown young people with little schooling, but subject
them to death risks23-25; worker health and
corpo-T ab le 1. B razil. D ist rib u tio n o f d eaths d ue t o L T A a cc or ding t
o the T
yp e o f V ic tim, A ge G
roup and Ge
nd
er
. 1996 t
o 2015. Ty p e o f V ict im A ge G roup 10-14 y ear s 15-19 y ear s 20-24 y ear s 25-29 y ear s G en der M F T otal M F T otal M F T otal M F T otal N % N % N % N % N % N % N % N % N % N % N % N P ed est rian 5,000 69.0 2,248 31.0 7,248 100.0 7,762 73.2 2,847 26.8 10,609 100.0 10,735 81.4 2,451 18.6 13,186 100.0 11,372 83.3 2,280 16.7 13,652 M ot o rcy clist 807 66.8 401 33.2 1,208 100.0 14,960 85.5 2,532 14.5 17,492 100.0 26,843 90.4 2,849 9.6 29,692 100.0 20,973 91.0 2,081 9.0 23,054 C ar P asse ng er 1,725 56.7 1,315 43.3 3,040 100.0 8,732 72.3 3,342 27.7 12,074 100.0 16,107 80.7 3,860 19.3 19,967 100.0 14,785 81.6 3,331 18.4 18,116 Othe r L T A s 3,242 66.1 1,661 33.9 4,903 100.0 14,796 78.1 4,138 21.9 18,934 100.0 26,314 85.5 4,466 14.5 30,780 100.0 23,317 86.3 3,698 13.7 27,015 T otal 12,250 66.8 6,075 33.2 18,325 100.0 49,032 78.4 13,491 21.6 62,523 100.0 83,424 85.4 14,246 14.6 97,670 100.0 74,122 86.1 11,951 13.9 86,073 Sour ce: MS/SV
S/CGIAE - M
or talit y I nf or mat io n S yst
M
or
eir
a MR
rate/market accountability for prevention21; and
pre-hospital care to RTA victims31.
Thus, such policies must have intersectoral characteristics, articulating at least protective measures for transit workers; expansion and fo-cus of worker health programs for this audience; intense and constant preventive and educational actions about alcohol and drugs use while driv-ing; programs to fight against gender discrimina-tion; actions to regulate vehicle advertising that exalt aggressive driver behavior; a national road and highway quality policy; and mobilization of civil society for a change in the way people be-have in traffic.
It is interesting to note that, according to these recommendations, achieving SDG 3.6 is a process that involves articulation with policies that target other SDG, such as: 5.1 (end all forms
44,6% 49,0%
6,4%
37,9% 50,7%
44,8%
35,2%
20,0%
11,4%
Motorcyclist Car Passenger Other LTAs
Unknown and Other
Graph 4. Brazil - Proportional mortality by LTA, by Victim Type and Skin color/ethnicity. 1996 to 2015. Source: MS/SVS/CGIAE - Mortality Information System – SIM.
60,0%
50,0%
40,0%
30,0%
20,0%
10,0%
0,0%
White Black and Brown 46,8%
32,8%
20,4%
Pedestrian
of discrimination against all women and girls ev-erywhere); 8.3 (decent work); 8.5 (full employ-ment for young people); 11.2 (safe transport sys-tems and improved road safety); and 16.1 (sig-nificantly reduce all forms of violence and related death rates everywhere).
e C
ole
tiv
a,
23(9):2785-2796,
2018
Collaborations
MR Moreira: data collection, drafting, analysis and final review; JM Ribeiro: analysis and final review; CT Motta: data collection, drafting, anal-ysis; JIJ Motta: analysis.
References
1. Organização das Nações Unidas (ONU). Transforman-do Nosso MunTransforman-do: A Agenda 2030 para o Desenvolvimen-to Sustentável. Nova York: ONU; 2015. [acessado 2017 Nov 22]. Disponível em: https://nacoesunidas.org/wp-content/uploads/2015/10/agenda2030-pt-br.pdf 2. Brasil. DATASUS. Sistema de Informações de
Mortali-dade - SIM. [acessado 2017 Nov 23]. Disponível em: http://tabnet.datasus.gov.br/cgi/deftohtm.exe?sim/ cnv/ext10uf.def
3. Brasil. DATASUS. Sistema de Informação Hospitalar – SIH. [acessado 2017 Nov 23]. Disponível em: http:// www2.datasus.gov.br/DATASUS/index.php?are-a=0202&id=11633
4. Brasil. Lei n° 8.069, de 13 de julho de 1990. Dispõe so-bre o Estatuto da Criança e do Adolescente e dá outras providências. Diário Oficial da União 1990; 13 jul. 5. Brasil. Lei nº 12.852, de 5 de agosto de 2013. Institui
o Estatuto da Juventude e dispõe sobre os direitos dos jovens, os princípios e diretrizes das políticas públicas de juventude e o Sistema Nacional de Juventude - SI-NAJUVE. Diário Oficial da União 2013; 5 ago. 6. World Health Organization (WHO). Young People´s
Health - a Challenge for Society. Report of a WHO Study Group on Young People and Health for All.Technical Re-port Series 731. Geneva: WHO; 1986. [acessado 2017 Nov 23]. Disponível em: http://apps.who.int/iris/bits-tream/10665/41720/1/WHO_TRS_731.pdf
7. Brasil. DATASUS. Mortalidade geral – Notas Técni-cas. [acessado 2017 Nov 23]. Disponível em: http:// tabnet.datasus.gov.br/cgi/sim/Mortalidade_Ge-ral_1996_2012.pdf
8. Brasil. DATASUS. V01-V99 Acidentes de Transporte. [acessado 2017 Nov 23]. Disponível em: http://www. datasus.gov.br/cid10/V2008/WebHelp/v01_v99.htm 9. Rozestraten RJA. A Psicologia Social e o trânsito. Psicol.
cienc. Prof. 1986; 6(2):22-23.
10. Pitanga CV. Fé em Deus e pé na tábua: ou como e por que o trânsito enlouquece no Brasil. Horiz. antropol
2012; 18(37):399-402.
11. Hantower M. O trânsito expressa o uso do espaço ur-bano. Psicol. cienc. prof. 1986; 6(2):19-21.
12. Duarte EC, Garcia LP. Motoristas adolescentes no Bra-sil: prevalência e fatores associados estimados a par-tir da Pesquisa Nacional de Saúde do Escolar (PeNSE 2012). Rev. bras. epidemiol 2014; 17(Supl. 1):3-16. 13. Sauer MTN, Wagner MB. Acidentes de trânsito fatais
e sua associação com a taxa de mortalidade infantil e adolescência. Cad Saude Publica 2003; 19(5):1519-1526.
14. Almeida NDV, Lima AKB, Albuquerque CM, Antunes L. As relações de gênero e as percepções dos/das mo-toristas no âmbito do sistema de trânsito. Psicol. cienc. prof. 2005; 25(2):172-185.
15. Saldanha RF, Pechansky F, Benzano D, Barros CASM, Boni RBD. Differences between attendance in emer-gency care of male and female victims of traffic acci-dents in Porto alegre, Rio Grande do Sul state, Brazil.
Cien Saude Colet 2014; 19(9):3925-3930.
16. Ponce JC, Leyton V. Drogas ilícitas e trânsito: proble-ma pouco discutido no Brasil. Rev. psiquiatr. clín. 2008; 35(Supl. 1):65-69.
17. Hoffmann MH, Carbonelli E, Montoro L. Álcool e segurança no trânsito (II):a infração e sua prevenção.
M
or
eir
a MR
18. Cruz CC, Sarcinelli PN, Silva JJO, Meyer TSM, Bochner R, Alves SR. Causas externas relacionadas à alcoolemia registradas pelo Instituto Médico Legal no município do Rio de Janeiro. Cad. saúde colet. 2014; 22 (1):8-15. 19. Damacena GN, Malta DC, Boccolini CS, Souza JPRB,
Almeida WS, Ribeiro LS Szwarcwald CL. Consumo abusivo de álcool e envolvimento em acidentes de trân-sito na população brasileira, 2013. Cien Saude Colet
2016; 21(12):3777-3786.
20. Nascimento AS, Garcia MLT. Álcool e direção: uma questão na agenda política brasileira. Psicol. Soc. 2009; 21(2):213-222.
21. Ferreira RR, Mendes R. Alguns aspectos epidemiológi-cos dos acidentes de trabalho fatais ocorridos em Cam-pinas, SP (Brasil), 1972-1978. Rev Saude Publica 1981; 15(3):251-262.
22. Bacchieri G, Barros AJD. Acidentes de trânsito no Brasil de 1998 a 2010: muitas mudanças e poucos resultados.
Rev Saude Publica 2011; 45(5):949-963.
23. Soares DFPP, Mathias TAF, Silva DW, Andrade SM. Motociclistas de entrega: algumas características dos acidentes de trânsito na região sul do Brasil. Rev. bras. epidemiol 2011; 14(3):435-444.
24. Veronese AM, Oliveira DLLC. Os riscos dos acidentes de trânsito na perspectiva dos moto-boys: subsídios para a promoção da saúde. Cad Saude Publica 2006; 22(12):2717-2721.
25. Diniz EPH, Assunção AA, Lima FPA. Prevenção de acidentes: o reconhecimento das estratégias operató-rias dos motociclistas profissionais como base para a negociação de acordo coletivo. Cien Saude Colet 2005; 10(4):905-916.
26. Takitane J, Oliveira LG, Endo LG, Oliveira KCBG, Muñoz DR, Yonamine M, Leyton V. Uso de anfetami-nas por motoristas de caminhão em rodovias do Esta-do de São Paulo: um risco à ocorrência de acidentes de trânsito? Cien Saude Colet 2013; 18(5):1247-1254. 27. Oliveira LG, Almeida CVD, Barroso LP, Gouvea MJC,
Muñoz DR, Leyton V. Acidentes de trânsito de motoris-tas de caminhões no estado de São Paulo: prevalência e preditores. Cien Saude Colet 2016; 21(12):3757-3767. 28. Pavarino Filho RV. As declarações de Moscou e Bra-sília sobre segurança rodoviária - um paralelo entre dois momentos de saúde. Cien Saude Colet 2016; 21 (12):3649-3660.
29. Nardi ACF, Malta DC, Duarte E, Garcia LP. Segurança no trânsito: tempo de resultados. Epidemiol. Serv. Saú-de 2015; 24(4):593-594.
30. Faria EO, Braga MGC. Propostas para minimizar os riscos de acidentes de trânsito envolvendo crianças e adolescentes. Cien Saude Colet 1999; 4(1):95-107. 31. Malvestio MAA, Sousa RMC. Sobrevivência após
aci-dentes de trânsito: impacto das variáveis clínicas e pré -hospitalares. Rev Saude Publica 2008; 42(4):639-647. 32. Ladeira RM, Barreto SM. Fatores associados ao uso de
serviço de atenção pré-hospitalar por vítimas de aci-dentes de trânsito. Cad Saude Publica 2008; 24(2):287-294.
33. Malvestio MAA, Sousa RMC. Suporte avançado à vida: atendimento a vítimas de acidentes de trânsito. Rev Saude Publica 2002; 36(5):584-589.
34. Pereira WAP, Lima MADS. O trabalho em equipe no atendimento pré-hospitalar à vítima de acidente de trânsito. Rev. esc. enferm. USP 2009; 43(2):320-327. 35. Sousa Filho OA, Xavier EP, Vieira LJES. Hospitalização
na óptica do acidentado de trânsito e de seu familiar-a-companhante. Rev. esc. enferm. USP 2008; 42(3):539-546.
36. Klein CH. Mortes no trânsito do Rio de Janeiro, Brasil.
Cad Saude Publica 1994; 10(Supl. 1):168-176. 37. Laurenti R, Guerra MAT, Baseotto RA, Klincervicius
MT. Alguns aspectos epidemiológicos da mortalidade por acidentes de trânsito de veículo a motor na Cidade de São Paulo, Brasil. Rev Saude Publica 1972; 6(4):329-341.
38. Mello Jorge MHP, Latorre MRDO. Acidentes de trân-sito no Brasil: dados e tendências. Cad Saude Publica
1994; 10 (Supl. 1):19-44.
39. Marín L, Queiroz MS. A atualidade dos acidentes de trânsito na era da velocidade: uma visão geral. Cad Saude Publica 2000; 16(1):7-21.
40. Malta DC, Mascarenhas MDM, Bernal RTI, Silva MMA, Pereira CA, Minayo MCS, Morais Neto OL. Análise das ocorrências das lesões no trânsito e fatores relacionados segundo resultados da Pesquisa Nacional por Amostra de Domicílios (PNAD) Brasil, 2008. Cien Saude Colet 2011; 16(9):3679-3687.
41. Farage L, Colares VS, Capp Neto M, Moraes MC, Bar-bosa MC, Branco Júnior JA. As medidas de segurança no trânsito e a morbimortalidade intra-hospitalar por traumatismo craniencefálico no Distrito Federal. Rev. Assoc. Med. Bras. 2002; 48(2):163-166.
42. Andrade SSCA, Mello Jorge MHP. Internações hospi-talares por lesões decorrentes de acidente de transporte terrestre no Brasil, 2013: permanência e gastos. Epide-miol. Serv. Saúde 2017; 26(1):31-38.
43. Andrade SSCA, Mello-Jorge MHP. Mortalidade e anos potenciais de vida perdidos por acidentes de transporte no Brasil, 2013. Rev Saude Publica 2016; 50:59.
Article submitted 31/10/2017 Approved 26/02/2018
Final version submitted 19/06/2018
This is an Open Access article distributed under the terms of the Creative Commons Attribution License