AR
TICLE
Eating patterns and nutrient intake for older people:
analysis with different methodological approaches
Abstract This study aims to analyse the eating patterns and nutrient intake in different eating patterns of elderly persons. This is a cross-sec-tional study with elderly people from Botucatu, São Paulo state, Brazil. The mean daily nutrient intake of individuals with high adherence to the eating patterns identified by factor analysis was analysed, comparing the intake by analysis of variance. Individuals with high adherence to the Healthy eating pattern had the highest mean in-take of retinol, vitamin A and vitamin E. Indi-viduals with high adherence to the eating pattern Snacks and weekend meal presented lower means of vitamin B12, vitamin C, phosphorus, and ret-inol intake and the highest means of iron, man-ganese and magnesium intake. Individuals with high adherence to Fruits had the lowest mean fibre intake. Individuals with high adherence to Light and whole foods had the highest means of vitamin C intake. Individuals with high adherence to Soft diet showed lower protein intake and increased added sugar intake. Individuals with high adher-ence to the Traditional eating pattern presented high means of nutrient intake. In general, a better characterization of the eating behaviour of elderly people who adhere to each of these eating patterns was possible.
Key words Eating patterns, Micronutrients, Macronutrients, Food, Elderly
Patrícia Moraes Ferreira-Nunes 1
Silvia Justina Papini 2
José Eduardo Corrente 3
1Faculdade Brasileira
- Multivix. R. José Alves 135, Goiaberas. 29075-080 Vitória ES Brasil. patriciaferreira.nut@ gmail.com
2 Departamento de
Enfermagem, Faculdade de Medicina de Botucatu, Universidade Estadual Paulista (Unesp). Botucatu SP Brasil.
3 Departamento de
Fe
rr
eir
a-N
unes PM
Introduction
With ageing, changes in nutritional status become more frequent due to factors that limit food con-sumption and nutrient utilization. These include physiological and oral cavity changes, economic and psychosocial factors, restriction of mobility
and institutionalization1. In addition to these
fac-tors, the nutritional transition due to changes in eating patterns and a sedentary lifestyle has been shown to have a major impact on the health and
nutritional status of the elderly2.
In nutritional epidemiology, eating patterns are identified through statistical techniques of the reduction and/or aggregation of compo-nents. Pattern identification methods, such as ex-ploratory methods, are based on empirical food data, which are aggregated on the basis of
statisti-cal analysis, with subsequent evaluation3.
Princi-pal component analysis (PCA) is one of the most commonly used statistical methods to
empirical-ly derive eating patterns3. The patterns derived
from the exploratory method do not necessarily
represent patterns of ideal diets4,5. However, the
specificity of this method offers the advantage of reflecting the real behaviour of a population group, providing useful information for the
elab-oration of nutritional guidelines6. Eating
pat-terns may be a consequence of cultural, ethnic, and many environmental factors, including food availability, food purchasing and preparation,
and numerous product advertisements5.
From a public health perspective, researchers stress the importance of evaluating food con-sumption through the use of various approaches
to nutrient, food and food group analysis5,7.
How-ever, there is a shortage of studies in the literature that evaluate the diet using both approaches.
Of-ten, either eating patterns8-11 or specific dietary
components are analysed12-16.
To date, few studies have used statistical methods to empirically identify eating patterns
in elderly groups17-19. In Brazil, a statistical
anal-ysis of the eating patterns and their components in the elderly population has not yet been pub-lished.
To increase the knowledge regarding the eating behaviour of the elderly, a group vulner-able to changes in nutritional status, this study proposes an unprecedented way to analyse eat-ing patterns and nutrient intake by two different methodological approaches.
Methods
This is a cross-sectional epidemiological study, with a sample of 172 individuals aged 60 years or older residing in an urban area and enrolled in the basic health network of the city of Botucatu, SP, Brazil. Data from 172 individuals were ran-domly selected by stratified sampling among the 16 basic health units (BHUs) and family health strategies (FHS) in the city. Data were collected from March to June 2011, and participants an-swered a validated quantitative food frequency questionnaire (FFQ) for this population, which
contained 71 food items20.
The 172 individuals were a subsample of a sample of 355 individuals enrolled in prima-ry care. This subsample is representative of the larger sample with regard to sociodemographic aspects, as demonstrated by the proportionality of the data of this study and those presented in
Ferreira et al.21. Thus, it is possible that this
sub-sample represents the population enrolled in the basic health network, considering the similarity in the sociodemographic profiles.
This study was approved by the Research Ethics Committee of the School of Medicine of Botucatu/Sao Paulo State University (UNESP) through protocol number 3560/2010.
The identification of eating patterns was
per-formed in a previous study21 using an
explorato-ry factor analysis technique (PCA) with varimax rotation for food items. Individual consumption scores were calculated and divided into tertiles: low adherence, moderate adherence and high
ad-herence to the eating pattern analysed21.
For nutrient consumption calculation, the food composition data provided by the study “Inquérito de Saúde do Município de São Paulo (Health Survey of the Municipality of Sao Pau-lo; ISA- Capital)” of the University of São Paulo (USP) were used. All FFQ data were converted to nutrient intake using information on the portion size proportional to 100 grams of each nutrient, and these data were represented as the mean and standard deviation (SD). The following nutrients were evaluated: carbohydrate, protein, total fat, saturated fat, total fibre, added sugar, alcohol, vitamin D, vitamin C, retinol, vitamin A, folate, vitamin E, vitamin B12, calcium, phosphorus, magnesium, iron, sodium, potassium, selenium, copper, and manganese.
e C
ole
tiv
a,
23(12):4085-4094,
2018
fat (in grams) + (7 kcal x alcohol (in grams)). Comparisons of nutrient intake means, ac-cording to sex, were made regarding the high ad-herence to each of the patterns (identified as the highest tertile of adherence scores to each pattern identified in a previous study) using analysis of variance (ANOVA), followed by the energy-ad-justed Tukey multiple comparison test (TEV) in cases of symmetrically distributed data. When the distribution was asymmetric, a generalized linear model with a gamma distribution was used, followed by the multiple Wald comparison, which was also adjusted by energy (TEV).
All analyses were performed using the SAS program, version 9.3. The level of significance was 5%.
Results and discussion
The sample consisted of 172 individuals aged sixty years or older, of whom 80 (46.51%) were male and 92 were female. The age ranged from 60 to 92 years, the mean age was 69.51 years (stand-ard deviation = 7.90 years). This population lived
with a mean per capita family income of 1.89
minimum wages. The majority of the individuals were white (86.55%) and had studied up to ele-mentary school (40.12%).
The 6 eating patterns identified in the factor
analysis21 and that consistently reproduced the
different eating characteristics of the elderly in the city of Botucatu were:
1. Healthy: Raw vegetables, vegetables, broc-coli/cauliflower/cabbage, cooked vegetables, car-rot, extra virgin olive oil, tomato, lettuce, fish, oats.
2. Snacks and weekend meal: Sausages, yel-low cheeses, pizza/pancake, baked snacks, ba-con/jerky beef, burger/nuggets/meatballs, fried snacks, butter, soda, French bread, pasta with meat, mayonnaise salad, desserts/sweets, potato/ fried cassava.
3. Fruits: Avocado, guava, papaya, apple/pear, melon/watermelon, orange/bergamot/pineapple, banana.
4. Light and whole foods: Skimmed/semi-skimmed milk, whole wheat bread, natural juice without sugar, oats, extra virgin olive oil.
5. Soft diet: Baked potato/cassava, soup, French bread, whole milk, carrot, cooked corn meal.
6. Traditional: White rice, bean, lettuce, to-mato.
A previous study presented the distribution of adherence to these eating patterns according to
sociodemographic characteristics21. However,
al-though the identification of these global patterns translates, in practical terms, the main foods that characterize the diet of these groups, it is not an evaluation method that can be used to describe the composition of nutrients in each eating pat-tern. For a complete evaluation of dietary intake, the present study proposes to quantitatively ana-lyse the nutrients consumed by individuals with high adherence to each of the identified patterns, thereby expanding the understanding of the pos-sible nutritional advantages or risks for the el-derly when adhering to each of these patterns, as shown in Tables 1 and 2.
The means and pattern deviations of the in-take of macro and micronutrients, respectively, of men and women with high adherence to each of the eating patterns are presented in Tables 1 and 2.
As shown in Tables 1 and 2, the high
adher-ence to the Healthy pattern differed significantly
from all other patterns because of the higher con-sumption of retinol in both sexes and vitamin A in males. In females, this pattern also presented the highest mean of vitamin A, not differing
sig-nificantly from the Fruits and Light and whole
foods patterns.
The high adherence to the Healthy pattern
was also characterized by a greater intake of sev-eral nutrients. In this pattern, higher means were observed in both sexes for magnesium, iron, copper and manganese; in men, higher means of vitamin E, protein and selenium were observed, and in women the highest means were observed for vitamin B12.
Some of these results are expected because elements such as magnesium, iron, copper, man-ganese, vitamin E, vitamin A, protein and seleni-um are present in the foods that characterize the Healthy pattern.
For example, protein is present in both an-imal foods, such as fish, and foods of plant ori-gin. Vitamin E and the aforementioned minerals are abundant in foods of plant origin. However, the higher means of retinol and vitamin B12 in-take by individuals with high adherence to this pattern allow us to infer that it can supply larger amounts of important nutrients, such as those that are exclusive to foods of animal origin.
Considering that 10 to 30% of the elderly population may have impaired absorption of
vitamin B1222 due to intrinsic factor deficiency,
medi-Fe
rr
eir
a-N
unes PM
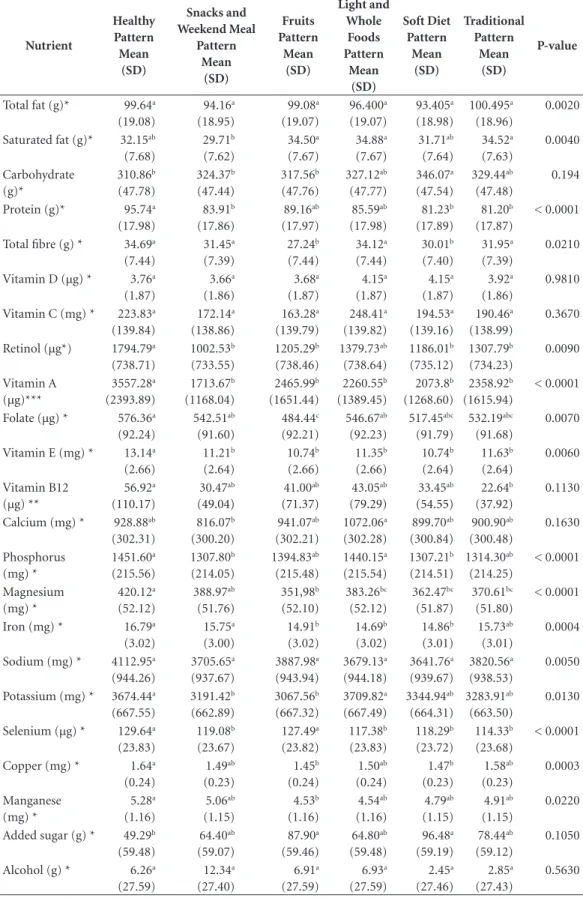
Table 1. Means and standard deviations of nutrients in elderly men with high adherence to eating patterns.
Botucatu (SP), Brazil, 2011.
Nutrient Healthy Pattern Mean (SD) Snacks and Weekend Meal Pattern Mean (SD) Fruits Pattern Mean (SD) Light and Whole Foods Pattern Mean (SD) Soft Diet Pattern Mean (SD) Traditional Pattern Mean (SD) P-value
Total fat (g)* 99.64a
(19.08) 94.16a (18.95) 99.08a (19.07) 96.400a (19.07) 93.405a (18.98) 100.495a (18.96) 0.0020
Saturated fat (g)* 32.15ab
(7.68) 29.71b (7.62) 34.50a (7.67) 34.88a (7.67) 31.71ab (7.64) 34.52a (7.63) 0.0040 Carbohydrate (g)* 310.86b (47.78) 324.37b (47.44) 317.56b (47.76) 327.12ab (47.77) 346.07a (47.54) 329.44ab (47.48) 0.194
Protein (g)* 95.74a
(17.98) 83.91b (17.86) 89.16ab (17.97) 85.59ab (17.98) 81.23b (17.89) 81.20b (17.87) < 0.0001
Total fibre (g) * 34.69a
(7.44) 31.45a (7.39) 27.24b (7.44) 34.12a (7.44) 30.01b (7.40) 31.95a (7.39) 0.0210
Vitamin D (µg) * 3.76a
(1.87) 3.66a (1.86) 3.68a (1.87) 4.15a (1.87) 4.15a (1.87) 3.92a (1.86) 0.9810
Vitamin C (mg) * 223.83a
(139.84) 172.14a (138.86) 163.28a (139.79) 248.41a (139.82) 194.53a (139.16) 190.46a (138.99) 0.3670
Retinol (µg*) 1794.79a
(738.71) 1002.53b (733.55) 1205.29b (738.46) 1379.73ab (738.64) 1186.01b (735.12) 1307.79b (734.23) 0.0090 Vitamin A (µg)*** 3557.28a (2393.89) 1713.67b (1168.04) 2465.99b (1651.44) 2260.55b (1389.45) 2073.8b (1268.60) 2358.92b (1615.94) < 0.0001
Folate (µg) * 576.36a
(92.24) 542.51ab (91.60) 484.44c (92.21) 546.67ab (92.23) 517.45abc (91.79) 532.19abc (91.68) 0.0070
Vitamin E (mg) * 13.14a
(2.66) 11.21b (2.64) 10.74b (2.66) 11.35b (2.66) 10.74b (2.64) 11.63b (2.64) 0.0060 Vitamin B12 (µg) ** 56.92a (110.17) 30.47ab (49.04) 41.00ab (71.37) 43.05ab (79.29) 33.45ab (54.55) 22.64b (37.92) 0.1130
Calcium (mg) * 928.88ab
(302.31) 816.07b (300.20) 941.07ab (302.21) 1072.06a (302.28) 899.70ab (300.84) 900.90ab (300.48) 0.1630 Phosphorus (mg) * 1451.60a (215.56) 1307.80b (214.05) 1394.83ab (215.48) 1440.15a (215.54) 1307.21b (214.51) 1314.30ab (214.25) < 0.0001 Magnesium (mg) * 420.12a (52.12) 388.97ab (51.76) 351,98b (52.10) 383.26bc (52.12) 362.47bc (51.87) 370.61bc (51.80) < 0.0001
Iron (mg) * 16.79a
(3.02) 15.75a (3.00) 14.91b (3.02) 14.69b (3.02) 14.86b (3.01) 15.73ab (3.01) 0.0004
Sodium (mg) * 4112.95a
(944.26) 3705.65a (937.67) 3887.98a (943.94) 3679.13a (944.18) 3641.76a (939.67) 3820.56a (938.53) 0.0050
Potassium (mg) * 3674.44a
(667.55) 3191.42b (662.89) 3067.56b (667.32) 3709.82a (667.49) 3344.94ab (664.31) 3283.91ab (663.50) 0.0130
Selenium (µg) * 129.64a
(23.83) 119.08b (23.67) 127.49a (23.82) 117.38b (23.83) 118.29b (23.72) 114.33b (23.68) < 0.0001
Copper (mg) * 1.64a
(0.24) 1.49ab (0.23) 1.45b (0.24) 1.50ab (0.24) 1.47b (0.23) 1.58ab (0.23) 0.0003 Manganese (mg) * 5.28a (1.16) 5.06ab (1.15) 4.53b (1.16) 4.54ab (1.16) 4.79ab (1.15) 4.91ab (1.15) 0.0220
Added sugar (g) * 49.29b
(59.48) 64.40ab (59.07) 87.90a (59.46) 64.80ab (59.48) 96.48a (59.19) 78.44ab (59.12) 0.1050
Alcohol (g) * 6.26a
(27.59) 12.34a (27.40) 6.91a (27.59) 6.93a (27.59) 2.45a (27.46) 2.85a (27.43) 0.5630
e C ole tiv a, 23(12):4085-4094, 2018
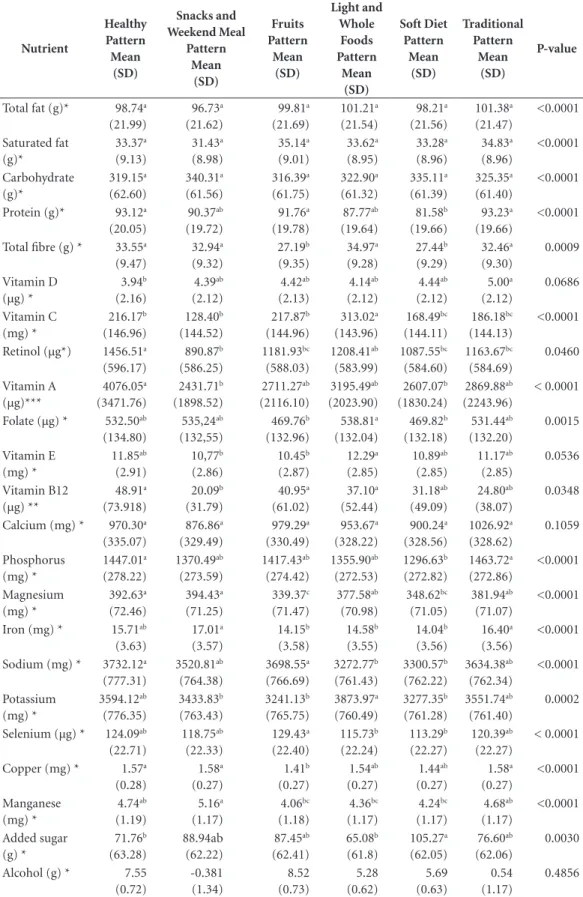
Table 2. Means and standard deviation of nutrients in elderly women with high adherence to dietary patterns.
Botucatu (SP), Brazil, 2011.
Nutrient Healthy Pattern Mean (SD) Snacks and Weekend Meal Pattern Mean (SD) Fruits Pattern Mean (SD) Light and Whole Foods Pattern Mean (SD) Soft Diet Pattern Mean (SD) Traditional Pattern Mean (SD) P-value
Total fat (g)* 98.74a
(21.99) 96.73a (21.62) 99.81a (21.69) 101.21a (21.54) 98.21a (21.56) 101.38a (21.47) <0.0001 Saturated fat (g)* 33.37a (9.13) 31.43a (8.98) 35.14a (9.01) 33.62a (8.95) 33.28a (8.96) 34.83a (8.96) <0.0001 Carbohydrate (g)* 319.15a (62.60) 340.31a (61.56) 316.39a (61.75) 322.90a (61.32) 335.11a (61.39) 325.35a (61.40) <0.0001
Protein (g)* 93.12a
(20.05) 90.37ab (19.72) 91.76a (19.78) 87.77ab (19.64) 81.58b (19.66) 93.23a (19.66) <0.0001
Total fibre (g) * 33.55a
(9.47) 32.94a (9.32) 27.19b (9.35) 34.97a (9.28) 27.44b (9.29) 32.46a (9.30) 0.0009 Vitamin D (µg) * 3.94b (2.16) 4.39ab (2.12) 4.42ab (2.13) 4.14ab (2.12) 4.44ab (2.12) 5.00a (2.12) 0.0686 Vitamin C (mg) * 216.17b (146.96) 128.40b (144.52) 217.87b (144.96) 313.02a (143.96) 168.49bc (144.11) 186.18bc (144.13) <0.0001
Retinol (µg*) 1456.51a
(596.17) 890.87b (586.25) 1181.93bc (588.03) 1208.41ab (583.99) 1087.55bc (584.60) 1163.67bc (584.69) 0.0460 Vitamin A (µg)*** 4076.05a (3471.76) 2431.71b (1898.52) 2711.27ab (2116.10) 3195.49ab (2023.90) 2607.07b (1830.24) 2869.88ab (2243.96) < 0.0001
Folate (µg) * 532.50ab
(134.80) 535,24ab (132,55) 469.76b (132.96) 538.81a (132.04) 469.82b (132.18) 531.44ab (132.20) 0.0015 Vitamin E (mg) * 11.85ab (2.91) 10,77b (2.86) 10.45b (2.87) 12.29a (2.85) 10.89ab (2.85) 11.17ab (2.85) 0.0536 Vitamin B12 (µg) ** 48.91a (73.918) 20.09b (31.79) 40.95a (61.02) 37.10a (52.44) 31.18ab (49.09) 24.80ab (38.07) 0.0348
Calcium (mg) * 970.30a
(335.07) 876.86a (329.49) 979.29a (330.49) 953.67a (328.22) 900.24a (328.56) 1026.92a (328.62) 0.1059 Phosphorus (mg) * 1447.01a (278.22) 1370.49ab (273.59) 1417.43ab (274.42) 1355.90ab (272.53) 1296.63b (272.82) 1463.72a (272.86) <0.0001 Magnesium (mg) * 392.63a (72.46) 394.43a (71.25) 339.37c (71.47) 377.58ab (70.98) 348.62bc (71.05) 381.94ab (71.07) <0.0001
Iron (mg) * 15.71ab
(3.63) 17.01a (3.57) 14.15b (3.58) 14.58b (3.55) 14.04b (3.56) 16.40a (3.56) <0.0001
Sodium (mg) * 3732.12a
(777.31) 3520.81ab (764.38) 3698.55a (766.69) 3272.77b (761.43) 3300.57b (762.22) 3634.38ab (762.34) <0.0001 Potassium (mg) * 3594.12ab (776.35) 3433.83b (763.43) 3241.13b (765.75) 3873.97a (760.49) 3277.35b (761.28) 3551.74ab (761.40) 0.0002
Selenium (µg) * 124.09ab
(22.71) 118.75ab (22.33) 129.43a (22.40) 115.73b (22.24) 113.29b (22.27) 120.39ab (22.27) < 0.0001
Copper (mg) * 1.57a
(0.28) 1.58a (0.27) 1.41b (0.27) 1.54ab (0.27) 1.44ab (0.27) 1.58a (0.27) <0.0001 Manganese (mg) * 4.74ab (1.19) 5.16a (1.17) 4.06bc (1.18) 4.36bc (1.17) 4.24bc (1.17) 4.68ab (1.17) <0.0001 Added sugar (g) * 71.76b (63.28) 88.94ab (62.22) 87.45ab (62.41) 65.08b (61.8) 105.27a (62.05) 76.60ab (62.06) 0.0030
Alcohol (g) * 7.55 (0.72) -0.381 (1.34) 8.52 (0.73) 5.28 (0.62) 5.69 (0.63) 0.54 (1.17) 0.4856
Fe
rr
eir
a-N
unes PM
cation (especially antibiotics, which destroy the
intestinal flora)23, adherence to the Healthy
pat-tern can contribute to a greater amount of this nutrient.
Fisberg et al., when assessing the prevalence of inadequate nutrient intake in the Brazilian elderly population, found a high prevalence of inadequacy in vitamin A intake, with percentages
between 68% in women and 83% in men16.
Considering the key role of vitamin A in the visual cycle, promotion of growth, epithelial cel-lular differentiation and maintenance, immune
system activity and reproduction24, in addition to
the low consumption of vitamin A-rich foods by
the Brazilian elderly population16,25, stimulating
adherence to the Healthy pattern becomes
stra-tegic.
The development of guidelines and govern-ment programmes that encourage the consump-tion of fish, vegetables, oats and extra virgin olive oil, foods typical of this eating pattern, may be a good strategy for the prevention of vitamin A and vitamin B12 deficiencies, as well as ensuring intake of other micronutrients present in these foods.
As shown in Tables 1 and 2, a high adherence
to the standard Snacks and weekend meal when
compared to the Healthy and Light and whole
foods patterns is characterized by lower means of vitamin C and vitamin B12 (in women) and phosphorus and retinol (in men).
This result demonstrates that even though
the pattern Snacks and weekend meal contains
foods of animal origin, it may not be a good source of important nutrients such as vitamin B12 and retinol.
On the other hand, the reduced means of
vi-tamin C in high adherence to the pattern Snacks
and weekend meal is an expected result because there is no source food of this vitamin found in this eating pattern.
The highest means of nutrients, such as iron (in both sexes) and magnesium and manganese (in females), in a high adherence to the pattern Snacks and weekend meal compared to a high
ad-herence to the Fruits, Light and whole foods and
Soft diet patterns are notable because this was only possible due to the isolated analysis of nu-trients. This result may have occurred due to the consumption of meat and meat products and the presence of foods such as cereals and pasta that characterize this pattern.
The fortification of wheat and corn flours with iron and folic acid is mandatory and was established by Resolution RDC No. 344 of
De-cember 13, 200226. Although the supplemented
amount of iron in 100 grams of flour was not el-evated, this supplementation may also contribute to the higher levels of iron in a high adherence to
the pattern Snacks and weekend meal.
Data from the Pesquisa de Orçamentos Fa-miliares (Family Budget Survey; POF 2008-2009) show results similar to those found in this study, demonstrating that the mean intake of vitamin C was lower in groups of people who consume soda, pizza, stuffed biscuits and processed meats when compared to the average vitamin C intake
of the population27.
The data from POF (2008-2009) also indicat-ed a higher mean folate intake in groups of peo-ple who consumed pizza and salty bread when compared to the mean folate intake of the popu-lation, correlating this finding with the probable
fortification of flour with folate27.
Men with a high adherence to the pattern Snacks and weekend meal consumed significantly lower amounts of saturated fat when compared
to those with a high adherence to Fruit, Light and
whole foods and Traditional patterns.
This result was not expected because this pattern is represented by several fatty foods such as sausage, yellow cheese, pizza/pancake, baked snack, bacon, hamburger, and butter, among oth-ers. There may have been an underestimation of the portion sizes of these foods.
It is known that in food consumption assess-ment studies, several factors may interfere with the quality of information, including gender, age, education level, the individual being concerned with social approval, and the patient’s own
per-ception about healthy food28,29.
Researchers recognize that sub-reporting re-mains a problem and may be associated with
un-derestimation of portion size30-32. Tucker31 notes
that it is important to understand these sources of potential bias because they may lead to false conclusions about the observed associations.
Contrary to expectations, the method of analysis used in this study did not identify a higher intake of nutrients that are markers of an unhealthy diet, such as saturated fat and added sugar, by individuals with a high adherence to
the pattern Snacks and weekend meal. However,
the method proved to be effective in signalling lower means of vitamins and minerals in the high adherence to this pattern when compared to the other patterns.
As shown in Tables 1 and 2, a high adherence
to the Fruits pattern was shown to have the lowest
signif-e C
ole
tiv
a,
23(12):4085-4094,
2018
icantly from most of the patterns (it did not
sig-nificantly differ only from the pattern Softdiet).
Higher means of sodium and selenium were also observed in a high adherence to the pattern Fruits compared to a high adherence to the Light and whole foods and Soft diet patterns, as well as lower means of magnesium, folate, copper, and manganese when compared to a high adherence to the Healthy and Snack and weekendmeal patterns.
In males, the mean saturated fat intake was
higher in a high adherence to the Fruit pattern
than in a high adherence to the Snacks and
week-end meal pattern.
The isolated analyses of the nutrients for the Fruit pattern present unexpected results.
In the present study, it can be inferred that, inherent to this eating behaviour described by the preference for fruits, there is also the con-sumption of other types of food that can be fatty and caloric.
The high frequency of fruit consumption could also indicate a compensatory behaviour. It is known that individuals who recognize positive and negative effects of food may overestimate or underestimate the consumption of certain foods, so that the individual’s responses do not reflect the actual consumption information.
One reason for the smaller fibre means in the high adherence to this pattern when compared to the others may be that these individuals may have reported a high frequency of fruit consumption, but in smaller amounts than expected.
When analysing the portions of fruits con-sumed (considering a 70 kcal portion of the food
pyramid, proposed by Philippi et al.33), it was
found that individuals of both sexes with high
adherence to the Fruit pattern consumed an
av-erage of only 2.62 (SD = 2.56) and a median of 2.06 servings of fruits per day. On the other hand,
individuals with a high adherence to the Healthy,
Soft diet, Snacks and weekend meal, Traditional and Light and whole foods patterns consumed, re-spectively, means of 2.74 (SD = 1.87), 2.99 (SD = 2.64), 3.08 (SD = 3.11), 3.27 (SD = 2.21) and 5.12 (SD = 2.83) servings of fruit per day.
Although the average number of portions
consumed in a high adherence to the Fruits
pat-tern was lower than the other patpat-terns, it differed
significantly only in relation to the Light and whole
foods pattern (p = 0.012, by the Kruskal-Wallis test). In the total sample, the mean intake of fruit portions was 2.85 (SD = 2.41), and the median was 2.46 servings per day.
Importantly, when identifying the eating patterns by principal component analysis, the
frequency of food intake was considered, not the evaluation of the amount of food consumed.
Other studies have highlighted the insuffi-cient consumption of fruits and vegetables by the
Brazilian elderly population16,34-37.
Fisberg et al. observed that the consumption of fruits and vegetables by the Brazilian elderly population was approximately one-third of the amount recommended by the Food Guide for the
Brazilian Population ( ≥ 400 g/day)16.
As shown in Tables 1 and 2, a high adherence
to the Light and whole foods pattern in females
in comparison to a high adherence to all other patterns is characterized by higher mean values of vitamin C. Additionally, the high adherence to this pattern is characterized by higher means of retinol and vitamin B12.
A high adherence to the Soft diet pattern
pre-sents lower means of protein and fibre and high-er means of added sugar when compared to the other patterns. These results are expected for a pattern of these types of foods.
The high adherence to the Soft diet pattern is
more prevalent in the female sex and in the el-derly, and these characteristics are justified both by economic issues and ease of preparation or by issues related to changes in masticatory capacity due to the use of dental prostheses or even
swal-lowing problems arising from pathologies21.
The Traditional pattern received this name because it reflects the basic diet of the Brazilian population, such as the “rice and beans” combi-nations and the “lettuce and tomato” salad.
A high adherence to the Traditional pattern
presents, in general, higher means of nutrient consumption when compared to the others, but it did not differ significantly in relation to most of the patterns. This pattern was highlighted only
in females when compared to the Soft diet
pat-tern because it presents higher means of protein;
when compared to the Healthy pattern it presents
a higher consumption of vitamin D.
The results of the component analysis of the
diet demonstrate that adhering more to the
Tra-ditional pattern can provide a larger supply of nutrients that are important for the proper nu-tritional status of the elderly, such as vitamin D and protein. Ferreira et al. (2014) confirmed that there is a fairly homogeneous distribution of this pattern in the population because these foods are the most frequently consumed by most
individ-uals21.
Fe
rr
eir
a-N
unes PM
found a high prevalence of inadequacy, mainly of vitamins A, E and D and of minerals such as
cal-cium, magnesium and iron16,38-40.
Strategic planning for qualitative changes in eating may help to satisfactorily provide a greater supply of vitamins and minerals. The new Food
Guide for the Brazilian Population41, for
exam-ple, calls for more general dietary recommen-dations, such as “making raw or minimally pro-cessed food as a staple food”, “limit the consump-tion of processed foods,” and “avoid consuming ultra-processed food”, among others.
These general guidelines can help minimize much of the negative impacts of nutritionally poor foods, such as ultra-processed foods, which should be replaced by foods rich in vitamins and minerals such as fruits and vegetables.
Some limitations inherent to food consump-tion studies should be evaluated and discussed for a better interpretation of the results of this study.
The amount of nutrient intake can be
influ-enced by the total amount of energy consumed42.
Therefore, in this study, before interpreting the nutrient intake data, a strategy for energy
adjust-ment was used43-45. Beaton46 emphasizes that food
intake cannot be estimated without errors, and probably will never be.
The FFQ is a recognized method for charac-terizing the typical diet, but, like other food sur-veys, it may underestimate or overestimate the
information collected regarding consumption7,28.
To reduce recall bias, a frequent phenomenon in patients of advanced age, the participation of a companion or caregiver was requested in all in-terviews. When it was not possible to rely on the participation of a companion in the interview, a
larger amount of time was taken for the inter-view, up to 1 ½ hours when necessary.
In recognizing the difficulties of estimating the typical diet, the present study did not eval-uate the individual’s typical intake in a precise way, but rather aimed to increase the knowledge regarding the heterogeneous dietary characteris-tics observed in this group of elderly people in Botucatu.
Despite efforts over the last half century, there is still a need for an international definition of harmonized methods and data collection for assessing the food consumption of this
popula-tion45.
Detailing the nutritional components of each food pattern presented expected results, which corroborated the characteristics of each pattern. On the other hand, some unexpected results were also found, which contributes to broaden the dis-cussion about the challenge of evaluating food consumption, with special attention to method-ological issues.
Adhering to eating patterns with
characteris-tics similar to the Healthy, Light and whole foods
and Traditional patterns can provide greater ma-cronutrient and mima-cronutrient inputs, contrib-uting to the reduction of the inadequate intake of important nutrients for the health of the el-derly population. In contrast, adhering to eating
patterns similar to the Snacks and weekend meal
pattern may contribute to a reduced intake of vi-tamins and minerals.
e C
ole
tiv
a,
23(12):4085-4094,
2018
Collaborations
PM Ferreira-Nunes contributed to the concep-tion and execuconcep-tion of the research, analysis and interpretation of the data, writing of the article, and critical review and approval of the final ver-sion of the article. SJ Papini participated in the critical review and approval of the final version of the article. JE Corrente contributed to the de-sign of the research, analysis and interpretation of the data, writing of the article, and critical review and approval of the final version of the article.
References
1. Campos MTFS, Monteiro JBR, Ornelas APRC. Fatores que afetam o consumo alimentar e a nutrição do idoso.
Rev Nutr 2000; 13(3):157-165.
2. Silveira EA, Lopes ACS, Caiaffa WT. Avaliação Nutri-cional de Idosos. In: Kac G, Sichieri R, Gigante DP, or-ganizadores. Epidemiologia nutricional. Rio de Janeiro: Fiocruz/Atheneu; 2007. p. 107.
3. Olinto MTA. Padrões alimentares: análise de compo-nentes principais. In: Kac G, Sichieri R, Gigante DP, or-ganizadores. Epidemiologia nutricional. Rio de Janeiro: Fiocruz/Atheneu; 2007. p. 213-225.
4. Hu FB. Dietary patterns analysis: A new direction in nutritional epidemiology. Curr Opin Lipidol 2002; 13(1):3-9.
5. Jacques PF, Tucker KL. Are dietary patterns useful for understanding the role of diet in chronic disease? Am J Clin Nutr 2001; 73(1):1-2.
6. Brasil. Ministério da Saúde (MS). Departamento de In-formática do SUS. Informações de Saúde. Brasília: MS; 2011.
7. Marchioni DML. Estudos epidemiológicos em exposi-ções nutricionais. In: Fisberg RM, Slater B, Marchioni DML, Martini LA, organizadores. Inquéritos alimenta-res. Métodos e bases científicos.Barueri: Manole; 2005. p. 87.
8. Nettleton JA, Steffen LM, Mayer-Davis EJ, Jenny NS, Jiang R, Herrington DM, Jacobs Junior DR. Dietary patterns are associated with biochemical markers of inflammation and endothelial activation in the Multi-Ethnic Study of Atherosclerosis (MESA). Am J
Clin Nutr 2006; 83(6):1369-1379.
9. Toledo ALA, Koifman RJ, Koifman S, Marchioni DML. Dietary patterns and risk of oral and pharyngeal can-cer: a casecontrol study in Rio de Janeiro, Brazil. Cad
Saude Publica 2010; 26(1):135-142.
10. Sichieri R. Dietary Patterns and Their Associations with Obesity in the Brazilian City of Rio de Janeiro. Obes Res 2002; 10(1):1-7.
11. Alves ALS, Olinto MTA, Costa JSD, Bairros FS, Balbi-notti MAA. Padrões alimentares de mulheres adultas residentes em área urbana no sul do Brasil. Rev Saude
Publica 2006; 40(5):865-873.
12. Tucker LK. Micronutrient status and aging. Nutr Rev 1995; 53:9-15.
13. Michaelsson K, Melhus H, Bellocco R, Wolk A. Dietary calcium and vitamin D intake in relation to osteopo-rotic fracture risk. Bone2003; 32(6):694-703.
14. Montilla RNG, Aldrighi JM, Marucci MFN. Relação cálcio/proteína da dieta de mulheres no climatério.
AMB Rev Assoc Méd Bras 2004; 50:52-54.
15. Lopes ACS, Caiaffa WT, Sichieri R, Mingoti AS, Lima-Costa MF. Consumo de nutrientes em adultos e idosos em estudo de base populacional: Projeto Bambuí. Cad
Saude Publica 2005; 21(4):1201-1209.
16. Fisberg RM, Marchioni DML, Castro MA, Junior EV, Araújo MC, Bezerra IN, Pereira RA, Sichieri R. Ingestão inadequada de nutrientes na população de idosos do Brasil: Inquérito Nacional de Alimentação 2008-2009.
Fe
rr
eir
a-N
unes PM
17. Pala V, Sieri S, Masala G, Pali D, Panico S, Vneis P, Sac-erdote C, Mattiello A, Galasso R, Salvini S, Ceroti M, Berrino F, Fuscon E, Tumino R, Frasca G, Riboli E, Trichopoulou A, Baibas N, Krogh V. Associations be-tween dietary pattern and lifestyle, anthropometry and other health indicators in the elderly participants of the EPIC-Italy cohort. Nutr Metab Cardiovasc Dis 2006; 16(3):186-201.
18. Haveman-Nies A, Tucker KL, Groot LC, Wilson PW, Van Staveren WA. Evaluation of dietary quality in relationship to nutritional and lifestyle factors in el-derly people of the US Framingham Heart Study and the European SENECA study. Eur J Clin Nutr 2001; 55(10):870-880.
19. Lin H, Bermudez OI, Tucker KL. Dietary patterns of Hispanic elders are associated with acculturation and obesity. J Nutr 2003; 133(11):3651-3657.
20. Corrente JE, Marchioni DML, Fisberg R.M. Validation of a FFQ (Food Frequency Questionaire) for older peo-ple. J Life Sic 2013; 7(8):878-882.
21. Ferreira PM, Papini SJ, Corrente JE. Diversity of eat-ing patterns in older adults: A new scenario? Rev. Nutr 2014;27(1):67-79.
22. Galante AP, Schwartzman F, Voci SM. Aplicações prá-ticas da Ingestão Dietética de referência. In: Rossi L, Caruso L, Galante AP, organizadores. Avaliação
nutri-cional: Novas perspectivas. Rio de Janeiro: Roca; 2015.
p.74.
23. Calixto-Lima L, Reis NT. Interpretação de Exames La-boratoriais Aplicados à Nutrição Clínica. Rio de Janeiro: Editora Rubio; 2012.
24. McLaren DS, Frigg M. Sight and Life Manual on
Vita-min A Deficiency Desorders (VADD). Basel: Task Force
Sight and Life; 2001
25. Nascimento AL, Diniz AS, Arruda IKG. Deficiência de vitamina A em idosos do Programa de Saúde da Famí-lia de Camaragibe, PE, Brasil. Archivos
Latinoamerica-nos de Nutricion 2007; 57(3):213-218.
26. Brasil. Resolução RDC nº 344, de 13 de dezembro de 2002. Áreas de atuação. Alimentos. Legislação especí-fica da área por assunto. Regulamentos técnicos por assunto. Farinhas de trigo e/ou milho fortificadas com ferro. Diário Oficial da União 2002; 18 dez.
27. Instituto Brasileiro de Geografia e Estatística (IBGE). Análise do consumo alimentar pessoal no Brasil. POF
2008/2009. Rio de Janeiro: IBGE; 2011.
28. Fisberg RM, Marchioni DML, Colucci ACA. Avalia-ção do consumo alimentar e da ingestão de nutrien-tes na prática clínica. Arq Bras Endocrinol Metab 2009; 53(5):617-624.
29. Novotny JA, Rumpler WV, Riddick H, Hebert JR, Rhodes D, Judd JT, Baer DJ, Mc Dowell M, Briefel R. Personality characteristics as predictors of underre-porting of energy intake on 24- hour dietary recall in-terviews. J Am Diet Assoc 2003;103(9):1146-1151. 30. Young LR, Nestle MS. Portion sizes in dietary
assess-ment: issues and policy Implications. Nutr Rev 1995; 53(6):149-158.
31. Tucker LK. Assessment of usual dietary intake in popu-lation studies of gene e diet interaction’. Nutrition, Me-tabolism & Cardiovascular Diseases 2007; 17(2):74-81. 32. Ferreira PM, Papini SJ, Corrente JE. Diversity of eating
patterns and obesity in older adults-A new challenge.
Health 2013; 5(8):23-28.
33. Philippi ST, Latterza AR, Cruz ATR, Ribeiro LC. Pirâ-mide alimentar adaptada. Rev Nutr Campinas 1999; 12(1):65-80.
34. Silveira EA, Martins BB, Abreu LRS, Cardoso CKS. Bai-xo consumo de frutas, verduras e legumes: fatores asso-ciados em idosos em capital no Centro-Oeste do Brasil.
Cien Saude Colet 2015; 20(12):3689-3699.
35. Oliveira SO, Lacerda LNL, Santos LC, Lopes ACS, Câ-mara AMCS, Menzel HJK, Horta PM. Consumo de frutas e hortaliças e as condições de saúde de homens e mulheres atendidos na atenção primária à saúde. Cien
Saude Colet2015;20(8):2313-2322.
36. Jaime PC, Figueiredo ICR, Moura EC, Malta DC . Fa-tores associados ao consumo de frutas e hortaliças no Brasil. Rev Saude Publica 2009; 43(2):57-64.
37. Malta MB, Papini SJ, Corrente JE. Avaliação da ali-mentação de idosos de município paulista – aplicação do Índice de Alimentação Saudável’. Cien Saude Colet 2013; 18(2):377-384.
38. Barbosa AM, Nunes IFOC, Carvalho LR, Figuerêdo RG, Nogueira AMT, Carvalho CMRG. Ingestão alimen-tar de cálcio e vitamina D e associação com o nível de escolaridade na pessoa idosa. Demetra 2013; 8(2):173-181.
39. Abreu WC, Franceschini SCC, Tinoco AL, Pereira CAS, Silva MMS. Inadequação no consumo alimentar e fa-tores interferentes na ingestão energética de idosos matriculados no programa municipal da terceira idade de viçosa (MG). Revista baiana de Saúde Pública 2008; 32(2):190-202.
40. Souza LB, Corrente JE, Papini SJ. Prevalence of Inad-equacy Intake for Older People: The Use of National Cancer Institute (NCI) Method. Food and Nutrition Sciences 2013; 4:25-30.
41. Brasil. Ministério da Saúde (MS). Guia alimentar para a população brasileira. Brasília: MS; 2014.
42. Willett W, Stampfer M. Implications of total energy intake for epidemiologic Analyses. In: Willett, W, or-ganizador. Nutritional epidemiology.New York: Oxford University Press; 1998. p. 514.
43. Willett WC, Howe GR, Kushi LH. Adjustment for total energy intake in epidemiologic studies. Am J Clin Nutr 1997; 65(Supl. 4):1220-1228.
44. Atwater WO, Benedict FG. Experiments on the metab-olism of matter and energy in the human body, 1898– 1900. Washington:Government Printing Office; 1902. No. 109.
45. Food and Agriculture Organization (FAO). Food energy – methods of analysis and conversion factors.Report of a
technical workshop. Rome: Food and Nutrition Paper;
2003.
46. Beaton GH. Approaches to analysis of dietary data: relationship between planned analyses and choice of methodology. Am J Clin Nutr 1994;59(1):253-261.
Article presented 05/09/2016 Approved 11/09/2016
Final version presented 11/11/2016
This is an Open Access article distributed under the terms of the Creative Commons Attribution License BY