Alberto Cargnelutti Filho(1) and José Paulo Guadagnin(2)
(1)Universidade Federal de Santa Maria, Avenida Roraima, no 1.000, Camobi, CEP 97105-900 Santa Maria, RS, Brazil. E-mail:
[email protected] (2)Fundação Estadual de Pesquisa Agropecuária, Rua Alfredo Chaves, no 243, CEP 95330-000
Veranópolis, RS, Brazil. E-mail: [email protected]
Abstract – The objective of this work was to determine the sufficient number of experiments (environments) for the adaptability and stability analyses of maize cultivars, using the Eberhart and Russell method. Grain yield data from 63 trials of maize cultivars from six groups of experiments were used. In each group, new data files were formed from all experiments (n), for the combinations of 3, 4, ..., n-1 experiments, totaling 10,381 files. Mean and estimates of the adaptability (b) and stability (S2d) parameters were obtained for each
cultivar, in each file. A power function was adjusted for the amplitudes of b and S2d (dependent variables)
in each cultivar, as a function of the number of experiments (independent variable), totaling 290 equations (145 cultivars × two dependent variables). For each equation, the value was determined on the abscissa axis (Xs, sufficient number of experiments), corresponding to the point of maximum curvature. The highest value among the 290 estimates of Xs, rounded up to the nearest integer, was assumed to be the sufficient number of experiments for the analyses. Seven experiments are sufficient to analyze the adaptability and stability of maize cultivars using the Eberhart and Russell method.
Index terms: Zea mays, genotype × environment interaction, indication of cultivars.
Número suficiente de experimentos para análises de adaptabilidade
e estabilidade de milho pelo método de Eberhart e Russell
Resumo – O objetivo deste trabalho foi determinar o número de experimentos (ambientes) suficientes para a análise da adaptabilidade e da estabilidade de cultivares de milho, pelo método de Eberhart e Russell. Utilizaram-se os dados de produtividade de grãos de 63 ensaios de cultivares de milho provenientes de seis grupos de experimentos. Em cada grupo, foram formados novos arquivos de dados a partir de todos os experimentos (n), para as combinações de 3, 4, ..., n-1 experimentos, o que totalizou 10.381 arquivos. A média e as estimativas dos parâmetros de adaptabilidade (b) e estabilidade (S2d) foram obtidas para cada cultivar,
em cada arquivo. Ajustou-se uma função potência para as amplitudes de b e de S2d (variáveis dependentes)
em cada cultivar, em função do número de experimentos (variável independente), no total de 290 equações (145 cultivares × duas variáveis dependentes). Para cada equação, determinou-se o valor no eixo das abscissas (Xs, número suficiente de experimentos) correspondente ao ponto de curvatura máxima. Assumiu-se o maior valor entre as 290 estimativas de Xs, arredondado para o inteiro superior, como sendo o número suficiente de experimentos para a análise. Sete experimentos são suficientes para a análise de adaptabilidade e estabilidade em cultivares de milho pelo método de Eberhart e Russell.
Termos para indexação: Zea mays, interação genótipo × ambiente, indicação de cultivares.
Introduction
In a genotype assessment network, each experiment is a sample of experiments that could be performed in one region. This sample should be formed by a representative number of experiments of the region being studied. In addition, the sample should be sufficient, so that the parameter estimates used to analyze adaptability and stability are reliable, in
order to provide sound indications of genotypes. An insufficient number of experiments can generate inaccurate estimates; however, too many experiments can represent a waste of time, labor, and financial resources for accuracy gain.
precision, and type of the information required (Cruz et al., 2012). A comprehensive explanation of advantages and disadvantages of the different methodologies used to analyze adaptability and stability was provided by Carvalho et al. (2016). The method of Eberhart & Russell (1966) has been often used to analyze different agricultural species.
Several authors compared the methodologies used to analyze adaptability and stability of maize cultivars, such as Scapim et al. (2000), Murakami et al. (2004), Schmildt & Cruz (2005), Cargnelutti Filho et al. (2007), Cargnelutti Filho et al. (2009b), Namorato et al. (2009), Scapim et al. (2010), Oliveira et al. (2013), Faria et al. (2017), and Oliveira et al. (2017). In these studies, however, the focus was to assess the agreement, or disagreement, between methods, regarding the indication of cultivars. The comparisons ranged from two (Murakami et al., 2004; Schmildt & Cruz, 2005) to 13 methods (Cargnelutti Filho et al., 2009b), and no unanimity as to a particular methodology was reported. The method of Eberhart & Russell (1966) was present in all these studies, which shows its importance, and among the seven methods evaluated by Cargnelutti Filho et al. (2007), it was the preferred one, considering productivity, stability, and adaptability together, assigned to general, favorable, or unfavorable environments. Further details on this methodology are present in Cruz et al. (2012, 2014). Nonetheless, no study has indicated the sufficient number of environments to be used with this important method, which have been carried out with sets of experiments fluctuating between five (Cargnelutti Filho et al., 2009b; Faria et al., 2017) and 21 (Scapim et al., 2010).
A discussion on the theoretical bases related to the adequate number of experimental environments in the study of genotype x environment interaction was performed by Resende (1998). Applied studies have been developed to determine the required number of experiments to compare bean cultivars (Cargnelutti Filho et al., 2006), by cluster analysis (Cargnelutti Filho et al., 2009a), and by path analysis (Cargnelutti Filho et al., 2011). Benin et al. (2014) studied the optimal number of trials to predict grain yield of wheat genotypes, in order to select and recommend cultivars.
It is generally assumed that a few number of environments may be insufficient to generate reliable adaptability and stability estimates, whereas too
many environments may represent an unnecessary investment.
The objective of this work was to determine the sufficient number of experiments (environments) to analyse the adaptability and stability of maize cultivars, using the Eberhart and Russell method, based on grain yield.
Materials and Methods
Grain yield data (13% moisture content) of 63 trials (environments) were used to compare maize cultivars (Zea mays L.), in the state of Rio Grande do Sul, Brazil. The experiments were classified into six groups, and the composition, described as follows, is ordered by group name, number of assessed cultivars, number of environments, and crop season. Early-cycle cultivars: P3, 36 cultivars assessed in 10 environments, in 2002/2003; P4, 40, in 11 environments, in the 2003/2004; and P5, 32, assessed in 10 environments, in the 2004/2005. Super-early-cycle cultivars: SP3, 11, assessed in 9 environments, in 2002/2003; SP4, 9, in 12 environments, in 2003/2004; and SP5, 17, in 11 environments, in the 2004/2005 crop season. A randomized block design, with three replicates, was used in the experiments. The experimental units consisted of two 5 m long rows, spaced at 0.8 m.
The individual variance was analyzed, and the homogeneity of residual variance was verified for each group of experiments. Then, the joint variance analysis was performed, considering the fixed effect of the cultivar and the random effects of environments and blocks, according to the following model defined in Cruz et al. (2012): Y = +B/E +G +E +GE +ijk µ jk i j ij εijk,
where Yijk is the grain yield of the ith genotype (cultivar) (i = 1, 2, ..., g) in the jth environment (experiment) (j = 3, 4, ..., n) and kth replicate (block) (k = 1, 2, ..., r); μ is the general average; B/Ejk is the random effect of the kth block within the jth environment; G
i is the fixed effect of the ith genotype (cultivar); E
j is the random effect of the jth environment (experiment); GE
ij is the random effect of the interaction of the ith genotype (cultivar) with the jth environment (experiment); and ε
ijk corresponds to the random error associated with each observation.
obtained with the expression F=MSG/MSGE, in which: MSG is the mean square of the cultivar; and MSGE is the mean square of the cultivar by environment interaction (Cruz, 2013).
To study the sufficient number of experiments required to analyze adaptability and stability with the Eberhart & Russell (1966) method, for each group composed of n experiments, new data files were formed by the combinations of 3, 4, 5, ..., n experiments. Groups P3 and P5 formed each a file with the 10 experiments [reference; C(10.10)= 1 file]; the other files were formed by the combinations of the 10 experiments in groups of: three [C(10.3)= 120 files], four [C(10.4)= 210 files], five [C(10.5)= 252 files], six [C(10.6)= 210 files], seven [C(10.7)= 120 files], eight [C(10.8)= 45 files], and nine [C(10.9)= 10 files] experiments, totaling 968 files in each group. Groups P4 and SP5 formed a file with the 11 experiments [reference; C(11.11)= 1 file]; the other files were formed by the combination of the 11 experiments in groups of three [C(11.3)= 165], four [C(11.4)= 330], five [C(11.5)= 462], six [C(11.6)= 462], seven [C(11.7)= 330], eight [C(11.8)= 165], nine [C(11.9)= 55], and ten [C(11,10)= 11] experiments, totaling 1,981 files in each group. Group SP3 formed a file with the 9 experiments [reference; C(9.9)= 1 file]; the other files were obtained by the combination of the 9 experiments in groups of three [C(9.3)= 84], four [C(9.4)= 126], five [C(9.5)=126], six [C(9.6)= 84], seven [C(9.7)= 36], and eight [C(9.8)= 9] experiments, totaling 466 files. Finally, group SP4 formed a file with the 12 experiments [reference; C(12.12)= 1 file]; the other files were obtained by the combinations of the 12 experiments in groups of three [C(12.3)= 220], four [C(12.4)= 495], five [C(12.5)= 792], six [C(12.6)= 924], seven [C(12.7)= 792], eight [C(12.8)= 495], nine [C(12.9)= 220], ten [C(12.10)= 66], and eleven [C(12,11)= 12] experiments, totaling 4,017 files. Thus, the combinations of 3, 4, 5, ..., n experiments formed a total of 10,381 files.
Adaptability and stability were analyzed after the analyses of individual and joint variances, totaling 10,381 analyses (one for each file). The linear regression model adopted in the Eberhart & Russel (1966) method was Y =ij βoi+β1i jI +δij+εij, in which: Yij is the mean grain yield of the ith genotype (cultivar) (i = 1, 2, ..., g) in the jth environment (experiment) (j = 3, 4, ..., n); βoi is the general mean of the ith cultivar; β1iIj corresponds to the linear regression coefficient, of which the estimate represents the response of the ith
cultivar to the variation of the environment; Ij is the environmental index obtained with the expression
I =Y
g
-Y gn j
.j ..
j j
I
=
∑
(
0
)
;δij is the regression deviation; and εij is the mean experimental error (Cruz et al., 2012).
The parameters used in the individual assessment of
the cultivars were the mean (βoi) and the linear regression coefficient (β1i), which measured adaptability. The stability parameter (σdi
2
) was estimated using the analysis of variance between the mean square of the regression deviation of each cultivar (MSDi) and the mean square of the residual of the joint analysis (MSR), that is: σdi
2
i
= MSD -MSR /r,
(
)
where r is the number of replicates (Cruz et al., 2012).In the Eberhart & Russel (1966) method, adaptability is the ability of cultivars to use stimuli from the
environment to their advantage. Cultivars with β1i>1 have specific adaptability to favorable environments;
when β1i<1, they are considered to have specific adaptability to unfavorable environments; and when
β1i=1, they are considered to have general adaptability. Stability refers to the predictability of the cultivar according to the linear regression model. Cultivars with insignificant regression deviation variances (σdi2 ) are considered stable, and those with significant regression deviation variances are considered unstable.
The parameters A and B from the linear model (Y = A+BX) were estimated for the amplitudes of m (dependent variable, Y) as a function of the number of experiments (independent variable, X), and of the coefficient of determination (R2). Also, for each cultivar, the parameters A and B of the power model (Y = A/XB) were estimated for the amplitudes of b and S2d (dependent variables, Y), as a function of the number of experiments (independent variable, X) and of the coefficient of determination (R2). Estimates of A, B, and R2 were obtained by iterative process using the Gauss-Newton algorithm, until convergence was obtained, in order to minimize the sum of squares of the error. The values established for the convergence criterion were: maximum number of iterations = 200, and tolerance = 0.000099.
Based on the power model, we obtained 72 equations in the P3 group (36 cultivars × two dependent variables). For each equation, the abscissa value was calculated (Xs, sufficient number of experiments), corresponding to the point of maximum curvature (Meier & Lessman, 1971), with the expression Xs = [A2B2(2B+1) / (B+2)]1/2B+2). These same procedures were performed for the 40, 32, 11, 9, and 17 cultivars of groups P4, P5, SP3, SP4, and SP5, respectively. Thus, 290 equations were obtained (145 cultivars × two dependent variables). The amplitudes of b and S2d decreased gradually with the increase of the number of experiments, that is, there was an increase of the precision of the estimates of b and S2d, respectively. The decrease of b and S2d estimates is accentuated until Xs is reached, then this trend decreases and tend to stabilize, with negligible gains in precision. Therefore, we adopted a criterion to define the sufficient number of experiments as the highest value of Xs among the 290 estimates, rounded up to the nearest integer to guarantee accuracy. Statistical analyses were performed with Microsoft Office Excel, from the Genes program (Cruz, 2013), and with the R software (R Core Team, 2017).
Results and Discussion
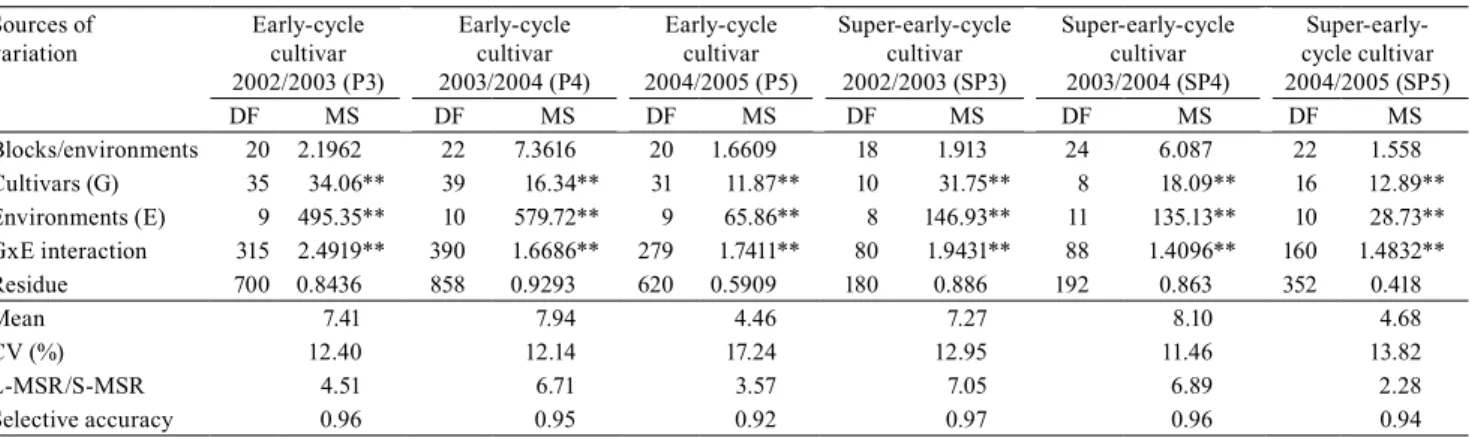
In the joint analyses of all the experiments (n), the relation between the largest and the smallest mean square of the environments fluctuated between the groups from 2.28 (SP5) to 7.05 (SP3) (Table 1). A practical criterion is to consider the residual variances
homogeneous when this relation is smaller than 7.0 (Cruz et al., 2012). Nonetheless, the group SP3 was also considered to have homogeneous residual variances (>MSR/<MSR=7.05), which allowed of the joint analyses. The genotype x environment interaction was significant for grain yield in the six groups of experiments. Therefore, the behavior of the cultivars varied according to the environments. Selective accuracy (SA) values were equal to, or greater than 0.92, which represents a very high experimental
accuracy (SA≥0.90), according to Resende & Duarte
(2007).
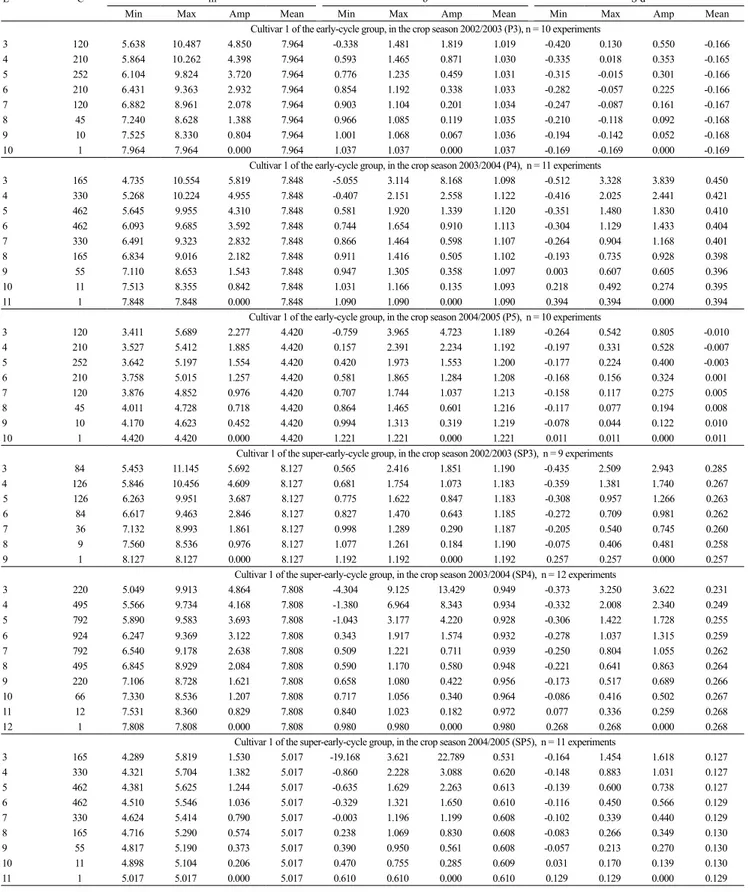
In the P3 group, composed of 36 early-cycle cultivars assessed in 10 environments (n=10), in the crop season 2002/2003, 120 data files were formed with the combinations of the 10 experiments in groups of 3. Among the 120 files, the mean grain yield of cultivar 1, taken as a reference to discuss the behavior of the other cultivars, ranged from 5.638 to 10.487 Mg ha-1, with an amplitude of 4.850 Mg ha-1 (Table 2). When the number of experiments increased, the minimum values increased, and the maximum values decreased, resulting in a linear reduction of amplitude (Y) as a function of the number of experiments (X): Y = -0.7115X + 7.1462 (R² = 0.9966). This reduction of amplitude increases the accuracy of the mean estimates (7.964 Mg ha-1).
increasing accuracy gains with the increasing number of experiments: P4, Y = 12.19X - 35.113 (R² = 0.999); P5, Y = 13.536X - 38.036 (R² = 0.995); SP3, Y = 16.42X - 47.888 (R² = 0.9993); SP4, Y = 10.546X - 28.895 (R² = 0.9957); and SP5, Y = 12.911X - 42.203 (R² = 0.9961).
The linear pattern of decreasing amplitudes and, consequently, increasing accuracies of the mean estimate, when the number of experiments increased, was similar for all the other cultivars of all groups (Figure 1). Therefore, the researcher needs only to establish a desired precision, in order to obtain the sufficient number of experiments based on the mean. However, besides the mean, it is also important to define the sufficient number of experiments for adaptability (regression coefficient, b) and stability parameters (variance of the regression deviations, S2d) of the Eberhart & Russell (1966) method.
In the example of cultivar 1 from group P3, among the 120 estimates of b obtained from the 120 files with 3 experiments, the minimum value was -0.338, and the maximum one was 1.481, with an amplitude of 1.819 and a mean of 1.019 (Table 2). With the increasing number of experiments, the minimum values increased, the maximum values decreased, and the mean stabilized. Thus, with 4, 5, 6, 7, 8, 9, and 10 experiments, the amplitudes were 0.871, 0.459, 0.338, 0.201, 0.119, 0.067, and 0.000, respectively. This behavior of the amplitudes as a function of the number of experiments was adjusted to the power model Y = 33.6372/X2.6516
(R² = 0.9962). This behavior was also observed for cultivar 1 of groups: P4, Y = 405.8155/X3.5638 (R² = 0.9938); P5, Y = 49.9248/X2.1599 (R² = 0.9774); SP3, Y = 16.0078/X1.9459 (R² = 0.9540); SP4, Y = 236.4088/ X2.5722 (R² = 0.9700); and SP5, Y = 8.0864/X1.1672 (R² = 0.8511). This pattern of decreasing amplitudes and, consequently, increasing accuracies for estimate b, when the number of experiments increases, was similar for all other cultivars, from all groups (Figure 1), with
a good fit to the power model (0.7997≤R²≤0.9991). The
mean of the 145 estimates of R² was 0.9694, which shows the suitability of this model to represent the variation in the amplitude of b as a function of the number of experiments. Therefore, we can use the maximum curvature value of the model to calculate the value of Xs that represent the sufficient number of experiments. Up to this value, the precision gains in the estimation of b are high and, after it, they become less expressive, with a tendency to stabilize, indicating that the increasing expenses in labor, time, and financial resources with more experiments may not pay off for accuracy in classifying the adaptability of the cultivars.
For the adaptability parameter of cultivar 1 in group P3, the abscissa value (Xs) that corresponded to the point of maximum curvature (Meier & Lessman, 1971) was estimated by the expression Xs = [33.63722× 2.65162(2×2.6516+1)/(2.6516+2)]1/(2×2.6516+2) = 3.57 ≈ 4 experiments. For this cultivar, in the groups P4, P5, SP3,
Table 1. Analysis of variance of grain yield of maize (Zea mays) cultivars, and the relation between the largest and the
smallest mean square residuals (L-MSR/S-MSR) between the environments, in six groups of experiments(1).
Sources of variation
Early-cycle cultivar 2002/2003 (P3)
Early-cycle cultivar 2003/2004 (P4)
Early-cycle cultivar 2004/2005 (P5)
Super-early-cycle cultivar 2002/2003 (SP3)
Super-early-cycle cultivar 2003/2004 (SP4)
Super-early-cycle cultivar 2004/2005 (SP5)
DF MS DF MS DF MS DF MS DF MS DF MS
Blocks/environments 20 2.1962 22 7.3616 20 1.6609 18 1.913 24 6.087 22 1.558
Cultivars (G) 35 34.06** 39 16.34** 31 11.87** 10 31.75** 8 18.09** 16 12.89**
Environments (E) 9 495.35** 10 579.72** 9 65.86** 8 146.93** 11 135.13** 10 28.73**
GxE interaction 315 2.4919** 390 1.6686** 279 1.7411** 80 1.9431** 88 1.4096** 160 1.4832**
Residue 700 0.8436 858 0.9293 620 0.5909 180 0.886 192 0.863 352 0.418
Mean 7.41 7.94 4.46 7.27 8.10 4.68
CV (%) 12.40 12.14 17.24 12.95 11.46 13.82
L-MSR/S-MSR 4.51 6.71 3.57 7.05 6.89 2.28
Selective accuracy 0.96 0.95 0.92 0.97 0.96 0.94
(1)P3, 36 early-cycle cultivars and 10 environments; P4, 40 early-cycle cultivars and 11 environments; P5, 32 early-cycle cultivars and 10 environments;
Table 2. Minimum (Min), maximum (Max), amplitude (Amp), and mean estimates of the mean (m) and of the adaptability (regression coefficient, b) and stability parameters (variance of the regression deviations, S2d) of the Eberhart & Russell
(1966) model used for the analysis of maize (Zea mays) yield of cultivar 1, in combinations (C) of 3, 4, ..., n experiments (E).
E C m b S2d
Min Max Amp Mean Min Max Amp Mean Min Max Amp Mean Cultivar 1 of the early-cycle group, in the crop season 2002/2003 (P3), n = 10 experiments
3 120 5.638 10.487 4.850 7.964 -0.338 1.481 1.819 1.019 -0.420 0.130 0.550 -0.166 4 210 5.864 10.262 4.398 7.964 0.593 1.465 0.871 1.030 -0.335 0.018 0.353 -0.165 5 252 6.104 9.824 3.720 7.964 0.776 1.235 0.459 1.031 -0.315 -0.015 0.301 -0.166 6 210 6.431 9.363 2.932 7.964 0.854 1.192 0.338 1.033 -0.282 -0.057 0.225 -0.166 7 120 6.882 8.961 2.078 7.964 0.903 1.104 0.201 1.034 -0.247 -0.087 0.161 -0.167 8 45 7.240 8.628 1.388 7.964 0.966 1.085 0.119 1.035 -0.210 -0.118 0.092 -0.168 9 10 7.525 8.330 0.804 7.964 1.001 1.068 0.067 1.036 -0.194 -0.142 0.052 -0.168 10 1 7.964 7.964 0.000 7.964 1.037 1.037 0.000 1.037 -0.169 -0.169 0.000 -0.169
Cultivar 1 of the early-cycle group, in the crop season 2003/2004 (P4), n = 11 experiments
3 165 4.735 10.554 5.819 7.848 -5.055 3.114 8.168 1.098 -0.512 3.328 3.839 0.450 4 330 5.268 10.224 4.955 7.848 -0.407 2.151 2.558 1.122 -0.416 2.025 2.441 0.421 5 462 5.645 9.955 4.310 7.848 0.581 1.920 1.339 1.120 -0.351 1.480 1.830 0.410 6 462 6.093 9.685 3.592 7.848 0.744 1.654 0.910 1.113 -0.304 1.129 1.433 0.404 7 330 6.491 9.323 2.832 7.848 0.866 1.464 0.598 1.107 -0.264 0.904 1.168 0.401 8 165 6.834 9.016 2.182 7.848 0.911 1.416 0.505 1.102 -0.193 0.735 0.928 0.398 9 55 7.110 8.653 1.543 7.848 0.947 1.305 0.358 1.097 0.003 0.607 0.605 0.396 10 11 7.513 8.355 0.842 7.848 1.031 1.166 0.135 1.093 0.218 0.492 0.274 0.395 11 1 7.848 7.848 0.000 7.848 1.090 1.090 0.000 1.090 0.394 0.394 0.000 0.394
Cultivar 1 of the early-cycle group, in the crop season 2004/2005 (P5), n = 10 experiments
3 120 3.411 5.689 2.277 4.420 -0.759 3.965 4.723 1.189 -0.264 0.542 0.805 -0.010 4 210 3.527 5.412 1.885 4.420 0.157 2.391 2.234 1.192 -0.197 0.331 0.528 -0.007 5 252 3.642 5.197 1.554 4.420 0.420 1.973 1.553 1.200 -0.177 0.224 0.400 -0.003 6 210 3.758 5.015 1.257 4.420 0.581 1.865 1.284 1.208 -0.168 0.156 0.324 0.001 7 120 3.876 4.852 0.976 4.420 0.707 1.744 1.037 1.213 -0.158 0.117 0.275 0.005 8 45 4.011 4.728 0.718 4.420 0.864 1.465 0.601 1.216 -0.117 0.077 0.194 0.008 9 10 4.170 4.623 0.452 4.420 0.994 1.313 0.319 1.219 -0.078 0.044 0.122 0.010 10 1 4.420 4.420 0.000 4.420 1.221 1.221 0.000 1.221 0.011 0.011 0.000 0.011
Cultivar 1 of the super-early-cycle group, in the crop season 2002/2003 (SP3), n = 9 experiments
3 84 5.453 11.145 5.692 8.127 0.565 2.416 1.851 1.190 -0.435 2.509 2.943 0.285 4 126 5.846 10.456 4.609 8.127 0.681 1.754 1.073 1.183 -0.359 1.381 1.740 0.267 5 126 6.263 9.951 3.687 8.127 0.775 1.622 0.847 1.183 -0.308 0.957 1.266 0.263 6 84 6.617 9.463 2.846 8.127 0.827 1.470 0.643 1.185 -0.272 0.709 0.981 0.262 7 36 7.132 8.993 1.861 8.127 0.998 1.289 0.290 1.187 -0.205 0.540 0.745 0.260 8 9 7.560 8.536 0.976 8.127 1.077 1.261 0.184 1.190 -0.075 0.406 0.481 0.258 9 1 8.127 8.127 0.000 8.127 1.192 1.192 0.000 1.192 0.257 0.257 0.000 0.257
Cultivar 1 of the super-early-cycle group, in the crop season 2003/2004 (SP4), n = 12 experiments
3 220 5.049 9.913 4.864 7.808 -4.304 9.125 13.429 0.949 -0.373 3.250 3.622 0.231 4 495 5.566 9.734 4.168 7.808 -1.380 6.964 8.343 0.934 -0.332 2.008 2.340 0.249 5 792 5.890 9.583 3.693 7.808 -1.043 3.177 4.220 0.928 -0.306 1.422 1.728 0.255 6 924 6.247 9.369 3.122 7.808 0.343 1.917 1.574 0.932 -0.278 1.037 1.315 0.259 7 792 6.540 9.178 2.638 7.808 0.509 1.221 0.711 0.939 -0.250 0.804 1.055 0.262 8 495 6.845 8.929 2.084 7.808 0.590 1.170 0.580 0.948 -0.221 0.641 0.863 0.264 9 220 7.106 8.728 1.621 7.808 0.658 1.080 0.422 0.956 -0.173 0.517 0.689 0.266 10 66 7.330 8.536 1.207 7.808 0.717 1.056 0.340 0.964 -0.086 0.416 0.502 0.267 11 12 7.531 8.360 0.829 7.808 0.840 1.023 0.182 0.972 0.077 0.336 0.259 0.268 12 1 7.808 7.808 0.000 7.808 0.980 0.980 0.000 0.980 0.268 0.268 0.000 0.268
Cultivar 1 of the super-early-cycle group, in the crop season 2004/2005 (SP5), n = 11 experiments
Figure 1. Amplitudes of the estimates of the mean, and of the adaptability (regression coefficient, b) and stability parameters
(variance of the regression deviations, S2d) of the Eberhart & Russell (1966) model, for maize (Zea mays) yield, obtained
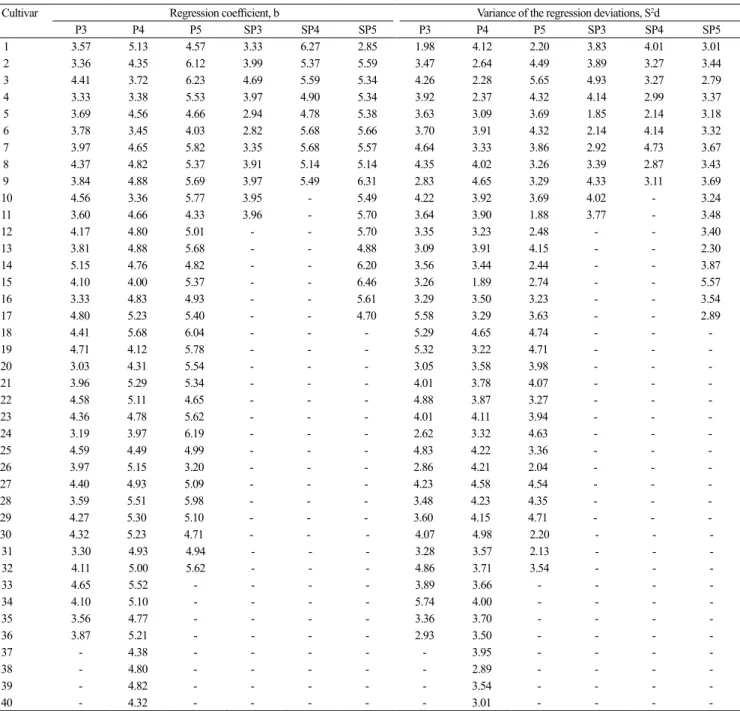
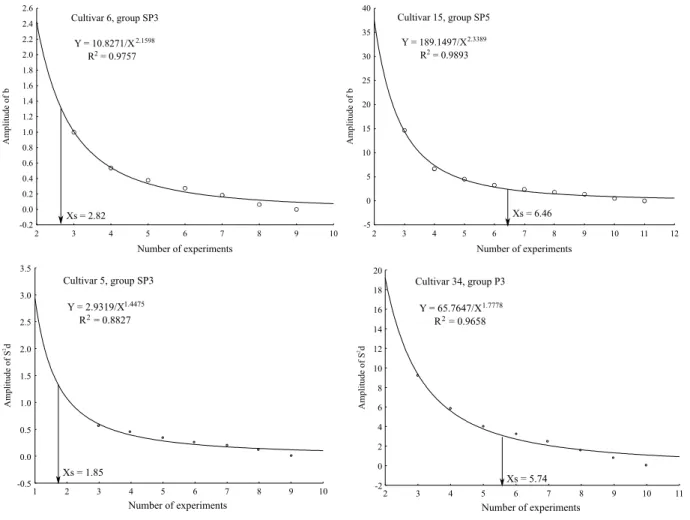
SP4, and SP5, the sufficient number of experiments was 5.13, 4.57, 3.33, 6.27, and 2.85, respectively (Table 3). Among all cultivars, in all groups, the sufficient number of experiments ranged from 2.82 (cultivar 6,
SP3 group) to 6.46 (cultivar 15, SP5 group) (Table 3 and Figure 2). Therefore, seven experiments are sufficient to estimate the adaptability parameter with
Table 3. Number of experiments (Xs) sufficient to estimate the adaptability (regression coefficient, b) and stability (variance of regression deviations parameters, S2d) of 145 maize cultivars, assessed in six groups of experiments.
Cultivar Regression coefficient, b Variance of the regression deviations, S2d
P3 P4 P5 SP3 SP4 SP5 P3 P4 P5 SP3 SP4 SP5
1 3.57 5.13 4.57 3.33 6.27 2.85 1.98 4.12 2.20 3.83 4.01 3.01
2 3.36 4.35 6.12 3.99 5.37 5.59 3.47 2.64 4.49 3.89 3.27 3.44
3 4.41 3.72 6.23 4.69 5.59 5.34 4.26 2.28 5.65 4.93 3.27 2.79
4 3.33 3.38 5.53 3.97 4.90 5.34 3.92 2.37 4.32 4.14 2.99 3.37
5 3.69 4.56 4.66 2.94 4.78 5.38 3.63 3.09 3.69 1.85 2.14 3.18
6 3.78 3.45 4.03 2.82 5.68 5.66 3.70 3.91 4.32 2.14 4.14 3.32
7 3.97 4.65 5.82 3.35 5.68 5.57 4.64 3.33 3.86 2.92 4.73 3.67
8 4.37 4.82 5.37 3.91 5.14 5.14 4.35 4.02 3.26 3.39 2.87 3.43
9 3.84 4.88 5.69 3.97 5.49 6.31 2.83 4.65 3.29 4.33 3.11 3.69
10 4.56 3.36 5.77 3.95 - 5.49 4.22 3.92 3.69 4.02 - 3.24
11 3.60 4.66 4.33 3.96 - 5.70 3.64 3.90 1.88 3.77 - 3.48
12 4.17 4.80 5.01 - - 5.70 3.35 3.23 2.48 - - 3.40
13 3.81 4.88 5.68 - - 4.88 3.09 3.91 4.15 - - 2.30
14 5.15 4.76 4.82 - - 6.20 3.56 3.44 2.44 - - 3.87
15 4.10 4.00 5.37 - - 6.46 3.26 1.89 2.74 - - 5.57
16 3.33 4.83 4.93 - - 5.61 3.29 3.50 3.23 - - 3.54
17 4.80 5.23 5.40 - - 4.70 5.58 3.29 3.63 - - 2.89
18 4.41 5.68 6.04 - - - 5.29 4.65 4.74 - -
-19 4.71 4.12 5.78 - - - 5.32 3.22 4.71 - -
-20 3.03 4.31 5.54 - - - 3.05 3.58 3.98 - -
-21 3.96 5.29 5.34 - - - 4.01 3.78 4.07 - -
-22 4.58 5.11 4.65 - - - 4.88 3.87 3.27 - -
-23 4.36 4.78 5.62 - - - 4.01 4.11 3.94 - -
-24 3.19 3.97 6.19 - - - 2.62 3.32 4.63 - -
-25 4.59 4.49 4.99 - - - 4.83 4.22 3.36 - -
-26 3.97 5.15 3.20 - - - 2.86 4.21 2.04 - -
-27 4.40 4.93 5.09 - - - 4.23 4.58 4.54 - -
-28 3.59 5.51 5.98 - - - 3.48 4.23 4.35 - -
-29 4.27 5.30 5.10 - - - 3.60 4.15 4.71 - -
-30 4.32 5.23 4.71 - - - 4.07 4.98 2.20 - -
-31 3.30 4.93 4.94 - - - 3.28 3.57 2.13 - -
-32 4.11 5.00 5.62 - - - 4.86 3.71 3.54 - -
-33 4.65 5.52 - - - - 3.89 3.66 - - -
-34 4.10 5.10 - - - - 5.74 4.00 - - -
-35 3.56 4.77 - - - - 3.36 3.70 - - -
-36 3.87 5.21 - - - - 2.93 3.50 - - -
-37 - 4.38 - - - 3.95 - - -
-38 - 4.80 - - - 2.89 - - -
-39 - 4.82 - - - 3.54 - - -
-40 - 4.32 - - - 3.01 - - -
the Eberhart & Russell (1966) method, for all cultivars in these groups of experiments.
For the stability parameter (S2d) of cultivar 1 in group P3, among the 120 estimates of S2d obtained from 120 files with 3 experiments, the minimum value was -0.420, and the maximum was 0.130, with an amplitude of 0.550, and a mean of -0.166 (Table 2). Theoretically, estimates of variance of the regression deviations should be positive and, consequently, possible adjustments in the methodology are required and should be the subject of further studies. However, a more detailed look into this subject was not the focus of the present study.
With the increasing number of experiments, the minimum values of S2d increased, the maximum values decreased, and the mean stabilized. Thus, with 4, 5, 6, 7, 8, 9, and 10 experiments, the amplitudes were 0.353, 0.301, 0.225, 0.161, 0.092, 0.052 and 0.000, respectively (Table 2). This decreasing behavior of the amplitudes, as a function of the number of experiments, fitted to the power model Y = 3.4348/X1.6377 (R² = 0.9393). The same behavior was also observed for cultivar 1 in the following groups: P4, Y = 23.3947/X1.6278 (R² = 0.9645); P5, Y = 4.4556/X1.5385 (R² = 0.9481); SP3, Y = 21.9999/X1.8217 (R² = 0.9633); SP4 Y = 21.3969/ X1.6003 (R² = 0.9765); and SP5, Y = 10.4481/X1.6814 (R²
Figure 2. Minimum and maximum values of the sufficient number of experiments (Xs) necessary to estimate the
adaptability (regression coefficient, b) and stability parameters (variance of the regression deviations, S2d) of the Eberhart
= 0.9755). This pattern of decreasing amplitudes and increasing accuracies was, once more, similar for all other cultivars in all groups (Figure 1), with good fit
to the power model (0.8734≤R≤0.9887). The mean for
the 145 estimates of R² was 0.9654, which shows the suitability of this model to represent the variation of the amplitude of S2d as a function of the number of experiments.
For cultivar 1 in group P3, the abscissa value corresponding to the maximum point of curvature in S2d (Meier & Lessman, 1971) was estimated with the expression Xs = [3.43482×1.63772(2×1.6377+1)/ (1.6377+2)]1/(2×1.6377+2) = 1.98 ≈ 2 experiments. However, a number of experiments lower than three experiments has no practical meaning in the analysis with the Eberhart & Russell (1966) method, since there would be only two points to adjust the linear regression of grain yield as a function of the environmental index. For cultivar 1 in the groups P4, P5, SP3, SP4, and SP5, the sufficient number of experiments was 4.12, 2.20, 3.83, 4.01, and 3.01, respectively (Table 3). Among all cultivars, in all groups, the sufficient number of experiments ranged from 1.85 (cultivar 5, SP3 group) to 5.74 (cultivar 34, P3 group) (Table 3 and Figure 2). Thus, six experiments are sufficient to estimate the stability parameter of the Eberhart & Russell (1966) method, for all cultivars in these groups.
The improvement of accuracy of estimates of m, b, and S2d, with the increase of the number of experiments for all cultivars and group of experiments, can be explained by the reduction of the amplitude values of the means and of the adaptive parameters. Thus, assuming the largest one of the 290 estimates of Xs (Table 3 and Figure 2), rounded up to the nearest integer, it can be inferred that seven experiments (environments) are sufficient to analyze the adaptability and stability of grain yield of maize cultivars with the Eberhart & Russell (1966) model. A similar number of experiments was established by Cargnelutti Filho et al. (2006, 2009a, 2011), and Benin et al. (2014).
Cargnelutti Filho et al. (2006) concluded that seven experiments allowed of the identification of superior bean cultivars, with 85% accuracy. Seven and six experiments were considered sufficient to identify divergent bean cultivars, using Ward and Tocher grouping methods, respectively (Cargnelutti Filho et al., 2009a). Moreover, Cargnelutti Filho et al. (2011) defined that seven experiments were sufficient for
path analysis in bean cultivars. Benin et al. (2014) concluded that the optimum number of experiments to predict grain yield in wheat, with 80% accuracy, ranged from 8 to 14. Resende (1998) points out that there is no justification in using more than nine experiments for the selection based on mean values. Fensterseifer et al. (2017), however, reported that only three experiments are already able to guarantee a reliable calibration or validation of the CropGro-soybean model.
Therefore, seven experiments can be assumed as a reference. However, more studies of this type are suggested, involving more methods for the evaluation of the stability and adaptability, as well as more scenarios involving different numbers of cultivars, replicates, and experiments, for maize and other crops.
Conclusion
Seven experiments (environments) are sufficient to analyze the adaptability and stability of maize cultivars (Zea mays) with the Eberhart and Russell method, based on grain yield.
Acknowledgments
To Conselho Nacional de Desenvolvimento Científico e Tecnológico (CNPq), for the research grant to the first author.
References
BENIN, G.; STORCK, L.; MARCHIORO, V.S.; FRANCO, F. de A.; TREVIZAN, D.M. Número ótimo de ensaios de competição de trigo em diferentes regiões de adaptação. Ciência Rural, v.44, p.247-252, 2014. DOI: 10.1590/S0103-84782013005000152.
CARGNELUTTI FILHO, A.; PERECIN, D.; MALHEIROS, E.B.; GUADAGNIN, J.P. Comparação de métodos de adaptabilidade e estabilidade relacionados à produtividade de grãos de cultivares de milho. Bragantia, v.66, p.571-578, 2007. DOI: 10.1590/S0006-87052007000400006.
CARGNELUTTI FILHO, A.; RIBEIRO, N.D.; BURIN, C.; TOEBE, M.; CASAROTTO, G. Número necessário de experimentos para a análise de trilha em feijão. Ciência Rural, v.41, p.564-572, 2011. DOI: 10.1590/S0103-84782011005000036.
CARGNELUTTI FILHO, A.; RIBEIRO, N.D.; JOST, E. Número necessário de experimentos para a análise de agrupamento de cultivares de feijão. Ciência Rural, v.39, p.371-378, 2009a. DOI: 10.1590/S0103-84782008005000059.
Received on June 27, 2017 and accepted on September 21, 2017
feijão. Ciência Rural, v.36, p.1701-1709, 2006. DOI: 10.1590/ S0103-84782006000600006.
CARGNELUTTI FILHO, A.; STORCK, L.; RIBOLDI, J.; GUADAGNIN, J.P. Associação entre métodos de adaptabilidade e estabilidade em milho. Ciência Rural, v.39, p.340-347, 2009b. DOI: 10.1590/S0103-84782008005000080.
CARVALHO, L.C.B.; DAMASCENO-SILVA, K.J.; ROCHA, M. de M.; OLIVEIRA, G.C.X. Evolution of methodology for the study of adaptability and stability in cultivated species. African Journal of Agricultural Research, v.11, p.990-1000, 2016. DOI: 10.5897/AJAR2015.10596.
CRUZ, C.D. GENES: a software package for analysis in experimental statistics and quantitative genetics. Acta Scientiarum. Agronomy, v.35, p.271-276, 2013. DOI: 10.4025/ actasciagron.v35i3.21251.
CRUZ, C.D.; CARNEIRO, P.C.S.; REGAZZI, A.J. Modelos biométricos aplicados ao melhoramento genético. 3.ed. rev. e ampl.Viçosa: Ed. da UFV, 2014. v.2, 668p.
CRUZ, C.D.; REGAZZI, A.J.; CARNEIRO, P.C.S. Modelos biométricos aplicados ao melhoramento genético. 4.ed. Viçosa: Ed. da UFV, 2012. v.1, 514p.
EBERHART, S.A.; RUSSELL, W.A. Stability parameters for comparing varieties. Crop Science, v.6, p.36-40, 1966. DOI: 10.2135/cropsci1966.0011183X000600010011x.
FARIA, S.V.; LUZ, L.S.; RODRIGUES, M.C.; CARNEIRO, J.E. de S.; CARNEIRO, P.C.S.; DELIMA, R.O. Adaptability and stability in commercial maize hybrids in the southeast of the State of Minas Gerais, Brazil. Revista Ciência Agronômica, v.48, p.347-357, 2017. DOI: 10.5935/1806-6690.20170040.
FENSTERSEIFER, C.A.; STRECK, N.A.; BAIGORRIA, G.A.; TIMILSINA, A.P.; ZANON, A.J.; CERA, J.C.; ROCHA, T.S.M. On the number of experiments required to calibrate a cultivar in a crop model: the case of CROPGRO-soybean. Field Crops Research, v.204, p.146-152, 2017. DOI: 10.1016/j.fcr.2017.01.007.
MEIER, V.D.; LESSMAN, K.J. Estimation of optimum field plot shape and size for testing yield in Crambe abyssinica Hochst. Crop Science, v.11, p.648-650, 1971. DOI: 10.2135/ cropsci1971.0011183X001100050013x.
MURAKAMI, D.M.; CARDOSO, A.A.; CRUZ, C.D.; BIZÃO, N. Considerações sobre duas metodologias de análise de estabilidade
e adaptabilidade. Ciência Rural, v.34, p.71-78, 2004. DOI: 10.1590/S0103-84782004000100011.
NAMORATO, H.; MIRANDA, G.V.; SOUZA, L.V. de; OLIVEIRA, L.R.; DELIMA, R.O.; MANTOVANI, E.E. Comparing biplot multivariate analyses with Eberhart and Russell’ method for genotype x environment interaction. Crop Breeding and Applied Biotechnology, v.9, p.299-307, 2009.
OLIVEIRA, R.B.R. de; MOREIRA, R.M.P.; FERREIRA, J.M. Adaptability and stability of maize landrace varieties. Semina: Ciências Agrárias, v.34, p.2555-2564, 2013. DOI: 10.5433/1679-0359.2013v34n6p2555.
OLIVEIRA, T.R.A. de; CARVALHO, H.W.L. de; COSTA, E.F.N.; CARVALHO FILHO, J.L.S. de. Correlation among adaptability and stability assessment models in maize cultivars. Australian Journal of Crop Science, v.11, p.516-521, 2017. DOI: 10.21475/ ajcs.17.11.05.p304.
R CORE TEAM. R: a language and environment for statistical computing. Vienna: R Foundation for Statistical Computing, 2017.
RESENDE, M.D.V. de; DUARTE, J.B. Precisão e controle de qualidade em experimentos de avaliação de cultivares. Pesquisa Agropecuária Tropical, v.37, p.182-194, 2007.
RESENDE, M.D.V. Interação genótipo x ambiente e determinação do número adequado de locais de experimentação com base nas estatísticas “F” de Snedecor da análise de variância conjunta. Boletim de Pesquisa Florestal, n.37, p.55-66, 1998.
SCAPIM, C.A.; OLIVEIRA, V.R.; BRACCINI, A. de L. e; CRUZ, C.D.; ANDRADE, C.A. de B.; VIDIGAL, M.C.G. Yield stability in maize (Zea mays L.) and correlations among the parameters of the Eberhart and Russell, Lin and Binns and Huehn models. Genetics and Molecular Biology, v.23, p.387-393, 2000. DOI: 10.1590/S1415-47572000000200025.
SCAPIM, C.A.; PACHECO, C.A.P.; AMARAL JÚNIOR, A.T. do; VIEIRA, R.A.; PINTO, R.J.B.; CONRADO, T.V. Correlations between the stability and adaptability statistics of popcorn cultivars. Euphytica, v.174, p.209-218, 2010. DOI: 10.1007/ s10681-010-0118-y.