Growth curves and nutritional requirements for maintenance of
asymptotic weight of Nellore cattle
1Curvas de crescimento e exigências nutricionais para mantença do peso assintótico de
bovinos Nelore
Rosana Moreira da Silva de Arruda2*, Júlio César de Souza2, Rodrigo José Delgado Jardim3, Paulo Bahiense
Ferraz Filho2 and Luiz Otávio Campos Silva4
ABSTRACT - The objective of this study was to evaluate the growth curve of Nellore cattle raised in the Pantanal, Mato Grosso do Sul, in different groups of size (weight), sex, and birth season, as well as to estimate the nutritional requirements for maintenance of the asymptotic weigh. The nonlinear models were adjusted using the Gauss-Newton method, with information on weight and age of animals within each (total, upper, and middle) group. The asymptotic weight was influenced by sex (P<0.05) in all groups. Regarding maturity rates, females in the total herd and upper group were more precocious than males, whereas males and females in the middle group were similar. Animals born in the dry season of the year showed a greater asymptotic weight in the total herd and upper group, and significant difference was not observed only in the middle group. Regarding asymptotic weight for the growth curve of the total herd (318.5 ± 0.92 kg), the upper group (384.4 ± 1.74 kg) requires 15.1% more nutrients for their daily maintenance. The nutritional requirements for daily maintenance in the middle group (294.5 ± 1.00 kg) is 5.7% lower than in the total herd. The animals kept in the same herd (in the Pantanal conditions) showed different growth curves, as a function of the birth season and sex, indicating variations in growth and different energy requirements for their maintenance.
Key words: Birth station. Total digestible nutrients. Maturity rate.
RESUMO -Objetivou-se avaliar a curva de crescimento de bovinos Nelore criados no Pantanal de Mato Grosso do Sul em diferentes grupos de tamanho (peso), sexo e estação de nascimento, além de estimar as exigências nutricionais para mantença do peso assintótico. Os modelos não lineares foram ajustados pelo método de Gauss-Newton com informações de peso e idade dos animais dentro de cada grupo (total, superior e mediano). O peso assintótico foi influenciado pelo sexo (P<0.05) em todos os grupos avaliados. As fêmeas foram mais precoces que os machos no rebanho total e grupo superior, enquanto que o grupo mediano apresentou taxas de maturidade similares entre machos e fêmeas. Os animais nascidos na estação seca do ano apresentaram maior peso assintótico para o rebanho total e grupo superior, não apresentando diferenças apenas para o grupo mediano. Em relação ao peso assintótico para a curva de crescimento do rebanho total (318.5 ± 0.92 kg), o grupo superior (384.4 ± 1.74 kg) necessita de 15.1 % a mais de exigências nutricionais para mantença diária. Para o grupo mediano (294.5 ± 1.00 kg) a exigências nutricionais para mantença diária é 5.7% menor em comparação ao rebanho total. Os animais mantidos em um mesmo rebanho (condições de Pantanal) apresentaram diferentes curvas de crescimento, de acordo com a estação de nascimento e sexo, indicando variações no crescimento e, consequentemente, diferentes exigências de energia de mantença.
Palavras-chave:Estação de nascimento. Nutrientes digestíveis totais. Taxa de maturidade.
DOI: 10.5935/1806-6690.20180078 *Author for correspondence
Received for publication in 16/03/2016; approved in 02/02/2018
1Parte da Tese de Doutorado do primeiro autor apresentada na Universidade Federal de Mato Grosso do Sul
2Departamento de Pós-Graduação em Ciência Animal, Faculdade de Medicina Veterinária e Zootecnia/FAMEZ, Universidade Federal de Mato Grosso
do Sul/UFMS, Campo Grande-MS, Brasil, rosana.msilva@uol.com.br, julio.souza@ufms.br, pferraz@ceul.ufms.br
3Departamento de Pós-Graduação em Zootecnia, Unidade Universitária de Aquidauana/UUA, Universidade Estadual de Mato Grosso do Sul/UEMS,
Aquidauana-MS, Brasil, rodrigo.fazbodoquena@gmail.com
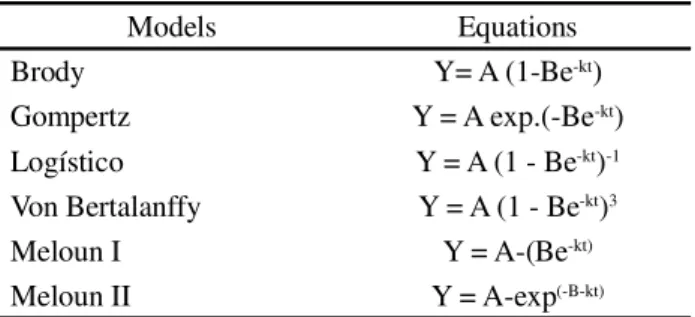
Table 1 - Nonlinear regression models used to describe the growth curves
Y: animal weight at age (t); t: animal age; A: animal asymptotic weight; B: integration constant; k: maturity rate
INTRODUCTION
Live weight during animal life is a complex process that depends on the genotype and environmental conditions acting along time, and several methodologies may be used to evaluate, estimate, or predict the factors to
assure herd efficiency (SILVAet al., 2010).
In the search for responses to address cattle performance in their adulthood, a description of animal growth is necessary because all productive and reproductive processes are directly related to their growth
(GONÇALVESet al., 2011).
Although the Nellore breed has highly favorable traits for production under tropical conditions, adaptation and production under an extensive system also presents reproductive and growth rate deficiency. This factor motivated further studies on cattle growth curves because termination precocity is expected to correlate with sexual precocity and reproductive performance (KOURY FILHO, 2005).
Koury Filho (2005) reports that there are various morphological types in the Nellore breed, which are reflected in different behavior of growth curves, and the most productive genotypes for each Brazilian production system can be identified.
Regarding differences in cattle body size, a major study focus is related to its biological and economic effects on animal production efficiency. Among the biological effects, extra cost for energy maintenance, association with various quantity and quality meat parameters, adaptability to feeding conditions, climate, and other production
system resources are highlighted (SILVAet al., 2011).
The objectives of this study were to evaluate the growth curve of Nellore cattle, raised in the Pantanal region of Mato Grosso do Sul, in different groups of size (weight), sex, and birth season, and estimate the nutritional requirements for the maintenance of the asymptotic weight. For this purpose, nonlinear models were used.
MATERIAL AND METHODS
Information on weight and age of 8,710 animals (4,422 females and 4,288 males) of the Nellore breed were used. The animals were born in the period 1978-2012, were aged from their birth until 600 days, and were managed in extensive creation system in a property in the Municipality of Miranda, Pantanal region of Mato Grosso do Sul State.
Six non-linear models were utilized (Table 1), and the Gauss-Newton method and NLIN procedure (SAS statistical package; SAS Institute, 2012) were used.
The complete (total) database was divided into two animal groups based on the standard weight deviation (72.95 kg) in relation to the overall mean of the last animal weight (213.05 kg). The upper group (UG; 50% of males) was composed of animals whose last weight was equal to or greater than the mean plus one deviation, and the middle group (MG; 43% of males) was composed of animals whose last weight was in the range of mean ± one deviation. Animals with final weight in the range of mean minus one deviation were withdrawn from the group analysis, although remaining only in the general herd (TH), due to their asymptote values.
The following criteria were used to evaluate and compare the fit quality in the non-linear regression models: Determination coefficient (R²), given by the formula:
(1)
whereSSR is the regression sum of squares andSSTO is
the total sum of squares.
Square root of the predicted mean square error (RMSE), given by:
(2)
whereý
l is the predicted value in the i
th observation andy
is the measured value at the ith observation.
In the mean square of the prediction error (MSPE
= 1/n∑n
i=ι(ýι|-yi)
2), which is composed of mean bias,
systematic bias, and random error, the percentage of each type of error in each model was identified.
Comparison between models regarding prediction accuracy was performed based on the Akaike Delta Information Criterion (AIC), which is given by:
AIC = -2logLik + 2N (3)
where N is the number of parameters estimated by the model and Log Lik is the logarithm of maximum likelihood.
Models Equations
Brody Y= A (1-Be-kt)
Gompertz Y = A exp.(-Be-kt)
Logístico Y = A (1 - Be-kt)-1
Von Bertalanffy Y = A (1 - Be-kt)3
Meloun I Y = A-(Be-kt)
Total herd R2 RMSE
Decomposition of MSPE (%)
AIC Bias
Error Random
Mean Systematic
Brody 0.939 22.24 10.0 6.4 83.6 125.2
Gompertz 0.941 21.90 10.6 5.9 83.5 124.6
Logistic 0.937 22.42 10.0 5.2 84.8 125.8
Von Bertalanffy 0.942 21.87 10.7 6.2 83.1 124.4
Meloun I 0.939 22.25 10.0 6.3 83.7 125.2
Meloun II 0.939 22.25 10.0 6.4 83.7 125.2
Upper Group
Brody 0.979 15.19 1.9 15.1 83.0 109.8
Gompertz 0.980 14.16 1.2 7.6 91.3 108.8
Logistic 0.976 14.80 0.3 2.2 97.5 111.9
Von Bertalanffy 0.980 14.14 1.8 9.8 88.4 108.3
Meloun I 0.979 15.19 2.0 15.0 83.0 109.8
Meloun II 0.979 15.19 1.9 15.1 83.0 109.8
Middle Group
Brody 0.937 17.00 13.6 2.4 84.0 114.5
Gompertz 0.912 19.53 7.6 3.7 88.7 121.2
Logistic 0.887 21.85 4.1 4.4 91.5 126.3
Von Bertalanffy 0.921 18.59 9.1 3.3 87.6 118.9
Meloun I 0.937 17.00 13.5 2.5 84.0 114.6
Meloun II 0.937 17.00 13.6 2.4 84.0 114.6
The total digestible nutrient averages required to maintain each group were estimated based on a publication of the National Research Council (NRC, 2000), according to their asymptotic weight (A), by means of the equation:
(4)
so thatMEm is the average metabolizable energy, given
by the following expression:
(5)
RESULTS AND DISCUSSION
In all groups and models, the values for R2 were
higher than 91%, indicating adjustment skills in all groups, except in the middle group (logistic model:
88.7%) (Table 2). Souzaet al. (2010) estimated R2 values
higher than 95.8% for the logistic, Von Bertalanffy, and Gompertz models in Indubrasil cattle.
Fernandes et al. (2012) reported that the linear,
Gompertz, logarithmic, and logistic models are able to predict the observed variability in animal weight when R2 > 0.86.
Variation was observed in the values for square root of the mean squared prediction error in the total herd (21.87-22.42 kg), upper group (14.14-15.19 kg), and middle group (17.00-21.85 kg). For this evaluation criterion, the most accurate models are those with the lowest estimated value, which were observed in the Von Bertalanffy (TH and UG) and Brody, Meloun I and II (MG) models.
By decomposing the mean squared prediction error into mean bias, systematic bias, and random error, the logistic model showed a greater error of random origin, i.e., it is the model in which the error or residue cannot be controlled, although it is not the most accurate
R2: coefficient of determination. RMSE: square root of the mean square of prediction error. MSPE: mean square of prediction error. AIC: Akaike’s
information criterion
among other models. The other models presented the highest percentage of errors with origin in the parameters estimated by the models, thus influencing the slope of the growth curve. The bias can be corrected using additive (average addictions) or multiplicative (systematic addictions) factors.
Fernandes et al. (2012) estimated the prediction
errors (79-90%) associated with random errors in the
logarithmic, Gompertz, and logistic models. Forni et al.
(2009) analyzed non-linear models to describe the growth curve of Nellore cattle and selected the Gompertz, Von Bertalanffy, and Brody models as the best fits. However, the Brody model showed to be the most accurate.
In the evaluation with the Akaike’s Delta Information Criterion (AIC), which is related to model accuracy, the Von Bertalanffy model presented the lowest values in both upper and total herd groups, thus indicating a greater accuracy certainty in relation to other models. The Brody model showed the highest precision for the middle group.
Based on the results of the comparative analysis, the Von Bertalanffy model was selected to adjust the cattle growth curves for the upper group and total herd, whereas the Brody model was selected for the middle group.
According to the practical point of view of Silva
et al. (2004), the Gompertz model is the most indicated to describe the growth of Nellore cattle, as it presents a good fit and a higher convergence percentage. Garnero
et al. (2005) concluded that the Von Bertalanffy, Brody, Gompertz, and logistic models are suitable to establish average patterns for the growth of Nellore females. However, Freitas (2005) concluded that the logistic
model, followed by the Von Bertalanffy model, were the most versatile models to adjust the growth data of different animal species.
Marinhoet al. (2013) based their study on growth
curves of Nellore cattle raised in the Amazonian biome. They identified the Brody and Von Bertalanffy models as the most suitable to fit the growth curve in the period from the birth to 750 days of age, but the Brody model showed
to be the most accurate. Forni et al. (2009) found that
the Gompertz and Von Bertalanffy models were the most accurate to predict the adult weight of Nellore cattle.
Sexual dimorphism was observed in all groups evaluated in the present study. In males, the asymptotic weight (A) was higher than in females of the total herd (28%), upper group (21%), and middle group (6%).
Santos et al. (2011) estimated growth curves for
Nellore calves (from birth to 10 months of age) raised on native pastures (Nhecolândia sub-region, Pantanal region, Mato Grosso do Sul) and the end of the evaluated period, they determined the average weight animals in the herd (170 kg), and difference between sexes was not observed.
Malhado et al. (2009), analyzed the growth curve for
Nellore cattle using the logistic model, and determined that the weight of males was higher (about 24%) than the asymptotic weight of females.
Mangwiroet al. (2013) attributed the differences
between weights of males and females to their hormonal differences, whose effects appear in the growth curves.
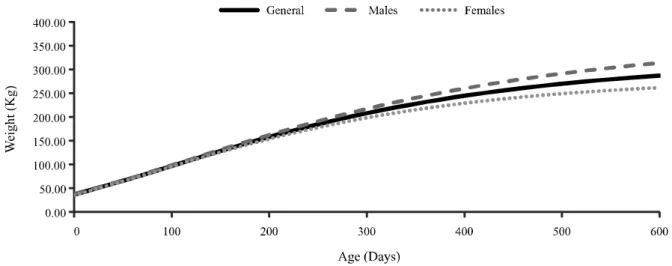
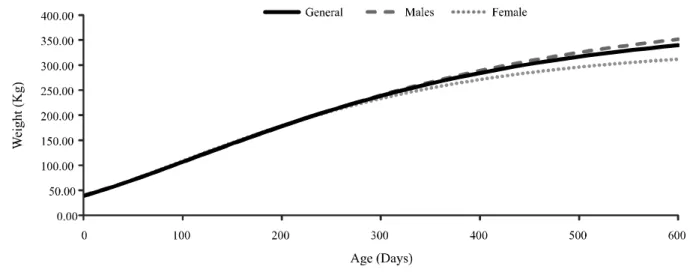
Malhado et al. (2009) stated that the difference between
the male and female growths is small in the pre-weaning phase, increasing with age. This behavior is observed in the growth curves for the three groups, with a smaller variation in the middle group (Figures 1, 2 and 3).
Figure 3 - Weight estimate as a function of age, obtained using the Brody model for Nellore cattle raised in the Pantanal region, MS, (Middle Group)
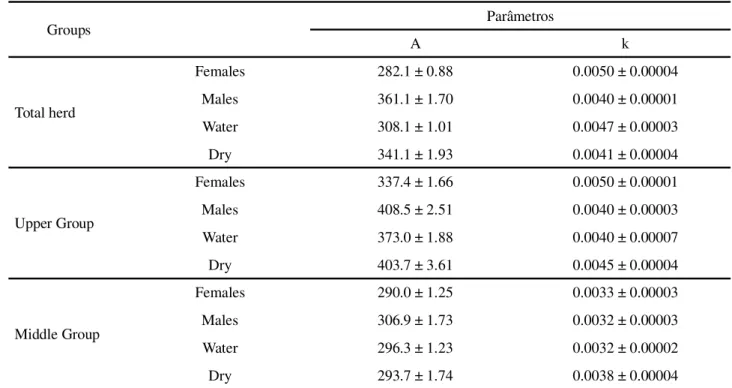
The parameter k, which represents the growth rate to reach the asymptotic weight, presented higher values for females in the total herd and upper group (Table 3).
This confirms what was observed by Malhado et al.
(2009) for animals of the Nellore breed, in which the males presented a lower value for the parameter k and, consequently, their development was slower than that of females.
In the middle group, the growth rate values were similar to those of males and females, although with different asymptotes. This behavior indicates that animals of both sexes presented the same growth rate in
the evaluated period. According to Santos et al. (2011),
growth curves for young ages may not detect differences in the maturity rate, if the last age in which the animals were evaluated does not correspond to the maturity age.
Regarding the birth season, the results showed higher asymptotic weights (A) in the total herd and upper group for animals born in the dry season (Jun-Set) of the year. The middle group presented values close to A in both seasons of birth.
In the upper and middle groups, animals born in the dry season presented higher values for growth rate (k). The same behavior was not observed in the total herd, possibly due to the high slopes of the asymptotes for the relative growth of low-weight cattle in the water season. As explained in the of Methods section, they remained in the total flock, but were not evaluated as an individualized group (lower group).
In the Pantanal region, the dry season leads to a reduction in flooded areas. This allows the forages to
present levels of proteins able to meet the minimum initial maintenance needs of breeding cows. A greater availability and quality of fodder occurs in the water season, due to rainfall and light, reflecting on a higher milk production, thus contributing to the weaning of heavier progenies.
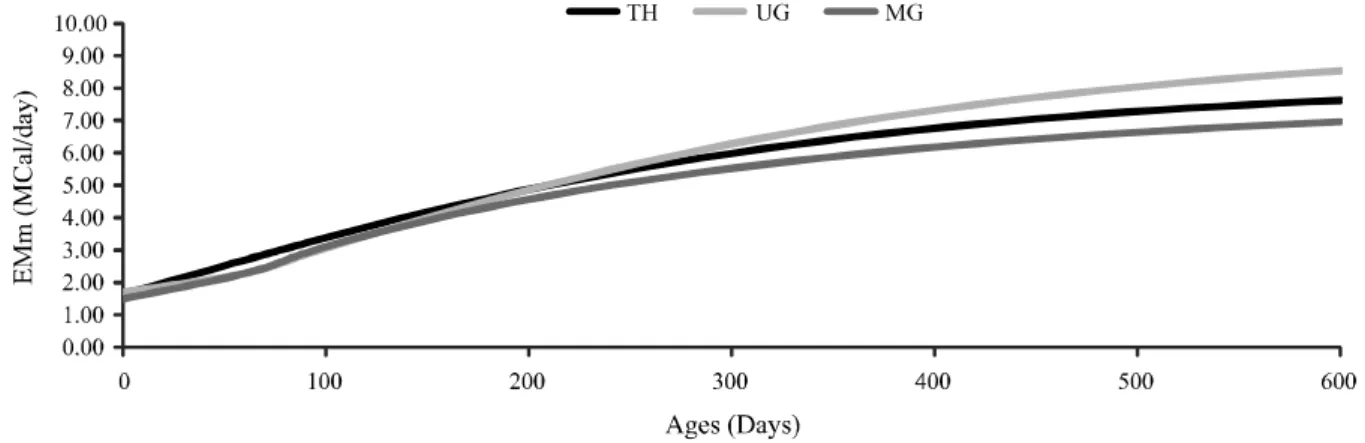
Based on the mean asymptotic weight of each group, the estimates of daily maintenance energy, indicated that the upper group needs more NDTm (13.31% per day) for their maintenance as compared to the total herd. In the middle group, the required amount of NDTm per day is lower (5.70%) as compared to the average requirement of the whole herd, whereas the upper group needs more NDTm (18.25%) than the middle group (Table 4).
According to Rosa et al. (2000), in the context
of beef cattle production, about 70% of the energy
A: estimated asymptotic weight; B: estimated integration constant; k: maturity rate; NDTm: mean of total digestible nutrients required in the daily diet
Table 4 - Estimates of parameters of growth models for Nellore cattle raised in the Pantanal region
Total herd Parameters NDTm (Kg/day)
A B k
Total herd 318.5 0.5138 0.0045 2.28
Upper Group 384.4 0.5344 0.0018 2.63
Middle Group 294.5 0.8890 0.0032 2.15
consumption of the production systems is destined for maintenance of the animals. The increase in adult weight also increases proportionally to age, puberty, or age at a particular maturity rate and, given that the maintenance needs are proportional to the size, the greater the animal, the greater its requirement (KOURY FILHO, 2005).
The results indicate that animals of medium size (weight) (values up to the general average of the herd ± one deviation) may require less energy for maintenance. However, the asymptotic weight (A) at 600 days of age is lower (Figure 4), and these animals are more precocious than those with weights beyond this range, which may contribute to lower requirements regarding the production system and, therefore, lower production costs.
Table 3 - Estimate of the parametersA andk by sex and birth season, obtained for Nellore cattle raised in the Pantanal region, MS
A: estimated asymptotic weight; B: estimated integration constant; k: maturity rate
Groups Parâmetros
A k
Total herd
Females 282.1 ± 0.88 0.0050 ± 0.00004
Males 361.1 ± 1.70 0.0040 ± 0.00001
Water 308.1 ± 1.01 0.0047 ± 0.00003
Dry 341.1 ± 1.93 0.0041 ± 0.00004
Upper Group
Females 337.4 ± 1.66 0.0050 ± 0.00001
Males 408.5 ± 2.51 0.0040 ± 0.00003
Water 373.0 ± 1.88 0.0040 ± 0.00007
Dry 403.7 ± 3.61 0.0045 ± 0.00004
Middle Group
Females 290.0 ± 1.25 0.0033 ± 0.00003
Males 306.9 ± 1.73 0.0032 ± 0.00003
Water 296.3 ± 1.23 0.0032 ± 0.00002
Figure 4 - Estimates of metabolizable energy for the daily maintenance of Nellore cattle, raised in the Pantanal region, MS, and divided into total herd (TH), upper group (UG), and middle group (MG)
CONCLUSION
Animals from the same farm presented different growth curves according to sex and birth season. A large variation was observed in the maintenance requirement and, therefore, the amount of total digestible nutrients needed for each group.
REFERENCES
FERNANDES, H. J.et al. Evaluation of mathematical models to describe growth of grazing young bulls.Revista Brasileira de Zootecnia, v. 41, n. 2, p. 367-373, 2012.
FORNI, S.et al. Comparison of different nonlinear functions to describe Nellore cattle growth.Journal of Animal Science, v. 87, p. 496-506, 2009.
FREITAS, A. R. Curvas de crescimento na produção animal. Revista Brasileira de Zootecnia, v. 34, n. 3, p. 786-795, 2005.
GARNERO, A.et al. Parâmetros genéticos da taxa de maturação e do peso assintótico de fêmeas da raça Nelore. Arquivo Brasileiro de Medicina Veterinária e Zootecnia, v. 57, n. 5, p. 652-662, 2005.
GONÇALVES, F. M.et al. Avaliação genética para peso corporal em um rebanho Nelore. Arquivo Brasileiro de Medicina Veterinária e Zootecnia, v. 63, n. 1, p. 158-164, 2011.
KOURY FILHO, W. Escores visuais e suas relações com características de crescimento em bovinos de corte/ 2005. 98 f. Tese (Doutorado em Zootecnia) - Universidade Estadual Paulista Júlio de Mesquita Filho, Jabuticabal, 2005.
MALHADO, C. H. M. et al. Modelos não-lineares utilizados para descrever o crescimento de bovinos da raça Nelore no
estado da Bahia: 1. Efeito ambiental. Revista Brasileira de Saúde e Produção Animal, v. 10, n. 4, p. 821-829, 2009.
MANGWIRO, T. N. et al. Non genetic factors affecting calf growth traits in mashona cattle. Journal of Animal Science, v. 2, n. 8, p. 222-227, 2013.
MARINHO, K. N. S.et al. Nonlinear models for fitting growth curves of Nellore cows reared in the Amazon Biome.Revista Brasileira de Zootecnia, v. 42, n. 9, p. 645-650, 2013.
NATIONAL RESEARCH COUNCIL. Seeds: nutrients requirements of beef cattle. 7th. ed. Washington, D.C.: National Academy Press, 2000. 242 p.
ROSA, A. de N.et al. Variabilidade genética do peso adulto de matrizes em um rebanho Nelore do estado de São Paulo.Revista Brasileira de Zootecnia, v. 29, n. 6, p. 1706-1711, 2000.
SANTOS, S. A.et al. Growth curve of Nellore calves reared on natural pasture in the Pantanal.Revista Brasileira de Zootecnia, v. 40, n. 12, p. 2947-2953, 2011.
SAS INSTITUTE. SAS/STAT Software: changes and enhancement through release. Version 9.1. Cary, 2012. SILVA, F. L.et al. Curvas de crescimento em vacas de corte de diferentes tipos biológicos. Pesquisa Agropecuária Brasileira, v. 46, n. 3, p. 262-271, 2011.
SILVA, N. A. M. daet al. Curvas de crescimento e influência de fatores não genéticos sobre a taxa de crescimento de bovinos a raça Nelore.Ciência e Agroecologia, v. 28, n. 3, p. 647-654, 2004. SILVA, N. A. M. da et al. Modelo hierárquico bayesiano aplicado na avaliação genética de curvas de crescimento de bovinos de corte.Arquivo Brasileiro de Medicina Veterinária e Zootecnia, v. 62, n. 2, p. 409-418, 2010.
SOUZA, L. A. et al. Curvas de crescimento em bovinos da raça Indubrasil criados no estado do Sergipe. Revista Ciência Agronômica, v. 41, n. 4, p. 671-676, 2010.