Investment Capacity and the Electoral Marketplace
Evidence from Brazil
∗Victor Ara´
ujo
†Maur´ıcio Izumi
‡Fernando Limongi
§Umberto Mignozzetti
¶Abstract
The importance of money in elections is a hallmark of contemporary democracies. In this paper, we study how investment capacity, defined as the resources remaining after the municipality perform the mandatory expenditures, influences elections in Brazil. We theorize that when a politician wins the election in a low investment capacity municipality, this generates commitment problems, as new mayors are unable to reward the firms that contributed to their campaigns, influencing the next elections. We test these claims by considering a close-elections regression discontinuity design coupled with heterogeneous quantile effects for Brazilian municipalities between 2000 and 2012. We find that incumbent mayors in towns with low investment capacity receive less campaign donation afterward and are more disadvantaged in their reelection contests. The results are robust to design variations and changes in party labels or mayoral characteristics. Our findings have implications for the influence of money on politics in democratic countries.
Keywords: Investment capacity; campaign contributions; incumbency effects;
close-elections regression discontinuity design; Brazil.
Abstract word count: 149 Total word count: 3977
∗We would like to thank Guilherme Fasolin, Larissa Santos, and the participants at MPSA for their
valuable comments. All the remaining errors are our entire responsibility.
†Ph.D. Candidate, Chair of Political Economy and Development, University of Z¨urich. Contact: victor.
‡Post-doc Research Associate at the Center for Public Economics, Getulio Vargas Foundation. Contact:
§Professor of the Department of Political Science, University of Sao Paulo and the Sao Paulo School of
Economics, Getulio Vargas Foundation. Contact: [email protected].
1
Introduction
The importance of money in elections is a hallmark of contemporary democracies. Money has a prominent role in elections, as campaign costs have increased dramatically across the world (Scarrow, 2007). Campaign resources grant candidates strategic advantages, and in places with less ideological attachment, they are crucial to convincing voters. Politicians with extra funds can then have a considerable advantage over others (Samuels, 2001b; Speck and Mancuso, 2014). However, most of the papers on money and politics focus either on the electoral process (Jacobson, 1978; Gelman and King, 1990; Hainmueller and Kern, 2008; Fink, 2012) or on the governing stage (Besley and Persson, 2009; d’Agostino et al., 2016; Rubin, 2019). This focus narrows down the richness of the interplay between money and politics.
In this paper, we remedy this gap by studying the money and elections nexus as a full cycle: money starts influence at the beginning of the election when politicians promise services to firms in exchange of campaign donations (Boas et al., 2014). Upon winning the election, politicians may or may not reward firms with public procurement and contracts. After the governing stage, a new electoral cycle starts, and firms have again the opportunity to give for campaigns, either contributing to incumbents or challengers. Elections take place and the full cycle restarts, as most democracies in the world have regular electoral cycles.
Although the election-government cycle is well defined, it is difficult to predict how politicians and real-world conditions will affect the governments. On the one hand, politicians might be rent seekers, oriented only toward short-term office perks, instead of trying to build a successful political career (Kitschelt, 2000; Tollison, 2004). In this case, they may choose to exert no effort to provide services. On the other hand, candidates could form incorrect beliefs about the resources available for service provision (Brender and Drazen, 2008). Once in office, they may realize that they cannot invest in services the amount previously planned before the elections. In both scenarios, voters may not obtain the same amount of public goods
and firms that donated for the politicians’ campaigns will not receive back their donations in terms of contracts and procurement. This could motivate both voters and firms to punish the incumbent politicians in their next election, explaining the incumbency disadvantage and why incumbents receive fewer campaign donations than challengers in developing countries. To test these ideas, we leverage quasi-experimental evidence using a close-election re-gression discontinuity design in Brazilian municipalities, between 2000 and 2012. We show that incumbents receive 4.70% less electoral donations than challengers, and have 8.14% less chance of getting reelected. To understand the role of investment capacity, we look at the ratio between the personnel expenditure and the municipal revenue. We divide the sample into quantiles, median and quartiles, exploiting the heterogeneous effects in the regression discontinuity design. Dividing in quantiles has the advantage of splitting the power equally among the categories. We find that in municipalities below the median in investment ca-pacity, mayors receive 9.68% fewer campaign contributions and have 14.36% less chance of being reelected. Above the median in both indicators, the campaign contributions and the incumbency disadvantage becomes insignificant. The results also hold for quartiles, with the advantage of providing a clearer picture of the relationship. Therefore, investment capacity connects the money-in-elections with the money-in-government, explaining how investments while in government affect the electoral marketplace.
2
Investment capacity in the electoral marketplace
Most of the public service provision depends on an interaction between bureaucracy, firms, and politicians. To obtain electoral support, politicians make pre-electoral informal agree-ments with firms (Arvate et al., 2013). In exchange to campaign donations, politicians offer to firms privileged access to government contracts in the post-election period (Boas et al., 2014; Fonseca, 2017). However, the politician’s ability to make their promises credible de-pends on government investment capacity (Samuels, 2001a). Thus, investment capacity is
directly connected with the electoral marketplace.
To clarify, consider the following theoretical argument on the role of investment capacity in the electoral cycle. Suppose a polity with two types of politicians: career politicians, that want to build a political career and opportunistic politicians that want to harness the advantages of the public office, paying little effort for service provision. These types are the politicians’ private information, but they reflect in different office behavior: in an in-stitutional setting where there are only two terms (or any limited amount of terms), career politicians will try to provide the maximum amount of services, regardless of being lame-ducks. However, opportunistic politicians will only provide services enough to get reelected in their first terms, providing no services in their lame-duck terms. Firms, on the other hand, want to donate for campaigns, but they expect to receive contracts and procurement in the future, what needs a steady service provision. Therefore, firms prefer career politicians, but they cannot credibly signal their type in the first term. In this setting, more invest-ment capacity increases the firms’ benefits in the first term, compensating for an eventual opportunistic politician in the second term. Thus, in municipalities with lower investment capacity, lame-duck politicians will receive fewer campaign donations from firms and will tend to be disadvantaged in their reelection. However, higher investment capacity makes the first term so lucrative, that compensates a risky donation for lame-duck politicians.
The Brazilian context provides an ideal ground for empirically testing the effects of in-vestment capacity on the electoral marketplace. Brazil is comprised of over five thousand municipalities, each presenting a wide variation across the country. The federalist arrange-ment concentrates most of the taxation in the federal governarrange-ment, making transfers from the central government relevant to the local level service provision (Arretche, 2010). Mu-nicipalities only collect five percent of the total tax share, but these revenues are essential to investments in infrastructure, such as paved streets, schools, hospitals, and other con-struction projects. Also, until 2015, before a decision by the Federal Supreme Court which
banned market campaigns donations, firms were the leading donors in elections. From 1994 to 2016, on average, 85% of the money used by politicians in the Brazilian elections came from firms’ campaign donations, while this percentage is 65% in the Argentinian and 45% in the Chilean cases (Speck, 2016).
3
Empirical Strategy
In this section, we discuss the data sources, the estimation strategy, and the validity checks for the design. First, we use three primary data sources. We collect the vote shares, re-election data, mayoral party labels, and campaign donations from the Brazilian Superior Electoral Tribunal (TSE). This court is responsible for the elections in Brazil. They keep website records for elections since 1946, with campaign donations and candidates’ income data since 1994. Our dataset is comprised of four elections, spanning from 2000 to 2012. In this paper, we considered only municipalities with less than 200 thousand registered voters, with are the municipalities without a runoff in the mayoral elections. From the Superior Elec-toral Tribunal candidates’ database, we also consider the candidates’ age, gender, education, employment sector, and party labels.
We collect the investment capacity data from the Brazilian Institute of Applied Economics (IPEA), that have municipal fiscal indicators from 1985 to 2011. We compute the ratio between personnel expenditure and revenue. An increase in this indicator means that mayors have less disposable income to invest in service provision. We look into the inverse of this ratio, to make an increase in this indicator to represent increasing investment capacity.
As robustness to the investment capacity indicator, we also consider in the Online Ap-pendix an indicator of municipal liquidity, computed by the Rio de Janeiro Industrial Feder-ation (Firjan). The reader can check that our results are robust to changes in the investment capacity indicator. The final database has 31,912 observations.
municipalities in a given year. As candidates are unable to manipulate the vote share they will receive precisely, the electoral winner and loser candidates become an as-if exogenous variation, the closer the vote share results. This strategy is known as close election regression discontinuity design and helps us to identify the effects of incumbency on future campaign donations and reelection rates (Imbens and Lemieux, 2008; Lee, 2008). Our running variable that assigns the treatment or control status is the vote margin difference between the two most voted candidates. To take care of the endogeneity in the decision to run again for office,
we use Magalh˜aes (2015) strategy, that guarantees that we measure the outcome effects,
even when rerunning is not widespread. Hence, we estimate the incumbency effect on the probability of receiving campaign finance resources from firms unconditional to whether a candidate is indeed rerunning in the next election.
We use a local-linear polynomial estimator with a triangular kernel weight distance from the cutoff, and we compute the optimal bandwidth using both the Calonico et al. (2014) Mean-Squared error robust data-driven optimal bandwidth. We cluster all standard errors at the municipal-year, as the close election source of randomness occurs in this level.
Finally, the validity of our causal claim relies on two assumptions, which we show that hold in the Online Appendix. First, all the pre-treatment covariates (candidate parties, candidates professions, gender, and age), are smooth around the discontinuity. Second, to show that there are no signs of manipulation, which would mean fraud in this context, we use McCrary (2008) and Cattaneo et al. (2018) manipulation estimators.
4
Investment capacity, campaign donations, and the
incumbency disadvantage
We study three outcomes: the chances of being elected before (as a placebo test), the recipiency of campaign donations, and a reelection indicator. We disaggregate the analysis
using the inverse of the budget share spend with personnel, as an indicator of investment capacity.
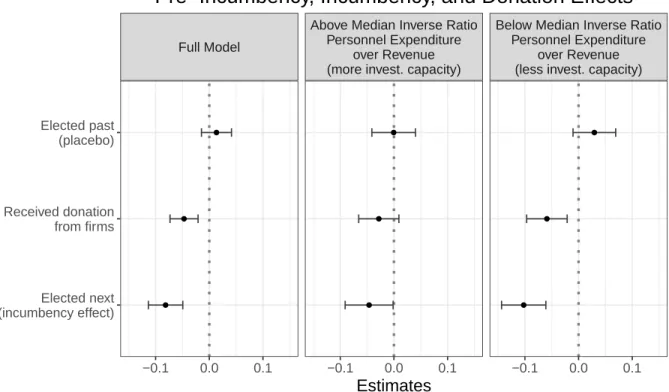
The close election strategy is efficient to study the effects of winning an election on the next electoral term. However, it is insufficient to study the heterogeneous effects that investment capacity has over incumbency. To solve this problem, we rerun the regression discontinuity analysis, split the sample into the median and quartiles of investment capacity. Splitting the sample between the median or the quartiles has two advantages: first, the brackets represent low versus higher investment capacity. Second, cuts are arbitrary, and they split the sample into size equally powered. This strategy allows us to investigate the heterogeneous effect of fiscal capacity on campaign donations and incumbency. Figure 1 presents the coefficients in the RDD models for the full data, and then splitting by median of investment capacity. ● ● ● ● ● ● ● ● ● Full Model
Above Median Inverse Ratio Personnel Expenditure
over Revenue (more invest. capacity)
Below Median Inverse Ratio Personnel Expenditure
over Revenue (less invest. capacity)
−0.1 0.0 0.1 −0.1 0.0 0.1 −0.1 0.0 0.1 Elected next (incumbency effect) Received donation from firms Elected past (placebo) Estimates
Pre−Incumbency, Incumbency, and Donation Effects
Municipal−year level cluster−robust SEs − 95% CI Figure 1: Investment capacity, campaign donations, and incumbency: main results
erogeneous effect in investment capacity. The first row has the placebo tests, where we investigate the incumbency effects on the previous and unrelated elections. As expected for a placebo test, all models were statistically insignificant.
The second row estimates the effects of incumbency on campaign donations in the re-election contest. If our theoretical argument is correct, the incumbents should receive fewer campaign donations in municipalities with lower investment capacity. In the full dataset, the chances of receiving donations drop 0.047 (p-value < 0.001). When we split the sample by median of investment capacity, incumbents in municipalities above the investment capacity median in inverse expenditure over revenue decrease the chance of receiving donations by 0.028 (p-value = 0.078). Below the median investment capacity, the campaign donations decrease considerably, by 0.059 (p-value < 0.001) fewer donations (around 6% less). Thus, in municipalities with low investment capacity, incumbent mayors tend to receive twice as fewer campaign donations.
The last row presents the incumbency disadvantage, measured by looking into the can-didates that were reelected or not in the coming election. In the full dataset, the chances of being reelected drop by 0.081 (p-value < 0.001). This result corroborates the incumbency disadvantage findings by (Klaˇsnja and Titiunik, 2017). When we split the sample by median of investment capacity, mayors in municipalities above the investment capacity median have 0.046 (p-value = 0.016) less chance of getting reelected. Below the median investment capac-ity, the incumbency disadvantage increases considerably, to 0.102 (p-value < 0.001). These results represent a drop in reelection rates of 2.21 times more incumbency disadvantage in municipalities with low investment capacity.
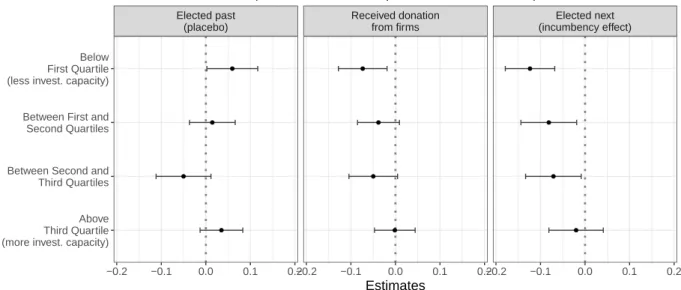
One critical point of our estimates is their reliance on the median as an arbitrary thresh-old. If our theoretical argument is correct, every subsample that is increasing in investment capacity should present changes in donations and incumbency disadvantage similar to the last results. To test for this possibility, we split the sample by quartiles of the investment
capacity. Figure 2 present the results. ● ● ● ● ● ● ● ● ● ● ● ● Elected past (placebo) Received donation from firms Elected next (incumbency effect) −0.2 −0.1 0.0 0.1 0.2−0.2 −0.1 0.0 0.1 0.2−0.2 −0.1 0.0 0.1 0.2 Above Third Quartile (more invest. capacity) Between Second and Third Quartiles Between First and Second Quartiles Below First Quartile (less invest. capacity)
Estimates
(Inverse Personnel Expenditure Over Revenue)
Investment Capacity effects by Quartile
Municipal−year level cluster−robust SEs − 95% CI
Figure 2: Investment capacity, campaign donations, and incumbency: main results by quar-tiles
Figure 2 shows that for low investment capacity, the results are significant and they show a monotonous relationship for both donations and incumbency disadvantage. Investment capacity impacts profoundly in the electoral marketplace: conditional on win an election, candidates that were ex-ante similar, will then have a lower chance of receiving donations and a lower chance of reelection.
In the Online companion, we test the robustness of the findings. We run five types of complementary models. First, the same result for different measures of investment capacity, to check whether the results are consistent across different measures of the same phenomenon. Second, we add the pre-treatment covariates as controls and rerun the main regressions. Third, we run a sensitivity test for varying the threshold using placebo thresholds. Fourth, we run a sensitivity analysis for the bandwidth size, ranging from 50% to 200% of the optimal bandwidth. Finally, we run a sensitivity analysis for the choice of the polynomial degree. The results remain robust to these specifications.
5
Conclusion
Money has a broader influence in democracies, going beyond the electoral period. Closer to the election, money correlates with the politicians’ electoral chances. After the election, the government success depends on the capacity to government investment in public service pro-vision. These dynamics affect the electoral perspectives of incumbents, and we may expect it to correlate with the politicians’ efforts while in office. In this sense, investment (in)capacity influences the electoral marketplace by lowering incumbents resources and chances of getting reelected.
We contribute with three strands of the literature and have a profound implication for developing democracies. First, our argument complements the previous research on incum-bency disadvantage in Brazil and other developing countries. The literature identifies two primary sources of incumbency disadvantage: voters’ accountability and service provision (Roberts, 2008; Uppal, 2009), and institutional influences on elections and politician’s in-centives (Klaˇsnja and Titiunik, 2017). This paper adds up to this literature by tying the accountability and service provision literature with investment capacity.
Second, although papers explored the interplay between investment capacity and elec-tions, the micro-foundations and the effects were sparse. Schiumerini (2015) shows that less financial capacity may decrease the voters’ support, as the state invests less in infrastructure. We also posit that it affects the politicians’ ability to raise campaign contributions. Boas et al. (2014) showed that firms donating for a federal deputy aligned with the incumbent government in Brazil receive on average 14 times the donation in government contracts. In Brazil, the money spending on campaigns is the main predictor of electoral success (Samuels, 2001b; Speck and Mancuso, 2014). Our work adds up to the relationship between firms and politicians, showing that the electoral consequences of incumbency depend on the governing conditions faced by politicians.
president receive more transfers for infrastructure provision (Brollo and Nannicini, 2012; Bueno, 2018). Investment capacity is a powerful strategy to undermine the challengers’ electoral perspectives. Additionally, winning the municipal elections is crucial for success in the national elections (Novaes, 2018). In the gubernatorial and federal levels, politicians and parties that understood this relationship attempted to provide the most resources, to increase the reelection perspective of their candidates.
Finally, in low-income countries, with crippled strength to defer income in order to build strong financial capability institutions, the electoral results may prove more volatile than oth-erwise expected. Moreover, patronage and clientelism in developing countries usually make the investment capacity even worse (Keefer, 2007; Robinson and Verdier, 2013). Rewarding campaign operatives or voters with monetary perks lowers the local disposable resources for investing in public services. On extreme cases, this could incentivize politicians not to invest in public services even in their first term: if all politicians expect to be out of office after their first term, they will not make costly effort to provide services. In equilibrium, this should lower the public services received by the population, and increase the expected rent extraction and corruption by rogue politicians. Moreover, this institutional arrangement may discourage high-quality politicians, selecting people that want to predate the public resources, reinforcing the cycle of low-quality policies.
References
Arretche, M. (2010). Federalism, bicameralism, and institutional change: general trends and one case-study.
Brazilian Political Science Review 5 (SE), 10–31.
Arvate, P. R., K. Barbosa, and E. Fuzitani (2013). Campaign donation and government contracts in brazilian states. unpublished.
Besley, T. and T. Persson (2009). The origins of state capacity: Property rights, taxation, and politics.
American Economic Review 99 (4), 1218–44.
Boas, T. C., F. D. Hidalgo, and N. P. Richardson (2014). The spoils of victory: campaign donations and government contracts in brazil. The Journal of Politics 76 (02), 415–429.
Brender, A. and A. Drazen (2008). How do budget deficits and economic growth affect reelection prospects? evidence from a large panel of countries. American Economic Review 98 (5), 2203–20.
Brollo, F. and T. Nannicini (2012). Tying your enemy’s hands in close races: the politics of federal transfers in brazil. American Political Science Review 106 (04), 742–761.
Bueno, N. S. (2018). Bypassing the enemy: Distributive politics, credit claiming, and nonstate organizations in brazil. Comparative Political Studies 51 (3), 304–340.
Calonico, S., M. D. Cattaneo, and R. Titiunik (2014). Robust nonparametric confidence intervals for
regression-discontinuity designs. Econometrica 82 (6), 2295–2326.
Cattaneo, M. D., M. Jansson, and X. Ma (2018). Simple local polynomial density estimators. arXiv preprint arXiv:1811.11512.
d’Agostino, G., J. P. Dunne, and L. Pieroni (2016). Government spending, corruption and economic growth.
World Development 84, 190–205.
Fink, A. (2012). The effects of party campaign spending under proportional representation: Evidence from germany. European Journal of Political Economy 28 (4), 574–592.
Fonseca, T. d. N. (2017). Doa¸c˜oes de campanha implicam em retornos contratuais futuros? uma an´alise dos
valores recebidos por empresas antes e ap´os as elei¸c˜oes. Revista de Sociologia e Pol´ıtica 25 (61), 31–49.
Gelman, A. and G. King (1990). Estimating incumbency advantage without bias. American Journal of
Political Science 34 (4), 1142–1164.
Hainmueller, J. and H. Kern (2008). Incumbency as a source of spillover effects in mixed electoral systems: Evidence from a regression-discontinuity design. Electoral Studies 27 (2), 213–227.
Imbens, G. W. and T. Lemieux (2008). Regression discontinuity designs: A guide to practice. Journal of
Econometrics 142 (2), 615–635.
Jacobson, G. C. (1978). The effects of campaign spending in congressional elections. American Political
Science Review 72 (02), 469–491.
Keefer, P. (2007). Clientelism, credibility, and the policy choices of young democracies. American Journal
of Political Science 51 (4), 804–821.
Kitschelt, H. (2000). Linkages between citizens and politicians in democratic polities. Comparative Political
Studies 33 (6-7), 845–879.
Klaˇsnja, M. and R. Titiunik (2017). The incumbency curse: weak parties, term limits, and unfulfilled
Lee, D. S. (2008). Randomized experiments from non-random selection in us house elections. Journal of
Econometrics 142 (2), 675–697.
Magalh˜aes, L. (2015). Incumbency effects in a comparative perspective: Evidence from brazilian mayoral
elections. Political Analysis 23 (1), 113–126.
McCrary, J. (2008). Manipulation of the running variable in the regression discontinuity design: A density test. Journal of Econometrics 142 (2), 698–714.
Novaes, L. M. (2018). Disloyal brokers and weak parties. American Journal of Political Science 62 (1), 84–98. Roberts, A. (2008). Hyperaccountability: economic voting in central and eastern europe. Electoral
stud-ies 27 (3), 533–546.
Robinson, J. A. and T. Verdier (2013). The political economy of clientelism. The Scandinavian Journal of
Economics 115 (2), 260–291.
Rubin, I. S. (2019). The politics of public budgeting: Getting and spending, borrowing and balancing. CQ Press.
Samuels, D. (2001a). Does money matter? credible commitments and campaign finance in new democracies: theory and evidence from brazil. Comparative Politics 34 (1), 23–42.
Samuels, D. (2001b). Money, elections, and democracy in brazil. Latin American Politics and Society 43 (2), 27–48.
Scarrow, S. E. (2007). Political finance in comparative perspective. Annual Review of Political Science 10, 193–210.
Schiumerini, L. (2015). Accountability and incumbency effects in developing democracies: Evidence from brazil. unpublished.
Speck, B. W. (2016). Influenciar as elei¸c˜oes ou garantir acesso aos eleitos?: O dilema das empresas que
financiam campanhas eleitorais. Novos Estudos 1 (104), 39–59.
Speck, B. W. and W. P. Mancuso (2014). A study on the impact of campaign finance, political capital and gender on electoral performance. Brazilian Political Science Review 8 (1), 34–57.
Tollison, R. D. (2004). Rent seeking. In The Encyclopedia of Public Choice, pp. 820–824. Springer.
Uppal, Y. (2009). The disadvantaged incumbents: estimating incumbency effects in indian state legislatures.
A
Appendix (print)
A.1
Online Supplemental Materials Content
In the online appendix, we present the following complementary information: 1. A simple model on elections, government, and investment capacity. 2. A description of the budget process in Brazilian municipalities. 3. The data sources and summary statistics.
4. An in-depth discussion about the identification strategy.
5. RD validity tests: covariate smoothness and manipulation tests. 6. The main results in the paper, in table format.
7. Robustness to the addition of covariates. 8. Sensitivity to placebo cutoffs.
9. Robustness to bandwidth size.
10. Robustness to the RDD polynomial degree.
The URL to access the Appendix is REDACTED FOR PEER REVIEW.
A.2
Replication Materials
Online Supplemental Materials
Investment Capacity and the Electoral Marketplace:
Evidence from Brazil.
Victor Ara´
ujo
∗Maur´ıcio Izumi
†Fernando Limongi
‡Umberto Mignozzetti
§Contents
A A simple model on elections, government, and investment capacity 3
B A description of the budget process in Brazilian municipalities 8
C Data sources 9
D Summary Statistics 11
E Identification Strategy 13
F Covariate Smoothness and Threshold Manipulation Tests 15
F.1 Manipulation tests . . . 15
F.2 Covariate Smoothness . . . 16
G Main results in Table format 18
∗Ph.D. Candidate, Chair of Political Economy and Development, University of Z¨urich. Contact: victor.
†Post-doc Research Associate at the Center for Public Economics, Getulio Vargas Foundation. Contact:
‡Professor of the Department of Political Science, University of Sao Paulo and the Sao Paulo School of
Economics, Getulio Vargas Foundation. Contact: [email protected].
§Corresponding author. Professor at the School of International Relations, Getulio Vargas Foundation.
H Main results with all covariates in the models as controls 20
I Robustness to placebo cutoffs 21
J Sensitivity to bandwidth selection 23
K Sensitivity to polynomial degree 24
L Heterogeneous effects by deciles of investment capacity 25
A
A simple model on elections, government, and
in-vestment capacity
Let a strategic interaction between a politician, a firm, and a mass one of voters, that are
responsive only to campaign expenditures.1.
In line with Klaˇsnja (2015) and inspired by the findings of Klaˇsnja and Titiunik (2017),
we consider that there are two types of politicians: rent-seekers and career concerned.2 The
difference between them is that a career concerned politician wants to invest more in public services, as she knows that her relationship with voters and firms will span for a longer time than a rent-seeker politician. The rent-seeker politician prefers not to invest for at least three reasons. First, she wants to pocket most of the money, and invest in public services is only attractive when she can add kickbacks to procurement. Second, if invest is costly, she may prefer to shirk and not spend any resources. Finally, her contact with voters and firms will shorter than the career politicians, and so, she prefers to makes the most out of her election regarding rent-seeking opportunities. These types are private information of the individual politicians.
Firms, on the other hand, look for an opportunity to provide services for the government as a for-profit enterprise. Firms then contribute to campaigns expecting to be compensated by the politicians by getting contracts and procurement. If they knew the politician’s types, they would only contribute to long-term oriented politicians, as these politicians would keep investing in services, regardless of term limits. However, firms do not know whether the politician is a rent-seeker or a long-term oriented one.
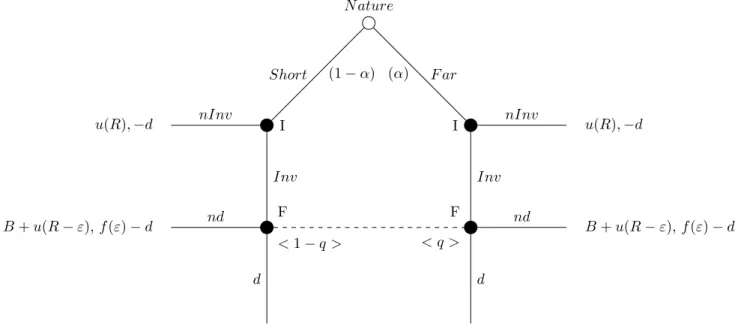
For the interaction between these two players, we consider a game with the following sequential time-line:
1. Nature draws the type of the elected incumbent politician from a common-knowledge distribution.
The term ends, and the re-election follows.
3. Upon being hired or not, firms then decide whether to donate or not for the incumbents’ re-election contest.
4. If firms donate, then she wins the reelection, else, she retires. 5. Payoffs are realized, and the game ends.
Figure 1 depicts a simplified version of our argument as a simple signaling game. N ature I u(R), −d nInv F < 1 − q > B + u(R − ε), f (ε) − d nd B + u(R − ε) + u(R), f (ε) − 2d d Inv (1 − α) Short I nInv u(R), −d F < q > B + u(R − ε), f (ε) − d nd B + 2u(R − ε) + L, 2(f (ε) − d) d Inv (α) F ar
Figure 1: Extensive-Form Game for the politician-firm strategic interaction
We assume that mayors, upon taking office, have R > 0 resources to invest in public services. They then decide whether to pocket the investments, or they can proceed and
hire the firms, paying R for its services.3 As the Figure 1 suggest, if the politician does
not invest any resources in public services, the Firm does not donate, and she is out of office, receiving B, which is the benefit from holding office once, and R, which represents the pocketed resources.
Upon observing an investment, firms provide the public services, and then, at the follow-ing electoral period, they decide again whether they want to donate an amount d > 0 for the
incumbent, or not (d = 0). As we are assuming that voters are only responsive for campaign expenditures, receiving more resources than the challenger would increase the incumbent’s chances of getting reelected.
The central tension in the model is that firms only want to donate for far-sighted politi-cians. Firms know that these politicians will hire them regardless of being lame-ducks, as they want to advance their political career. However, if they donate for short-sighted, they will not see the public investment in the second turn. This because the short-sighted politi-cians will pocket the money, and if they invest in the first term, it is just because they expect to pocket the resources in the second term.
Let q the belief that the Firms hold regarding the firm being far-sighted. The firm will donate for the incumbent if
E[d, q] = q[2(R − d)] + (1 − q)[R − 2d] ≥ R − d = E(nd, q) Solving this inequality leads us to the following threshold:
q ≥ d
R = ˜q
˜
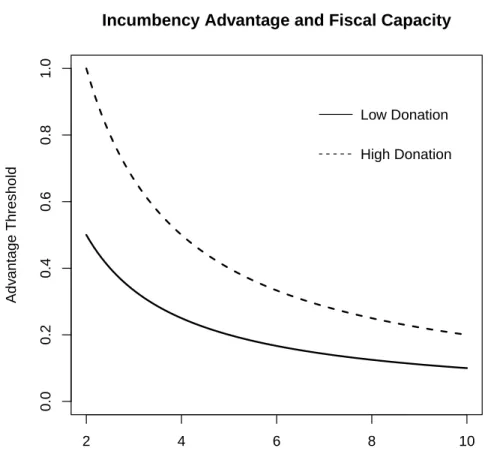
q is the cutoff that limits the incentives for donation. If we study a pooling equilibrium, where both candidates invest in public services, it becomes easier to this equilibrium be
theoretically sustainable, the smaller the ˜q. Figure 2 summarizes the incentives.
The model has an equilibrium for pooling strategies, with incumbents always investing
when α ≥ ˜q and never investing when α < ˜q. There is no equilibrium in separating strategies.
To summarize our findings we have the following proposition.
Proposition 1. If the the municipal investment capacity increases, then the likelihood of
receiving a donation from the firm also increases.
2 4 6 8 10 0.0 0.2 0.4 0.6 0.8 1.0
Incumbency Advantage and Fiscal Capacity
Municipality Fiscal Capacity
Adv
antage Threshold
Low Donation High Donation
Figure 2: Investment Capacity and Donation Thresholds
Corollary 1. If the municipal investment capacity increases, then the chance of getting
reelected increase.
The corollary follows from the fact that increasing the campaign resources also increases the chance that incumbents will spend more than challengers. This increases their reelection prospective when the electorate is impressionable.
Note that this simple model can be extended to add randomness in the investment capacity, or in the voter’s utility. In the first case, we could make R a random draw from a continuous distribution, with finite support. The strategy from the politicians’ perspective would be to invest R when the politician is career concerned. When the politician is rent-seeker, she invests a fraction of R, enough to make the firm indifferent between donating or not. The optimal donation strategy would be to donate with an increasing probability,
conditional on the amount of resources received.
From the voter’s perspective, we could add public service provision concern or ideological voting. In the first case, the adverse electoral effects of investment capacity would come from two places: the campaign investments and the low service provision. Adding ideology would not change things substantially, as politicians would set their ideal policies at the median.
B
A description of the budget process in Brazilian
mu-nicipalities
The Brazilian federalism is commonly defined as a centripetal political union arrange (Ar-retche, 2010; Beramendi, 2012). First, municipalities are required by law to implement public policies in areas such as health and education according to the federal government specific guidelines. Second, most of the local level taxes are collected by the federal government and then redistributed among states and municipalities. Third, municipalities have low discretion to create taxes and contributions.
The decision on the allocation of the budget at the local level is composed of two steps. First, the executive branch defines the priorities based on the municipalities needs and the resources available. Second, politicians in the city council vote the executive budget spending proposal. Since the government coalitions with majorities is a hallmark of the Brazilian local politics (Santos, 2013), it is implausible that the final budget proposal does not reflect the executive branch preferences. However, the investment capacity of municipalities is limited. The Brazilian municipalities heavily depend on federal government transfers due to their low fiscal capacity. For instance, in 2015, 92% of municipalities have more than 70% of their
budget composed by federal transfers4. To mitigate the problem of low investment capacity
of municipalities, the Brazilian Congress created a rule to limited municipalities spending. The law of fiscal responsibility (Lei de Responsabilidade Fiscal), implemented in 2000, sets maximum limits (54%) on public budget levels for personnel payrolls, which creates incentives to mayors prioritize investments in infrastructure provision. However, municipalities still facing challenges to fulfill this expectation. In 2015, on average, municipalities spent only 9% of their budget with infrastructure provision. By contrast, they spent 54% of their budget
C
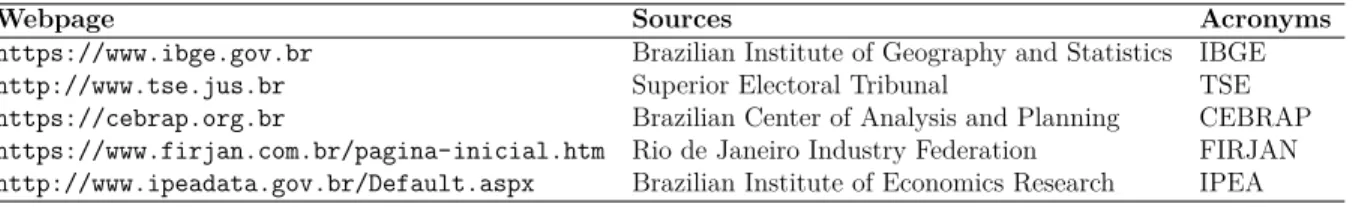
Data sources
We collect data on Brazilian elections and municipal investment capacity from 2000 to 2012. Follows below the data sources with the link for helping with the replication of these results.
Table 1: Data Sources
Webpage Sources Acronyms
https://www.ibge.gov.br Brazilian Institute of Geography and Statistics IBGE http://www.tse.jus.br Superior Electoral Tribunal TSE https://cebrap.org.br Brazilian Center of Analysis and Planning CEBRAP https://www.firjan.com.br/pagina-inicial.htm Rio de Janeiro Industry Federation FIRJAN http://www.ipeadata.gov.br/Default.aspx Brazilian Institute of Economics Research IPEA
Variable Description Original Source
Manipulation Observations
electionMunic Mayoral election year and TSE code for municipalities (for clustering purposes).
TSE Merging the variable ”election” with the variable ”munCodeTSE”.
election Mayoral election year. TSE None Years 2000, 2004, and 2008.
This means that the elec-tions considered are the 2004, 2008, and 2012.
munCodeTSE Superior Electoral Tribunal (TSE) municipal codes. TSE None
munCodeIBGE Brazilian Institute of Geography and Statistics (IBGE) 6-digit municipal codes.
IBGE None
candName Candidate’s name. TSE None
state State 2-character code. TSE None
munName Municipality name. TSE None
candParty Brazilian Acronym for the Candidate’s political party. TSE None
elecNext Candidate’s reelection in year t+4 (dummy). TSE None
campaignResources Candidate’s total campaign resources in year t+4. TSE None
propVot Vote margin between the winner and the runner-up
(run-ning variable).
TSE Computed from the TSE vote counting for Winner and Runner-up Candidates.
elected Election winner (dummy). TSE None
elecBefore Elected before in t-4 (dummy). TSE None
donationRecipient Candidate received funds (dummy). TSE None
partyPT Municipality with a candidate from PT (dummy). TSE Computed from TSE Candidate party Acronym.
partyPSDB Municipality with a candidate from PSDB (dummy). TSE Computed from TSE Candidate party Acronym.
partyDEM Municipality with a candidate from DEM (dummy). TSE Computed from TSE Candidate party Acronym.
partyPP Municipality with a candidate from PP (dummy). TSE Computed from TSE Candidate party Acronym.
partyPTB Municipality with a candidate from PTB (dummy). TSE Computed from TSE Candidate party Acronym.
partyPDT Municipality with a candidate from PDT (dummy). TSE Computed from TSE Candidate party Acronym.
partyPSB Municipality with a candidate from PSB (dummy). TSE Computed from TSE Candidate party Acronym.
femaleCand Female (dummy). TSE Computed from TSE Candidate information.
candMD Physician (dummy). TSE Computed from TSE Candidate information.
candBusiness Businessman(dummy). TSE Computed from TSE Candidate information.
candLawyer Lawyer (dummy). TSE Computed from TSE Candidate information.
candCollegeDegree College degree (dummy). TSE Computed from TSE Candidate information.
aboveMedianAge Candidate above the median age (dummy). TSE Computed from TSE Candidate information.
incAndChalGov Municipality with an incumbent and the challengers from parties in the Federal government coalition (dummy).
Cebrap and TSE
Computed considering the party that composed the Fed-eral Coalition at the election year.
incAndChalOposition Municipality with an incumbent and the challengers from parties in the Federal government opposition coalition (dummy).
Cebrap and TSE
Computed considering the party that composed the Fed-eral Coalition at the election year.
incGovChalOpos Municipality with an incumbent in the Federal govern-ment coalition party and challenger in the opposition party (dummy).
Cebrap and TSE
Computed considering the party that composed the Fed-eral Coalition at the election year.
incOposChalGov Municipality with an incumbent in the opposition party and a challenger in a federal government coalition party (dummy).
Cebrap and TSE
Computed considering the party that composed the Fed-eral Coalition at the election year.
InvExpPerOverRev One minus the proportion of the revenue spent with per-sonnel: active and pensions.
IPEAData Ratio between Municipal Personnel Expenditure and Municipal Revenue.
Data averaged for four year time-span. The year 2012 is absent from the dataset, so we consider the period 2008 to 2011 in the last election. aboveMedInvExpPerOverRev Above Median of the inverse proportion of the revenue
spent with personnel (dummy).
IPEAData Dummy equals 1 if above the median of ”InvExpPerOver-Rev”.
InvQuartileExpPerOverRev Quartile index of inverse proportion of revenue spend with personnel.
IPEAData Position of the quartile, ranging from 1 (0 to 1st quar-tile), to 4 (third quartile) in the ratio between municipal personnel expenditure and municipal revenue. frlClassification Classification of the Municipal Fiscal Healthy based on
the Brazilian Fiscal Responsibility Law (Complementary Law 101 - 05/04/2000).
IPEAData If the ratio between personnel expenditure and revenue is above 0.54 the state is considered ”SEVERE”, and the municipality may be punished; between 0.514 and 0.54, the municipality is in the ”CRITICAL” zone; if the expenditure with personnel is between 0.4874 and 0.514, the municipal is in ”ALERT”; below 0.4874 the fiscal health is ”OK”.
Data averaged for four year timespan. The year 2012 is absent from the dataset, so we consider the period 2008 to 2011 in the last election.
firjLiqIndex Rio de Janeiro Industry Federation index of municipal liquidity.
FIRJAN None Data averaged from 2006,
when the index started, to 2012. Missing data for the first election.
aboveMedianFirjLiqIndex Above Median of Rio de Janeiro Industry Federation in-dex of municipal liquidity (dummy)
FIRJAN Dummy equals 1 if above the median for the variable ”firjLiqIndex”.
quartileFirjLiqIndex Quartile of the Rio de Janeiro Industry Federation index of municipal liquidity index.
FIRJAN Position of the quartile, ranging from 1 (0 to 1st quartile), to 4 (third quartile) in the FIRJAN liquidity index.
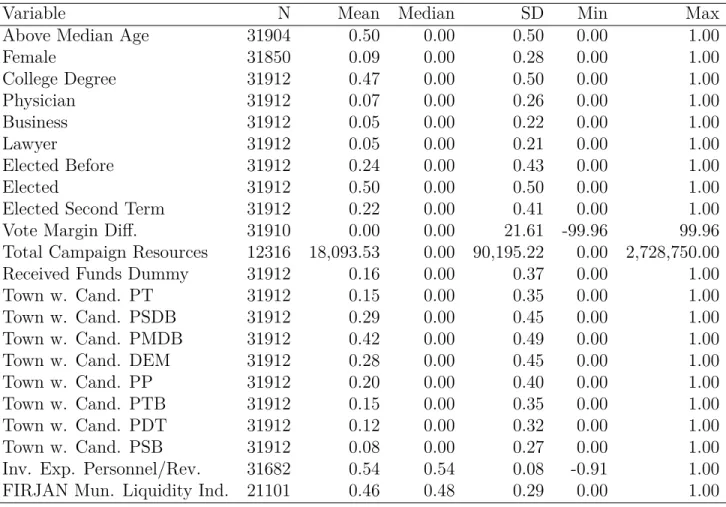
D
Summary Statistics
The summary statistics Table follows below.Variable N Mean Median SD Min Max
Above Median Age 31904 0.50 0.00 0.50 0.00 1.00
Female 31850 0.09 0.00 0.28 0.00 1.00 College Degree 31912 0.47 0.00 0.50 0.00 1.00 Physician 31912 0.07 0.00 0.26 0.00 1.00 Business 31912 0.05 0.00 0.22 0.00 1.00 Lawyer 31912 0.05 0.00 0.21 0.00 1.00 Elected Before 31912 0.24 0.00 0.43 0.00 1.00 Elected 31912 0.50 0.00 0.50 0.00 1.00
Elected Second Term 31912 0.22 0.00 0.41 0.00 1.00
Vote Margin Diff. 31910 0.00 0.00 21.61 -99.96 99.96
Total Campaign Resources 12316 18,093.53 0.00 90,195.22 0.00 2,728,750.00
Received Funds Dummy 31912 0.16 0.00 0.37 0.00 1.00
Town w. Cand. PT 31912 0.15 0.00 0.35 0.00 1.00
Town w. Cand. PSDB 31912 0.29 0.00 0.45 0.00 1.00
Town w. Cand. PMDB 31912 0.42 0.00 0.49 0.00 1.00
Town w. Cand. DEM 31912 0.28 0.00 0.45 0.00 1.00
Town w. Cand. PP 31912 0.20 0.00 0.40 0.00 1.00
Town w. Cand. PTB 31912 0.15 0.00 0.35 0.00 1.00
Town w. Cand. PDT 31912 0.12 0.00 0.32 0.00 1.00
Town w. Cand. PSB 31912 0.08 0.00 0.27 0.00 1.00
Inv. Exp. Personnel/Rev. 31682 0.54 0.54 0.08 -0.91 1.00
FIRJAN Mun. Liquidity Ind. 21101 0.46 0.48 0.29 0.00 1.00
Table 2: Descriptive Statistics
As we can see, most of the variables have the entire dataset with valid observations, besides the campaign resources. Campaign resources has more missing values because the candidate has to have received campaign donations in order to have some values to present. This variable is considerably post-treatment and is not used in our paper.
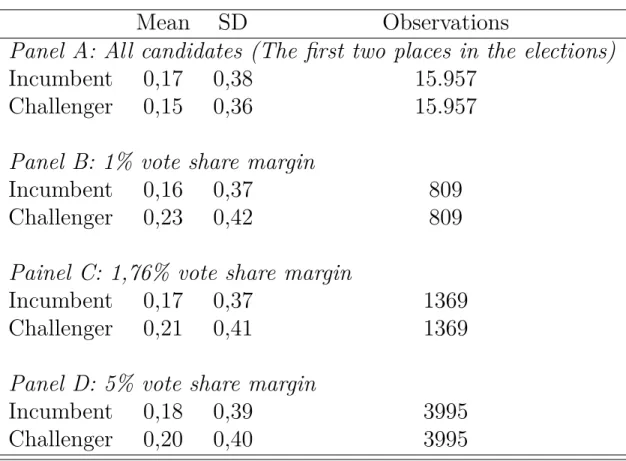
Moreover, Table 3 shows the summary statistics on the donation by the electoral status for three different bandwidth selection.
Table 3: Campaign finance candidate allocation descriptive statistics
Mean
SD
Observations
Panel A: All candidates (The first two places in the elections)
Incumbent
0,17
0,38
15.957
Challenger
0,15
0,36
15.957
Panel B: 1% vote share margin
Incumbent
0,16
0,37
809
Challenger
0,23
0,42
809
Painel C: 1,76% vote share margin
Incumbent
0,17
0,37
1369
Challenger
0,21
0,41
1369
Panel D: 5% vote share margin
Incumbent
0,18
0,39
3995
E
Identification Strategy
Electoral results depend heavily on the efforts and resources employed by the candidates. However, candidates are unable to manipulate the vote share they will receive precisely. Elections decided by a small vote margin have a strongly random component, and in some
of those elections, it was ex-ante unpredictable who would win the contest. Therefore,
candidates that lose by a small vote margin serve as a suitable account for those candidates who were elected by a small margin of votes (Imbens and Lemieux, 2008).
From 2000 to 2012, the RD running variable is the vote margin difference between the two most voted candidates. The differences between the electoral winners and immediate losers in consecutive terms, compared with the candidates that lost and then won or vice-versa, raises problems concerning the endogeneity of the reelection running decision (Song,
2018). Magalh˜aes (2015) addresses this selection problem proposing an outcome variable that
takes value one (1) if the candidate reruns and wins in the next election, but takes value zero (0) if the candidate loses or drops the race. With this strategy, we can measure the outcome effects even when rerunning is not widespread and the RD estimates the incumbency
effect on the probability of winning the next election, unconditional on rerunning. We
estimate the incumbency effect on the probability of receiving campaign finance resources from firms unconditional to the fact that the candidate is rerunning in the next election. To account for the fiscal capacity, we split the sample in the median, to measure whether municipalities with more fiscal capacity have better outcomes regarding firms’ donation and incumbency effects. We should interpret these results as heterogeneous effects in the donation-incumbency disadvantage estimates.
The regression discontinuity design uses the arbitrary change vote share, with a sharp discontinuity when is positive versus negative, meaning that the candidate wins or lose, to estimate the causal effect. We use a local-linear polynomial estimate with a triangular kernel distance to the cutoff weighting (putting more weight to cases closer to the cutoff) and
optimal bandwidth.6
The validity of our causal claim requires the empirical strategy to satisfy two assumptions: no endogenous manipulations, such as frauds, and the pre-treatment variables continuity. We show below that there are no sign of manipulations and all the pre-treatment variables such as the candidates’ gender, age, profession, and party labels, were not statistically significant. These results reinforce that our empirical strategy is solid.
F
Covariate Smoothness and Threshold Manipulation
Tests
F.1
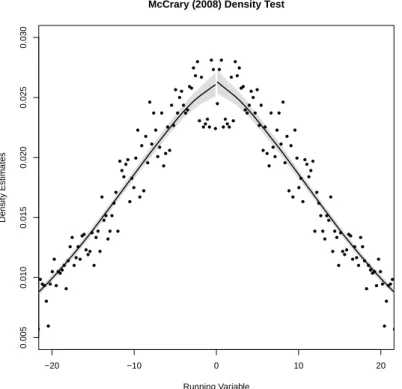
Manipulation tests
Manipulation, in the context of close-elections, means electoral fraud. Even though the Brazilian elections are reputed worldwide as fair and clean, we should test for the manipula-tion possibility. Figure 3 shows no sign of manipulamanipula-tion in the McCrary (2008) manipulamanipula-tion test. −20 −10 0 10 20 0.005 0.010 0.015 0.020 0.025 0.030
McCrary (2008) Density Test
Running Variable Density Estimates ● ● ● ●● ●● ● ● ●● ● ● ● ● ● ● ● ● ●●● ● ● ●● ● ● ● ● ● ● ●●● ● ● ● ● ● ● ● ● ● ●● ● ●● ● ● ● ● ● ● ●● ● ● ● ● ● ● ● ● ● ●● ● ● ● ● ● ● ● ● ● ● ● ● ● ● ● ● ● ● ● ● ● ● ● ● ● ● ● ● ●● ●● ● ● ● ● ● ●● ● ● ● ● ● ● ● ● ● ● ● ● ● ● ● ● ● ●● ● ● ● ● ● ● ● ● ● ● ● ● ● ● ● ● ● ● ● ● ● ● ● ● ● ● ● ● ● ● ● ● ● ● ● ● ● ● ● ● ● ● ● ● ● ● ● ● ● ● ●● ●● ● ● ● ● ● ● ● ● ● ● ●● ● ● ● ● ● ● ●● ● ● ●●● ● ● ● ● ● ● ● ●
Figure 3: McCrary (2008) test
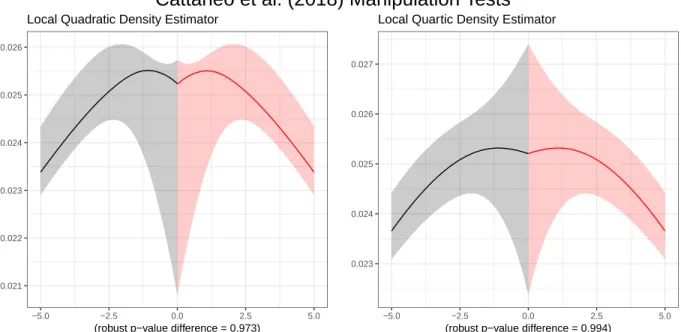
We also run the manipulation test using Cattaneo et al. (2018) package, using local quadratic and and local quartic polynomials. The results follow below and show no sign of manipulation.
0.021 0.022 0.023 0.024 0.025 0.026 −5.0 −2.5 0.0 2.5 5.0
(robust p−value difference = 0.973)
Local Quadratic Density Estimator
0.023 0.024 0.025 0.026 0.027 −5.0 −2.5 0.0 2.5 5.0
(robust p−value difference = 0.994)
Local Quartic Density Estimator
Cattaneo et al. (2018) Manipulation Tests
Figure 4: Cattaneo et al. (2018) test
F.2
Covariate Smoothness
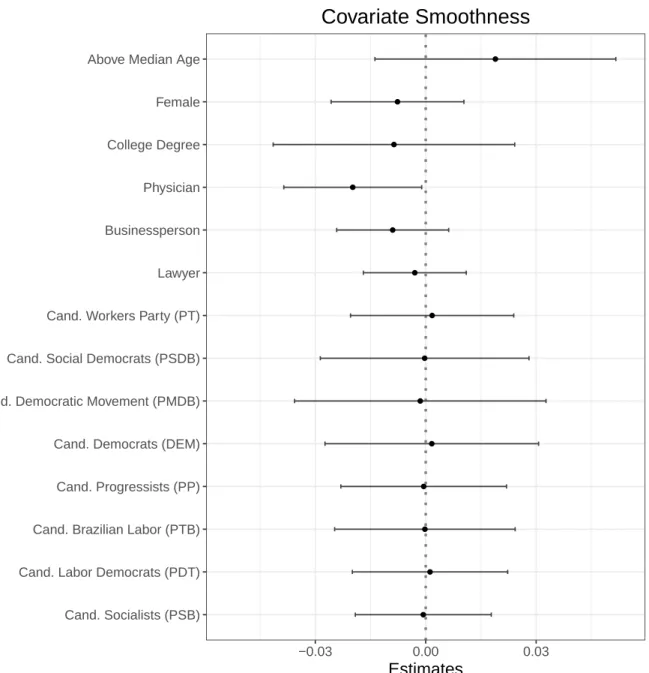
Figure 5 investigates the smoothness of covariates around the reelection threshold. As we can see, all but physician are smooth around the cutoff. This is expected, as we add many variables and with sensitivity of 0.05, at least one of them would become significant. In any case, below we add all variables into the main regression models, showing that there are no changes.
● ● ● ● ● ● ● ● ● ● ● ● ● ● Cand. Socialists (PSB) Cand. Labor Democrats (PDT) Cand. Brazilian Labor (PTB) Cand. Progressists (PP) Cand. Democrats (DEM) Cand. Democratic Movement (PMDB) Cand. Social Democrats (PSDB) Cand. Workers Party (PT) Lawyer Businessperson Physician College Degree Female Above Median Age
−0.03 0.00 0.03
Estimates
Covariate Smoothness
Municipal−year level cluster−robust SEs − 95% CI Figure 5: Covariate Smoothness
G
Main results in Table format
This section has the main regression models in table format. The first table represents Figure 1 of the main paper, while the second table represents Figure 2 of the main paper.
Level Dep. Var. Estimate SE
1 Full Model Elected past (placebo) 0.01 0.01
2 Full Model Received donation from firms -0.05 0.01
3 Full Model Elected next (incumbency effect) -0.08 0.02
4 Above Median Inverse Ratio
Per-sonnel Expenditure over Revenue (more invest. capacity)
Elected past (placebo) -0.00 0.02
5 Above Median Inverse Ratio
Per-sonnel Expenditure over Revenue (more invest. capacity)
Received donation from firms -0.03 0.02
6 Above Median Inverse Ratio
Per-sonnel Expenditure over Revenue (more invest. capacity)
Elected next (incumbency effect) -0.05 0.02
7 Below Median Inverse Ratio
Per-sonnel Expenditure over Revenue (less invest. capacity)
Elected past (placebo) 0.03 0.02
8 Below Median Inverse Ratio
Per-sonnel Expenditure over Revenue (less invest. capacity)
Received donation from firms -0.06 0.02
9 Below Median Inverse Ratio
Per-sonnel Expenditure over Revenue (less invest. capacity)
Elected next (incumbency effect) -0.10 0.02
10 Above Median FIRJAN Liquidity
Index (more invest. capacity)
Elected past (placebo) 0.02 0.02
11 Above Median FIRJAN Liquidity
Index (more invest. capacity)
Received donation from firms -0.02 0.02
12 Above Median FIRJAN Liquidity
Index (more invest. capacity)
Elected next (incumbency effect) 0.00 0.03
13 Below Median FIRJAN Liquidity
Index (less invest. capacity)
Elected past (placebo) 0.04 0.02
14 Below Median FIRJAN Liquidity
Index (less invest. capacity)
Received donation from firms -0.06 0.03
15 Below Median FIRJAN Liquidity
Index (less invest. capacity)
Elected next (incumbency effect) -0.09 0.03
Level Dep. Var. Estimate SE
1 Elected past (placebo) Below First Quartile (less invest.
capacity)
0.06 0.03
2 Elected past (placebo) Between First and Second Quartiles 0.01 0.03
3 Elected past (placebo) Between Second and Third
Quar-tiles
-0.05 0.03
4 Elected past (placebo) Above Third Quartile (more invest.
capacity)
0.03 0.02
5 Received donation from firms Below First Quartile (less invest.
capacity)
-0.07 0.03
6 Received donation from firms Between First and Second Quartiles -0.04 0.02
7 Received donation from firms Between Second and Third
Quar-tiles
-0.05 0.03
8 Received donation from firms Above Third Quartile (more invest.
capacity)
-0.00 0.02
9 Elected next (incumbency effect) Below First Quartile (less invest.
capacity)
-0.12 0.03
10 Elected next (incumbency effect) Between First and Second Quartiles -0.08 0.03
11 Elected next (incumbency effect) Between Second and Third
Quar-tiles
-0.07 0.03
12 Elected next (incumbency effect) Above Third Quartile (more invest.
capacity)
-0.02 0.03
H
Main results with all covariates in the models as
controls
We add all the covariates in the covariate smoothness section above. The covariates were: Above Median Age, Female, College Degree, Physician, Businessperson, Lawyer, Town with Candidate from PT, Town with Candidate from PSDB, Town with Candidate from PMDB, Town with Candidate from DEM, Town with Candidate from PP, Town with Candidate from PTB, Town with Candidate from PTB, and Town with Candidate from PSB. When we do that, the results remain consistent, with a slight gain in efficiency. The results follow in the Figure below.
● ● ● ● ● ● ● ● ● ● ● ● ● ● ● Full Model
Above Median Inverse Ratio Personnel Expenditure
over Revenue (more invest. capacity)
Below Median Inverse Ratio Personnel Expenditure
over Revenue (less invest. capacity)
Above Median FIRJAN Liquidity Index (more invest. capacity)
Below Median FIRJAN Liquidity Index
(less invest. capacity)
−0.1 0.0 0.1 −0.1 0.0 0.1 −0.1 0.0 0.1 −0.1 0.0 0.1 −0.1 0.0 0.1 Elected next (incumbency effect) Received donation from firms Elected past (placebo) Estimates (with controls)
Pre−Incumbency, Incumbency, and Donation Effects
Municipal−year level cluster−robust SEs − 95% CI
I
Robustness to placebo cutoffs
Consider the proportion of votes acquired by both politicians. The difference in this pro-portion represents the running variable. The politician with propro-portion of votes bigger than zero won the election while the politician with negative difference lost.
A placebo test, to check the validity of our results, would consider a different (and false) winning threshold. For instance, we can change the cutoff from zero to any number we want, and investigate what happens in this new cut. Theoretically, we should have null results in all the placebo cutoffs, as a positive or negative sign in these cutoffs does not change the electoral status from winning or loser.
We rerun the analysis changing the cutoff from zero (the actual cutoff) for placebo cutoffs at -10, -5, 5, and 10. The results are in the Figures below, and they are consistent with our assumption that most results would be, either not significant, or not consistent with our theory.
● ● ● ● ● ● ● ● ● Full Model
Above Median Inverse Ratio Personnel Expenditure
over Revenue (more invest. capacity)
Below Median Inverse Ratio Personnel Expenditure
over Revenue (less invest. capacity)
−0.10 −0.05 0.00 0.05 0.10−0.10 −0.05 0.00 0.05 0.10−0.10 −0.05 0.00 0.05 0.10 Elected next (incumbency effect) Received donation from firms Elected past (placebo) Estimates (Placebo cuts at c = −10)
Pre−Incumbency, Incumbency, and Donation Effects
Municipal−year level cluster−robust SEs − 95% CI
● ● ● ● ● ● ● ● ● Full Model
Above Median Inverse Ratio Personnel Expenditure
over Revenue (more invest. capacity)
Below Median Inverse Ratio Personnel Expenditure
over Revenue (less invest. capacity)
−0.05 0.00 0.05 −0.05 0.00 0.05 −0.05 0.00 0.05 Elected next (incumbency effect) Received donation from firms Elected past (placebo) Estimates (Placebo cuts at c = −5)
Pre−Incumbency, Incumbency, and Donation Effects
Municipal−year level cluster−robust SEs − 95% CI
● ● ● ● ● ● ● ● ● Full Model
Above Median Inverse Ratio Personnel Expenditure
over Revenue (more invest. capacity)
Below Median Inverse Ratio Personnel Expenditure
over Revenue (less invest. capacity)
−0.10 −0.05 0.00 0.05 0.10−0.10 −0.05 0.00 0.05 0.10−0.10 −0.05 0.00 0.05 0.10 Elected next (incumbency effect) Received donation from firms Elected past (placebo) Estimates (Placebo cuts at c = 5)
Pre−Incumbency, Incumbency, and Donation Effects
Municipal−year level cluster−robust SEs − 95% CI
● ● ● ● ● ● ● ● ● Full Model
Above Median Inverse Ratio Personnel Expenditure
over Revenue (more invest. capacity)
Below Median Inverse Ratio Personnel Expenditure
over Revenue (less invest. capacity)
−0.10 −0.05 0.00 0.05 0.10−0.10 −0.05 0.00 0.05 0.10−0.10 −0.05 0.00 0.05 0.10 Elected next (incumbency effect) Received donation from firms Elected past (placebo) Estimates (Placebo cuts at c = 10)
Pre−Incumbency, Incumbency, and Donation Effects
Municipal−year level cluster−robust SEs − 95% CI
J
Sensitivity to bandwidth selection
We rerun the main tables here varying the bandwidth size, from 50% of to 200% of the optimal Calonico et al. (2015) bandwidth. The results are in the Figures below, and they show a consistent and robust relationship, regardless of the bandwidth selection.
Donation Recipient Low Invest. Capacity
Elected Next High Invest. Capacity
Elected Next Low Invest. Capacity Elected Before
High Invest. Capacity
Elected Before Low Invest. Capacity
Donation Recipient High Invest. Capacity Elected Before Full Dataset Donation Recipient Full Dataset Elected Next Full Dataset 0.5 1.0 1.5 2.0 0.5 1.0 1.5 2.0 0.5 1.0 1.5 2.0 −0.2 −0.1 0.0 0.1 −0.2 −0.1 0.0 0.1 −0.2 −0.1 0.0 0.1 Bandwidth Estimates
Sensitivity to Bandwidth Size (50 to 200%)
K
Sensitivity to polynomial degree
In this section, we vary the polynomial degree from local linear to quartic. The results remain around the same as using local linear regression.
● ● ● ● ● ● ● ● ● ● ● ● ● ● ● ● ● ● ● ● ● ● ● ● ● ● ● ● ● ● ● ● ● ● ● ●
Donation recipient and Below Median Investment Capacity
Elected next and Above Median Investment Capacity
Elected next and Below Median Investment Capacity Elected past (placebo) and
Above Median Investment Capacity
Elected past (placebo) and Below Median Investment Capacity
Donation recipient and Above Median Investment Capacity Elected past (placebo) Received donation from firms Elected next (incumbency effect) 1 2 3 4 1 2 3 4 1 2 3 4 −0.1 0.0 0.1 −0.1 0.0 0.1 −0.1 0.0 0.1 Polynomial Order Estimate
Sensitivity to Polynomial Degree
L
Heterogeneous effects by deciles of investment
ca-pacity
We run the heterogeneous effects by decile. Deciles weaken the test power considerably, but we should witness the main patterns in the coefficients. For Inverse Personnel Expenditure, we see a pattern ranges from negative and significant to negative but insignificant, to positive in the last decile of incumbency disadvantage. Something similar occurs in donations from firms.
For the Firjan Liquidity Index, an intriguing findings is that between the 30 and the 50 percentiles, the incumbency disadvantage and donation indicators are negative, flipping sign between 50 and 70 percentiles (all insignificant). This suggests that when a municipality is in a very good or very bad shape, the investment capacity carries very little additional information. However, when it is around the median, the information discrepancies may provide an information advantage for the mayoral candidate. The candidate then can use the uncertainty in her favor.
● ● ● ● ● ● ● ● ● ● ● ● ● ● ● ● ● ● ● ● ● ● ● ● ● ● ● ● ● ● Elected past (placebo) Received donation from firms Elected next (incumbency effect) −0.2 −0.1 0.0 0.1 0.2 −0.2 −0.1 0.0 0.1 0.2 −0.2 −0.1 0.0 0.1 0.2 90 − 100 Percentile (more invest. capacity) 80 − 90 Percentile 70 − 80 Percentile 60 − 70 Percentile 50 − 60 Percentile 40 − 50 Percentile 30 − 40 Percentile 20 − 30 Percentile 10 − 20 Percentile 0 − 10 Percentile (less invest. capacity)
Estimates
Calonico et al. (2014) Optimal Bandwidth
Investment Capacity effects by Decile (Inverse Personnel Expenditure Over Revenue)
Municipal−year level cluster−robust SEs − 95% CI
● ● ● ● ● ● ● ● ● ● ● ● ● ● ● ● ● ● ● ● ● ● ● ● ● ● ● ● ● ● Elected past (placebo) Received donation from firms Elected next (incumbency effect) −0.3 −0.2 −0.1 0.0 0.1 0.2 0.3−0.3 −0.2 −0.1 0.0 0.1 0.2 0.3−0.3 −0.2 −0.1 0.0 0.1 0.2 0.3 90 − 100 Percentile (more invest. capacity) 80 − 90 Percentile 70 − 80 Percentile 60 − 70 Percentile 50 − 60 Percentile 40 − 50 Percentile 30 − 40 Percentile 20 − 30 Percentile 10 − 20 Percentile 0 − 10 Percentile (less invest. capacity)
Estimates
Calonico et al. (2014) Optimal Bandwidth
Investment Capacity effects by Decile (FIRJAN Liquidity Index)
Municipal−year level cluster−robust SEs − 95% CI
M
Party-centered alternative explanations
Klaˇsnja and Titiunik (2017) present a view on the incumbency disadvantage, proposing that strong parties (as PT in Brazil), are able to credibly signal to the electorate that they will provide services as lame-ducks. In the model we presented in Appendix A, this represents that PT would be able to select (or at least constrain politicians to be) long term oriented politicians. In the regressions below we show that our results are complementary to Klaˇsnja and Titiunik (2017), as their main conclusion about PT also holds in our sample. We run the main regressions for PT and PSDB (the most important programmatic parties in Brazil), PMDB (the most important centrist party in Brazil), and then considering changes in the opposition and coalition status of mayors and challengers in Brazilian towns. The results follow below, and show that a party-centered view of Brazilian politics coexist with a investment capacity centered one.
● ● ● ● ● ● ● ● ● ● ● ● ● ● ● Full Model
Above Median Inverse Ratio Personnel Expenditure
over Revenue (more invest. capacity)
Below Median Inverse Ratio Personnel Expenditure
over Revenue (less invest. capacity)
Above Median FIRJAN Liquidity Index (more invest. capacity)
Below Median FIRJAN Liquidity Index
(less invest. capacity)
−0.2 −0.1 0.0 0.1 0.2−0.2 −0.1 0.0 0.1 0.2−0.2 −0.1 0.0 0.1 0.2−0.2 −0.1 0.0 0.1 0.2−0.2 −0.1 0.0 0.1 0.2 Elected next (incumbency effect) Received donation from firms Elected past (placebo) Estimates
Calonico et al. (2014) Optimal Bandwidth
Pre−Incumbency, Incumbency, and Donation Effects (Only PT)
Municipal−year level cluster−robust SEs − 95% CI
● ● ● ● ● ● ● ● ● ● ● ● ● ● ● Full Model
Above Median Inverse Ratio Personnel Expenditure
over Revenue (more invest. capacity)
Below Median Inverse Ratio Personnel Expenditure
over Revenue (less invest. capacity)
Above Median FIRJAN Liquidity Index (more invest. capacity)
Below Median FIRJAN Liquidity Index
(less invest. capacity)
−0.2−0.1 0.0 0.1 0.2 −0.2−0.1 0.0 0.1 0.2 −0.2−0.1 0.0 0.1 0.2 −0.2−0.1 0.0 0.1 0.2 −0.2−0.1 0.0 0.1 0.2 Elected next (incumbency effect) Received donation from firms Elected past (placebo) Estimates
Calonico et al. (2014) Optimal Bandwidth
Pre−Incumbency, Incumbency, and Donation Effects (Only PSDB)
Municipal−year level cluster−robust SEs − 95% CI
● ● ● ● ● ● ● ● ● ● ● ● ● ● ● Full Model
Above Median Inverse Ratio Personnel Expenditure
over Revenue (more invest. capacity)
Below Median Inverse Ratio Personnel Expenditure
over Revenue (less invest. capacity)
Above Median FIRJAN Liquidity Index (more invest. capacity)
Below Median FIRJAN Liquidity Index
(less invest. capacity)
−0.2 −0.1 0.0 0.1 0.2−0.2 −0.1 0.0 0.1 0.2−0.2 −0.1 0.0 0.1 0.2−0.2 −0.1 0.0 0.1 0.2−0.2 −0.1 0.0 0.1 0.2 Elected next (incumbency effect) Received donation from firms Elected past (placebo) Estimates
Calonico et al. (2014) Optimal Bandwidth
Pre−Incumbency, Incumbency, and Donation Effects (Only PSDB)
Municipal−year level cluster−robust SEs − 95% CI
● ● ● ● ● ● ● ● ● ● ● ● ● ● ● Full Model
Above Median Inverse Ratio Personnel Expenditure
over Revenue (more invest. capacity)
Below Median Inverse Ratio Personnel Expenditure
over Revenue (less invest. capacity)
Above Median FIRJAN Liquidity Index (more invest. capacity)
Below Median FIRJAN Liquidity Index
(less invest. capacity)
−0.3−0.2−0.10.0 0.1 0.2 0.3−0.3−0.2−0.10.0 0.1 0.2 0.3−0.3−0.2−0.10.0 0.1 0.2 0.3−0.3−0.2−0.10.0 0.1 0.2 0.3−0.3−0.2−0.10.0 0.1 0.2 0.3 Elected next (incumbency effect) Received donation from firms Elected past (placebo) Estimates
Calonico et al. (2014) Optimal Bandwidth
Pre−Incumbency, Incumbency, and Donation Effects (Both Candidates Government)
Municipal−year level cluster−robust SEs − 95% CI
● ● ● ● ● ● ● ● ● ● ● ● ● ● ● Full Model
Above Median Inverse Ratio Personnel Expenditure
over Revenue (more invest. capacity)
Below Median Inverse Ratio Personnel Expenditure
over Revenue (less invest. capacity)
Above Median FIRJAN Liquidity Index (more invest. capacity)
Below Median FIRJAN Liquidity Index
(less invest. capacity)
−0.2 −0.1 0.0 0.1 0.2−0.2 −0.1 0.0 0.1 0.2−0.2 −0.1 0.0 0.1 0.2−0.2 −0.1 0.0 0.1 0.2−0.2 −0.1 0.0 0.1 0.2 Elected next (incumbency effect) Received donation from firms Elected past (placebo) Estimates
Calonico et al. (2014) Optimal Bandwidth
Pre−Incumbency, Incumbency, and Donation Effects (Both Candidates Opposition)
Municipal−year level cluster−robust SEs − 95% CI
● ● ● ● ● ● ● ● ● ● ● ● ● ● ● Full Model
Above Median Inverse Ratio Personnel Expenditure
over Revenue (more invest. capacity)
Below Median Inverse Ratio Personnel Expenditure
over Revenue (less invest. capacity)
Above Median FIRJAN Liquidity Index (more invest. capacity)
Below Median FIRJAN Liquidity Index
(less invest. capacity)
−0.2 −0.1 0.0 0.1 0.2−0.2 −0.1 0.0 0.1 0.2−0.2 −0.1 0.0 0.1 0.2−0.2 −0.1 0.0 0.1 0.2−0.2 −0.1 0.0 0.1 0.2 Elected next (incumbency effect) Received donation from firms Elected past (placebo) Estimates
Calonico et al. (2014) Optimal Bandwidth
Pre−Incumbency, Incumbency, and Donation Effects (Incumbent in Government and Challenger in Opposition)
Municipal−year level cluster−robust SEs − 95% CI
● ● ● ● ● ● ● ● ● ● ● ● ● ● ● Full Model
Above Median Inverse Ratio Personnel Expenditure
over Revenue (more invest. capacity)
Below Median Inverse Ratio Personnel Expenditure
over Revenue (less invest. capacity)
Above Median FIRJAN Liquidity Index (more invest. capacity)
Below Median FIRJAN Liquidity Index
(less invest. capacity)
−0.2 −0.1 0.0 0.1 0.2 −0.2 −0.1 0.0 0.1 0.2 −0.2 −0.1 0.0 0.1 0.2 −0.2 −0.1 0.0 0.1 0.2 −0.2 −0.1 0.0 0.1 0.2 Elected next (incumbency effect) Received donation from firms Elected past (placebo) Estimates
Calonico et al. (2014) Optimal Bandwidth
Pre−Incumbency, Incumbency, and Donation Effects (Incumbent in Opposition and Challenger in Government)
Municipal−year level cluster−robust SEs − 95% CI