Spacial distribution of fertigated coffee root system
Distribuição espacial do sistema radicular do cafeeiro fertirrigadoMarcelo Rossi Vicente1*, Everardo Chartuni Mantovani2, André Luís Teixeira Fernandes3, Júlio César Lima Neves4, Edmilson Marques Figueredo5, Fábio Teixeira Delazari6
1Instituto Federal de Educação, Ciência e Tecnologia do Norte de Minas Gerais/IFNMG, Salinas, MG, Brasil 2Universidade Federal de Viçosa/UFV, Departamento de Engenharia Agrícola, Viçosa, MG, Brasil 3Universidade de Uberaba/Uniube, Uberaba, MG, Brasil
4Universidade Federal de Viçosa/UFV, Departamento de Solos, Viçosa, MG, Brasil 5Bahia Farm Show, Barreiras, BA, Brasil
6Universidade Federal de Viçosa/UFV, Departamento de Fitotecnia, Viçosa, MG, Brasil *Corresponding author: [email protected]
Received in May 20, 2016 and approved in October 31, 2016
ABSTRACT
The development of coffee plant root system changes when subjected to drip irrigation and fertigation. This work aimed to evaluate the effects of different levels of fertigation on the development of coffee root system by drip irrigation in western Bahia. The experiment was carried out with Catuaí Vermelho IAC 144 coffee plants, of about 3.5 years of age, in the “Café do Rio Branco” farm, located in Barreiras – BA, and consisted of a complete randomized blocks design with 3 replicates. Treatments consisted of three levels of nitrogen and potassium fertilization (900/800, 600/500 and 300/250 kg ha-1 year-1 N and K
2O), weekly distributed, by means of fertigation, throughout the process. After the fourth harvest, coffee root system was evaluated, and root length density (RLD) and root density (RD) were determined at different sampled layers. The highest root concentration, root length density (RLD), and root density (RD) were observed in the superficial layers of soil (0-20 cm), and under the dripline (30 and 70 cm from the orthotropic branch). Results showed that the lower the N and K2O levels, the higher was the development (RLD and RD) of the coffee root system.
Index terms: Coffea arabica L.; irrigation; nitrogen fertilization; potassium fertilization.
RESUMO
O desenvolvimento do sistema radicular do cafeeiro é alterado quando submetido à irrigação localizada e fertirrigação. Este trabalho foi desenvolvido com o objetivo de avaliar os efeitos de diferentes doses de fertirrigação sobre o desenvolvimento do sistema radicular do cafeeiro irrigado por gotejamento na região Oeste da Bahia. Realizou-se o trabalho na fazenda Café do Rio Branco, localizada em Barreiras - BA, em cafeeiros de aproximadamente 3,5 anos de idade, da variedade Catuaí IAC 144. O experimento foi montado em um esquema fatorial 3 x 3, sendo três níveis de adubação nitrogenada e potássica (900/800, 600/500 e 300/250 kg ha-1 ano-1 de N e K
2O), em 3 parcelamentos mensais de fertirrigação (2, 4 e 8 vezes). Após a quarta safra, o sistema radicular do cafeeiro foi avaliado e a densidade de comprimento radicular (DCR) e densidade radicular (DR) em diferentes camadas amostradas foram determinadas. A maior concentração de raízes, densidade de comprimento radicular (DCR) e densidade radicular (DR) foi obtida nas camadas superficiais (0-20 cm) e sob a linha lateral (30 e 70 cm de distância do ramo ortotrópico). As menores doses de N e K2O propiciaram maior desenvolvimento (DCR e DR) do sistema radicular do cafeeiro.
Termos para indexação: Coffea arabica L.; irrigação; adubação nitrogenada; adubação potássica.
INTRODUCTION
Irrigation allowed the expansion of coffee cultivated areas into regions considered marginal to its cultivation. These regions are limited by high temperatures and scarce rainfall (Dominghetti et al., 2014; Silveira et al., 2015).
This technology ensures adequate water supply at critical periods of water requirements, besides maximizing
efficiency in the application of fertilizers by means of
fertigation (Dominghetti et al., 2014). The increase of
fertilizer efficiency is one of the main advantages of
fertigation (Guimarães et al., 2011; Rezende et al., 2010; Sobreira et al., 2011).
Compared with the conventional fertilization system, fertigation increases yield, improves the quality of coffee plants fruits, reduces costs with labor, and increases
efficiency of soil management (Carvalho et al., 2010;
Pereira et al., 2010; Sobreira et al., 2011).
However, the benefits of this technique are limited due to the lack of specific information in relation to coffee
A very important factor when working with irrigation/fertigation by drip is the crop root system.
Coffea arabica root system is concentrated under
the canopy projection (Motta et al., 2006), reaching 50 cm depth (Rena; Guimarães, 2000).
Root development is complex and is influenced
by various factors (Rena et al., 2002; Silva et al., 2010). Several researchers state that the conformation of the root system depends primarily on the genetic load of the plant, and then, on the properties and characteristics of the soil, such as fertility, water content, aeration, density, mechanical strength, among others.
Fertigation provides more root concentration in
the superficial layers since fertilizers distribution is more
concentrated in that region (Barreto et al., 2006; Ronchi et al., 2015).
Considering mineral and organic fertilization, nitrogen is the most important element for the longitudinal and radial growth of the roots. However, different potassium levels do
not significantly affected root growth (Kumar, 1979).
This work aimed to study the effects of different levels and plots of drip fertigation on coffee root system in western Bahia conditions.
MATERIAL AND METHODS
An experiment was carried out with Catuaí Vermelho IAC 144 coffee plants, of approximately 3.5 years of age, irrigated by a dripline, in Café Rio Branco farm (Latitude: 11º48’01’’ South, Longitude: 45º35’50’’
West; at 735m asl), located in Barreiras, state of Bahia, in
a Quatzipsammment Soil with sandy loam texture. The study was carried out from November 2004 to May 2008.
Physical characterization of the soil of the experimental area
Table 1 shows the textural analysis of the area where the experiment was set. Table 2 shows the values of soil water retention for the several water tensions. Soil moisture corresponding to 5 and 1540 kPa were considered
as field capacity and permanent wilting point, respectively.
Table 1: Granulometric composition, textural classification, and soil density of the experimental area.
Depth (cm)
Granulometric
composition (%) density Soil (g/cm3)
Textural classification
Sand Silt Clay
0-20 65.53 2.23 32.24 1.57 Sandy clay loam 20-40 63.37 2.86 33.78 1.57 Sandy clay loam 40-60 57.20 2.83 39.97 1.47 Sandy clay
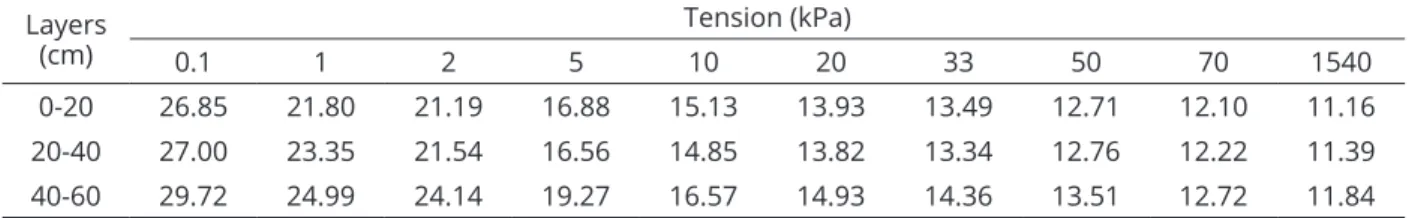
Table 2: Soil water retention values (% moisture in weight) for different levels of water tension in the soil for the experimental area.
Layers
(cm)
Tension (kPa)
0.1 1 2 5 10 20 33 50 70 1540
0-20 26.85 21.80 21.19 16.88 15.13 13.93 13.49 12.71 12.10 11.16
20-40 27.00 23.35 21.54 16.56 14.85 13.82 13.34 12.76 12.22 11.39
40-60 29.72 24.99 24.14 19.27 16.57 14.93 14.36 13.51 12.72 11.84
Mean values of field capacity and wilting point of the soil, in the 0-60 cm layer, were 17.57 and 11.46% in
weight, respectively.
Treatment description
The experiment was carried out with coffee plants planted in December 2002, in 3.80 x 0.5 m spacing (5263 plants ha-1), irrigated by drip, with 2.3 L h-1 flow rate, spaced 0.75 m apart.
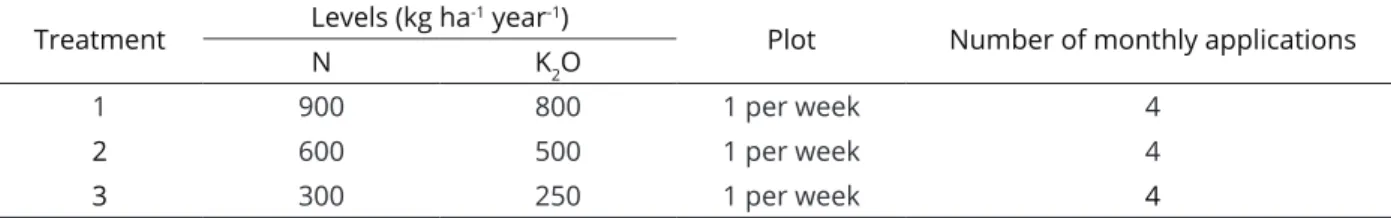
Experimental plots were composed of 20 plants (10m), and the 10 central plants were considered the useful plot. The experiment consisted of randomized blocks design with three replicates. Table 3 shows more details regarding the treatments.
Table 4 presents the fertilizer distribution over the experimentation years, recommended for western Bahia (Santinato; Fernandes, 2002). Urea was used as nitrogen source, and potassium chloride was used as potassium source.
Irrigation and Water Management
Coffee water demand was determined with the aid
of the Irriplus software, using adjustment coefficients on the
Table 3: Description of the different treatments of N and K2O levels and plots, Barreiras, BA.
Treatment Levels (kg ha
-1 year-1)
Plot Number of monthly applications
N K2O
1 900 800 1 per week 4
2 600 500 1 per week 4
3 300 250 1 per week 4
Table 4: Fertilizers distribution over the experimentation years.
Nutrient Jan Feb Mar Apr May Jun Jul Aug Sep Oct Nov Dec
N 10% 10% 10% 10% 5% 5% 5% 5% 10% 10% 10% 10%
K2O 15% 15% 15% 10% 5% 0% 0% 5% 5% 10% 10% 10%
ETc ETo Kc Ks Kl (1)
in which ETc: crop evapotranspiration, in mm d-1;
ETo: reference evapotranspiration, in mm d-1; Kc: crop coefficient, dimensionless; Ks: water stress coefficient, dimensionless; and Kl: coefficient related to the percentage
of ground covered by the crop, dimensionless.
The estimate method of ETo used by Irriplus, according to the available weather elements (solar radiation, average temperature, wind speed, relative humidity) was carried out by the Penman-Monteith-FAO 56 method (Allen et al., 2006). Meteorological data used for the experiment were obtained from an automatic agrometeorological station (Davis, Vantage Pro model), located in the farm.
Ks was calculated using the logarithmic model
(Mantovani et al., 2013), in function of the percentage of
wet or shaded area (Keller; Bliesner, 1990; Mantovani et
al., 2013).
Values of crop coefficient (Kc), percentage of
shaded area (P), and effective root depth used in this
experiment were 1.0, 50% and 0.60 m, respectively. Percentage of wet area was 30 %.
Figure 1 shows the reference evapotranspiration (monthly average and maximum), and the monthly average temperature, between November 2004 and May 2008. During this period, the cumulative value of ETo was of 5,444 mm (mean of 4.20 mm d-1 and 1,485 mm year-1). October 2007 had the highest ETo mean (5.85 mm d-1), and November 2007 had the maximum daily ETo (8.76
mm d-1). The average temperature of the studied period was 22.9 °C, and the highest monthly average (25.7 °C)
was obtained in October 2005.
Total irrigation depth applied during the studied period (November 2004 to May 2008) was 3028 mm. Total
rainfall was 3715.5 mm.
Coffee root system evaluation
For root system samples, a soil probe of 72 mm
diameter and 1.30 m length was used (Guan et al., 2015;
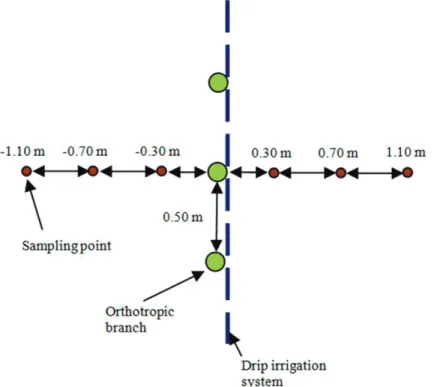
Quanqi et al., 2010). Samples were determined at 0.30, 0.70,
and 1.10 m from the main orthotropic branch, on both sides of the plant, and perpendicular to the row (Figure 2), and taken from layers of 0-0.10; 0.10-0.20; 0.30-0.40;
0.50-0.60; 0.70-0.80; and 0.90-1.00 m depth. Sampling was
carried out in one plant of each plot of the treatments, in three replications, in October 2008, i.e., forty-three months after treatment application.
After removal, soil and root samples were placed on a 2mm mesh sieve. With the aid of water jets, roots were separated from the soil.
Afterwards, roots were kept in 50% alcohol solution, and then classified according to the diameter,
considering coarse roots (>3 mm); medium roots, or
support of the absorbing roots (1 to 3 mm); and fine roots,
or absorbing roots (<1 mm) (Rena et al., 2002). After
classification, roots were placed on transparency sheets for scanning, with 300 dpi resolution in JPG files, and were
processed in order to obtain roots length and diameter with the aid of the Quaantroot software (Guan et al., 2015; Quanqi et al., 2010).
Subsequently, dry mass was determined in an
analytical scale, after drying in an oven at 60 °C for sufficient time to achieve roots constant mass.
Figure 1: Reference evapotranspiration (monthly average and maximum) in mm d-1, and monthly average temperature in °C.
R A L RDL V R R M RD V (2)
in which RLD: root length density (cm cm-3); L R: total
length of sampled roots (cm); and VA: total volume of sampled soil (cm-3).
(3)
in which RD: root density (g dm-3); M
R: root dry mass (g);
and VA: total volume of sampled soil (dm-3).
Statistical analysis
The split plot scheme was used for data analyses of root length density (RLD) and root density (RD), in which the three treatments constituted the plot, and depth and sampling distance constituted the subplot treatments.
The F test at 5% probability was used for analysis
of variance, and means were compared using the Tukey
test at 5% probability.
The SAEG 9.0 statistical software, developed by
the Federal University of Viçosa, was used for statistical analysis.
RESULTS AND DISCUSSION
Root system analysis
Significant effect (p<0.05) of N and K20 levels on the development of coffee root system (fine roots) was observed, as confirmed by the RLD and RD values (Table 5).
The lower the N and K2O levels, the higher was
the development of the root system. Thus, lower levels are
compensated by higher growth. These results confirm the
claim that under conditions of low nutrient availability, root production may increase in some coffee cultivars (Alves et al., 2011).
Results showed that coffee with moderate
nutritional deficiency of N and K2O have higher root
growth when compared with better nourished coffee trees, possibly due to allocation of carbohydrates to the root system.
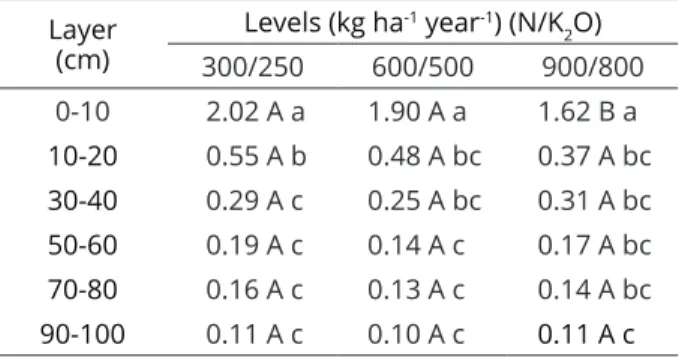
Results presented in Table 6 corroborate the above statements, since levels x sampled layers interaction
was significant (p<0.05) for fine roots RD. Coffee plants subjected to 300/250 and 600/500 (N/K2O) levels produced
more roots in the 0-10 cm depth layer than those subjected
to 900/800 (N/K2O).
Table 5: Root length density - RLD (cm cm-3) and root
density – RD (g dm-3) of fine roots for the different N
and K2O levels. Levels (kg ha-1 year-1)
(N/K2O) RLD (cm cm-3) RD (g dm-3)
300/250 2.47 A 0.5545 A
600/500 1.94 B 0.4546 B
900/800 1.94 B 0.4991 AB
Means followed by the same letter in the column do not differ by theTukey test (P <0.05).
Table 6: Root density - RD (g cm-3) of fine roots for
sampled layers, in function of N and K2O. Layer
(cm)
Levels (kg ha-1 year-1) (N/K 2O)
300/250 600/500 900/800
0-10 2.02 A a 1.90 A a 1.62 B a
10-20 0.55 A b 0.48 A bc 0.37 A bc
30-40 0.29 A c 0.25 A bc 0.31 A bc
50-60 0.19 A c 0.14 A c 0.17 A bc
70-80 0.16 A c 0.13 A c 0.14 A bc
90-100 0.11 A c 0.10 A c 0.11 A c
Means followed by the same uppercase letter (line) and by the same lowercase letter (column) do not differ by the Tukey test at 5% probability.
There was significant interaction effect of sampled levels and distances (p<0.5) for RLD (fine and medium roots) and RD (fine roots only). Table 7 and 8 shows the
RLD and RD values, respectively, for sampled layers and levels. The largest concentration of roots was observed in the fertirrigated range, under the dripline, at distances
of 30 and 70 cm. These results are consistent with those
presented by Rena et al. (2002), who observed in 6 years-old coffee plants, in Ponte Nova - MG, the highest root volume on the side where it is usually fertilized.
Table 7 and 8 show that both RLD and RD, for fine roots at distance of 70 cm and at a rate of 300/250 N/K2O were
superior to the other sampled layers, demonstrating greater
development of coffee root system under lower N and K2O.
There was isolated effect on the sampled distance
on RLD and RD for fine and medium roots, as shown in Table 9. Higher concentration of roots was observed at distances of 30 and 70 cm under the dripline, i.e., under
Table 7: Root length density - RLD (cm cm-3) of fine and medium roots for different sampled levels and layers.
Levels (kg ha-1 year-1) (N/K2O)
Distance (cm)
-110 -70 -30 30 70 110
Fine roots
300/250 0.5 Da 2.33 BCDa 2.63 BCDa 3.04 BCa 4.94 Aa 1.4 CDa
600/500 0.36 Ca 1.53 BCa 1.99 BCa 3.69 ABa 2.59 ABCb 1.46 BCa
900/800 0.73 Ba 2.52 A a 2.21 Aa 2.67 Aa 2.69 Ab 0.81 Ba
Medium roots
300/250 0.02 Ca 0.02 BCa 0.06 ABCa 0.06 ABCab 0.07 ABa 0.02 BCa
600/500 0.01 Ca 0.02 BCa 0.05 ABCa 0.09 ABab 0.05 ABCa 0.02 BCa
900/800 0.03 Aa 0.03 Aa 0.03 Aa 0.05 Ab 0.04 Aa 0.02 Aa
Means followed by the same uppercase letter (line) and by the same lowercase letter (column), within the same roots class, do not differ by the Tukey test at 5% probability.
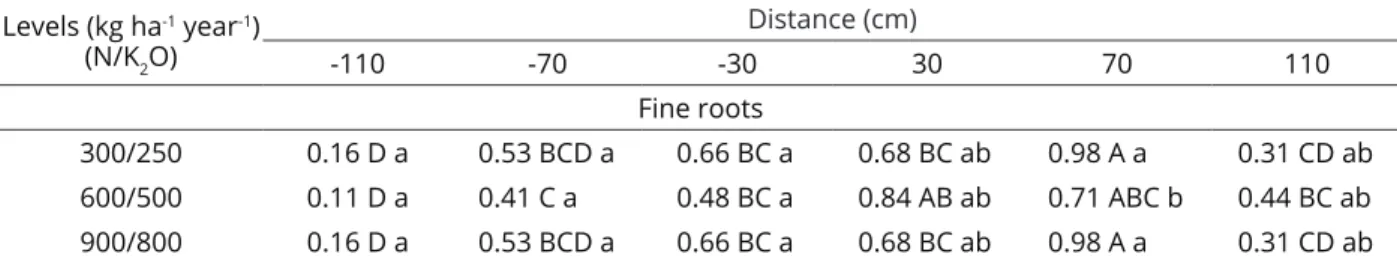
Table 8: Root density - RD (g dm-3) of fine roots for different sampled levels and layers.
Levels (kg ha-1 year-1)
(N/K2O)
Distance (cm)
-110 -70 -30 30 70 110
Fine roots
300/250 0.16 D a 0.53 BCD a 0.66 BC a 0.68 BC ab 0.98 A a 0.31 CD ab
600/500 0.11 D a 0.41 C a 0.48 BC a 0.84 AB ab 0.71 ABC b 0.44 BC ab
900/800 0.16 D a 0.53 BCD a 0.66 BC a 0.68 BC ab 0.98 A a 0.31 CD ab
Means followed by the same uppercase letter (line) and by the same lowercase letter (column) do not differ by the Tukey test at 5% probability.
concentration of roots below the tree canopy and near the drip emitter.
Isolated effect was also observed in sampled layer on
the RLD and RD for fine and medium roots (Table 10). As
expected, due to the higher concentration of organic matter,
nutrients, and soil moisture levels, superficial layers (0-10
and 10-20 cm) showed the highest root concentration (RLD
and RD) for both fine and medium roots.
Values observed for RD, both for fine and medium
roots, in all the layers, are in agreement with those
observed in the literature (Soares et al., 2007). On the
other hand, Partelli et al. (2006) observed values of about
7.1 cm cm-3 (fine roots) for the 0-20 cm layer for ‘Conilon’
coffee plants, from seeds and cuttings, in the municipality of Vila Valério, ES. The authors also observed reduction in roots density in function of the layer depth.
Several authors found higher roots concentration
in more superficial layers (Garriz, 1978; Sakai et al., 2015; Soares et al., 2007).
There was significant effect (p<0.05) of distance
x sampled layer interaction on RLD and RD. Tables 11 and 12 show RLD (Table 11) and RD (Table 12) means for the different sampled distances and layers.
By analyzing both tables, together with Tables
6, 7, 9 and 10, the highest concentration of roots
is confirmed in superficial layers and closer to the dripline, where roots find greater availability of nutrients and water, allowing the coffee crop to use more efficiently the water and minerals available. The presence of mulch also contributes to greater root
system volume in the upper layers (Cassidy; Kumar, 1984).
Table 9: Root length density - RLD (cm cm-3) and root
density - RD (g dm-3) of fine and medium roots for sampled distances.
Distance (cm)
RLD (cm cm-3)
Distance (cm)
RD (g dm-3)
Fine roots
70 3.40 A 70 0.77 A
30 3.13 A 30 0.71 AB
-30 2.27 B -30 0.55 BC
-70 2.12 B -70 0.51 C
110 1.22 C 110 0.32 D
-110 0.53 C -110 0.17 D
Medium roots
30 0.0654 A 30 0.3379 A
70 0.0526 A 70 0.2959 AB
-30 0.0462 AB -30 0.2748 ABC
-70 0.0244 BC -70 0.1481 BCD
110 0.0197 C 110 0.0910 CD
-110 0.0168 C -110 0.0777 D
Means followed by the same letter, for RLD and RD, within the roots classes, do not differ by the Tukey test at 5% probability.
Table 10: Root length density - RLD (cm cm-3) and root
density - RD (g dm-3) of fine and medium roots for the
sampled layers. Layer
(cm)
RLD (cm cm-3)
Layer (cm)
RD (g dm-3)
Fine roots
0-10 8.48 A 0-10 1.85 A
10-20 1.87 B 10-20 0.47 B
30-40 0.94 C 30-40 0.28 C
50-60 0.56 C 50-60 0.17 CD
90-100 0.54 C 70-80 0.14 CD
70-80 0.30 C 90-100 0.10 D
Medium roots
0-10 0.0907 A 0-10 0.4610 A
10-20 0.0494 B 10-20 0.3097 B
30-40 0.0359 BC 30-40 0.1919 BC
50-60 0.0184 C 50-60 0.1103 C
70-80 0.0165 C 70-80 0.0858 C
90-100 0.0142 C 90-100 0.0666 C
Means followed by the same letter, for RLD and RD, within the roots classes, do not differ by the Tukey test at 5% probability.
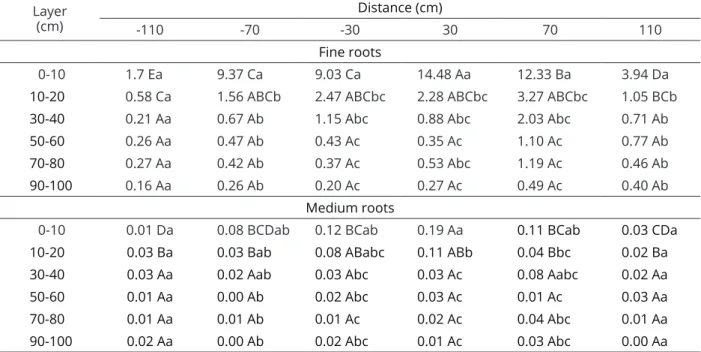
Table 11: Root length density - RLD (cm cm-3) of fine and medium roots for the sampled distances and layers.
Layer
(cm)
Distance (cm)
-110 -70 -30 30 70 110
Fine roots
0-10 1.7 Ea 9.37 Ca 9.03 Ca 14.48 Aa 12.33 Ba 3.94 Da
10-20 0.58 Ca 1.56 ABCb 2.47 ABCbc 2.28 ABCbc 3.27 ABCbc 1.05 BCb
30-40 0.21 Aa 0.67 Ab 1.15 Abc 0.88 Abc 2.03 Abc 0.71 Ab
50-60 0.26 Aa 0.47 Ab 0.43 Ac 0.35 Ac 1.10 Ac 0.77 Ab
70-80 0.27 Aa 0.42 Ab 0.37 Ac 0.53 Abc 1.19 Ac 0.46 Ab
90-100 0.16 Aa 0.26 Ab 0.20 Ac 0.27 Ac 0.49 Ac 0.40 Ab
Medium roots
0-10 0.01 Da 0.08 BCDab 0.12 BCab 0.19 Aa 0.11 BCab 0.03 CDa
10-20 0.03 Ba 0.03 Bab 0.08 ABabc 0.11 ABb 0.04 Bbc 0.02 Ba
30-40 0.03 Aa 0.02 Aab 0.03 Abc 0.03 Ac 0.08 Aabc 0.02 Aa
50-60 0.01 Aa 0.00 Ab 0.02 Abc 0.03 Ac 0.01 Ac 0.03 Aa
70-80 0.01 Aa 0.01 Ab 0.01 Ac 0.02 Ac 0.04 Abc 0.01 Aa
90-100 0.02 Aa 0.00 Ab 0.02 Abc 0.01 Ac 0.03 Abc 0.00 Aa
CONCLUSIONS
Coffee plants subjected to lower N and K2O
levels presented more developed root systems. Higher
concentration of roots was observed in the superficial
layers and under the dripline, where fertilizers were applied by fertigation.
ACKNOWLEDGEMENTS
The authors thank the Foundation for Research of the State of Minas Gerais (FAPEMIG), and the National
Council for Scientific and Technological Development (CNPq) for the scholarships and financial support of this
research.
REFERENCES
ALLEN, R. G. et al. Evapotranspiración del cultivo Guías para la determinación de los requerimientos de agua de los cultivos. Roma: Estudio FAO Riego y Drenaje,
2006. 323p.
ALVES, J. D. et al. Source-sink manipulations in Coffea arabica L. and its effect on growth of shoots and root system. Ciência e Agrotecnologia. 35(5):956-964, 2011.
BARRETO, C. V. G. et al. Distribuição espacial do sistema radicular do cafeeiro fertirrigado por gotejamento em
Campinas. Bragantia. 65:641-647, 2006.
CARVALHO, A. M. et al. Correlação entre crescimento e produtividade de cultivares de café em diferentes
regiões de Minas Gerais, Brasil. Pesquisa Agropecuaria
Brasileira. 45(3):269-275, 2010.
CASSIDY, D. M. S.; KUMAR, D. Root distribution of Coffea arabica L. in Zimbabwe. I. The effect of plant density, mulch,
cova planting and shade in Chipinge. Zimbabwe Journal
of Agricultural Research. 22:119-132, 1984.
DOMINGHETTI, A. W. et al. Doses de fósforo e irrigação
na nutrição foliar do cafeeiro. Revista Brasileira de Engenharia Agrícola e Ambiental. 18(12):1235-1240, 2014.
GARRIZ, P. I. Distribuición radicular de três cultivares de Coffea arábica L. de 24 años de edad, em um suelo
limo-arcilloso. Cencias de la Agricultura. 2:65-76, 1978.
GUAN, D. et al. Tillage practices effect on root distribution
and water use efficiency of winter wheat under rain-fed condition in the North China Plain. Soil & Tillage Research. 146(1):286-295, 2015.
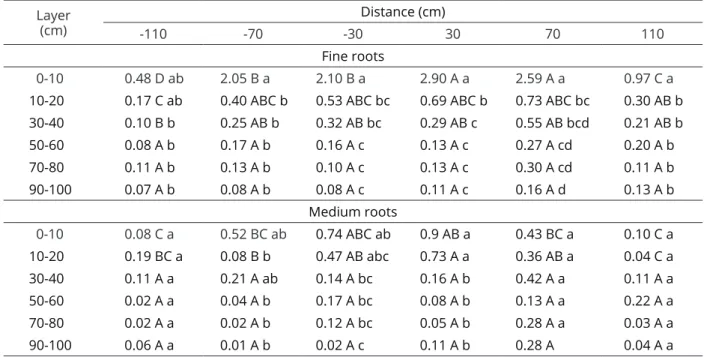
Table 12: Root density - RD (g dm-3) of fine and medium roots for the sampled distances and layers.
Layer
(cm)
Distance (cm)
-110 -70 -30 30 70 110
Fine roots
0-10 0.48 D ab 2.05 B a 2.10 B a 2.90 A a 2.59 A a 0.97 C a
10-20 0.17 C ab 0.40 ABC b 0.53 ABC bc 0.69 ABC b 0.73 ABC bc 0.30 AB b
30-40 0.10 B b 0.25 AB b 0.32 AB bc 0.29 AB c 0.55 AB bcd 0.21 AB b
50-60 0.08 A b 0.17 A b 0.16 A c 0.13 A c 0.27 A cd 0.20 A b
70-80 0.11 A b 0.13 A b 0.10 A c 0.13 A c 0.30 A cd 0.11 A b
90-100 0.07 A b 0.08 A b 0.08 A c 0.11 A c 0.16 A d 0.13 A b
Medium roots
0-10 0.08 C a 0.52 BC ab 0.74 ABC ab 0.9 AB a 0.43 BC a 0.10 C a
10-20 0.19 BC a 0.08 B b 0.47 AB abc 0.73 A a 0.36 AB a 0.04 C a
30-40 0.11 A a 0.21 A ab 0.14 A bc 0.16 A b 0.42 A a 0.11 A a
50-60 0.02 A a 0.04 A b 0.17 A bc 0.08 A b 0.13 A a 0.22 A a
70-80 0.02 A a 0.02 A b 0.12 A bc 0.05 A b 0.28 A a 0.03 A a
90-100 0.06 A a 0.01 A b 0.02 A c 0.11 A b 0.28 A 0.04 A a
GUIMARÃES, R. J. et al. Adubação para primeiro ano pós-plantio
(N e K2O) de cafeeiros fertirrigados na região sul de Minas Gerais. Coffee Science. 5(2):137-147, 2011.
KELLER, J.; BLIESNER, R. D. Sprinkle and trickle irrigation.
New York: van Nostrand Reinhold, 1990. 652p.
KUMAR, D. Some aspects of the physiology of Coffea arábica
L. A review. Kenya Coffee. 44:9-47, 1979.
MANTOVANI, E. C. et al. Eficiência no uso da água de duas
cultivares de batata-doce em resposta a diferentes lâminas de irrigação. Horticultura Brasileira. 31(4):602-606, 2013.
MOTTA, A. C. V. et al. Distribuição horizontal e vertical da fertilidade do solo e das raízes de cafeeiro (Coffea arabica L.) cultivar Catuaí. Acta Scientiarum. Agronomy. 28:455-463, 2006.
PARTELLI, F. A. et al. Produção e desenvolvimento radicular de plantas de café ‘Conilon’ propagadas por sementes e por
estacas. Pesquisa Agropecuária Brasileira. 41(6):949-954, 2006.
PEREIRA, M. G. et al. Carbono, matéria orgânica leve e fósforo remanescente em diferentes sistemas de manejo do solo.
Pesquisa Agropecuária Brasileira. 45(5):508-514, 2010.
QUANQI, L. et al. Root growth, available soil water, and water-use efficiency of winter wheat under different irrigation regimes applied at different growth stages in North China.
Agricultural Water Management. 97(10):1676-1682, 2010.
RENA, A. B.; DAMATTA, F. M. O sistema radicular do cafeeiro: Estrutura e ecofisiologia. In: ZAMBOLIN, L. O estado da
arte de tecnologias na produção de café. Viçosa: UFV, 2002. p.11-92.
RENA, A. B.; GUIMARÃES, P. T. G. Sistema radicular do cafeeiro: Estrutura, distribuição, atividade e fatores que o influenciam. Belo Horizonte: Epamig, 2000. 80p.
REZENDE, R. et al. Crescimento inicial de duas cultivares de
cafeeiro em diferentes regimes hídricos e dosagens de fertirrigação. Engenharia Agrícola. 30(3):447-458, 2010.
RONCHI, C. P. et al. Morfologia radicular de cultivares de café arábica submetidas a diferentes arranjos espaciais.
Pesquisa Agropecuária Brasileira. 50(3):187-195, 2015.
SAKAI, E. et al. Coffee productivity and root systems in cultivation
schemes with different population arrangements and with and without drip irrigation. Agricultural Water
Management. 148(1):16-23, 2015.
SANTINATO, R.; FERNANDES, A. L. T. Cultivo do cafeeiro irrigado em plantio circular sob pivô central. Belo
Horizonte: O Lutador, 2002. 251p.
SILVA, V. A. et al. Resposta fisiológica de clone de café Conilon sensível à deficiência hídrica enxertado em porta-enxerto
tolerante. Pesquisa Agropecuária Brasileira. 45(5):457-464, 2010.
SILVEIRA, H. R. O. et al. Gas exchange and carbohydrate
partitioning in coffee seedlings under waterlogging.
Ciência e Agrotecnologia. 39(2):138-146, 2015.
SOARES, A. R. et al. Produção e distribuição de raízes em cafeeiros irrigados por gotejamento. Engenharia na Agricultura. 15(2):130-140, 2007.
SOBREIRA, F. M. et al. Adubação nitrogenada e potássica de