2016 | Lavras | Editora UFLA | www.editora.ufla.br | www.scielo.br/cagro
http://dx.doi.org/10.1590/S1413-70542016000100005
Population dynamics and spatial distribution of
Abaris basistriata
Chaudoir, 1873 (Coleoptera: Carabidae)
Dinâmica populacional e distribuição espacial de Abaris basistriata Chaudoir, 1873 (Coleoptera: Carabidae)
Ivan Carlos Fernandes Martins1*, Francisco Jorge Cividanes2, José Carlos Barbosa2, Joaquim Alves de Lima Junior1,Lourival Dias Campos1
1Universidade Federal Rural da Amazônia/UFRA, Capanema, PA, Brasil
2Universidade Estadual Paulista/UNESP, Faculdade de Ciências Agrárias e Veterinárias/FCAV, Jaboticabal, SP, Brasil *Corresponding author: ivan.martins@ufra.edu.br
Received in june 4, 2015 and approved in october 18, 2015
ABSTRACT
Abaris basistriata, a beetle species dominant in agroecosystems and natural habitats, may benefit from the establishment of nearby refuge areas or crop field centers. To confirm this hypothesis, we analyzed the spatial distribution of the species and verified the population dynamics of this predator in a soybean/corn rotation crop and a central refuge area. The 1-ha experimental area was divided in half by a range of herbaceous plants (2 m in width and 80 m in length). Beetle samples were collected using pitfall traps every fortnight during the in-season and every month during the off-season (a total of 27 sampling occurrences). Population fluctuation was analyzed by correlating the total number of specimens with plant phenology. We used multiple regression analysis with variable (stepwise) selection to examine the influence of meteorological factors on species occurrence. To determine the spatial distribution, data were analyzed using dispersion indices and probabilistic models based on the Coleoptera frequency distribution. Distribution visualization was assessed using a linear interpolation map. A total of 143 A. basistriata specimens were collected, with 83 from the soybean/corn area and 60 from the refuge area.
Periods of large population size occurred during a season with high rainfall and high maximum and minimum temperatures. On the basis of the spatial distribution analysis of A. basistriata, it is likely that the beetles occur in an aggregate form, preferably in the refuge area.
Index terms: Interpolation map; population fluctuation; refuge areas; soybean.
RESUMO
A espécie Abaris basistriata é dominante em agroecossistemas e habitats naturais, podendo ser beneficiada pela criação de áreas de
refúgio próximas ou ao centro de culturas. Para confirmar essa hipótese, este estudo teve como objetivo analisar a distribuição espacial e verificar a dinâmica populacional desse predador em uma área de rotação soja e milho e uma área de refúgio central. A área experimental apresentava um hectare dividido ao meio por uma faixa de plantas herbáceas de dois metros de largura por 80 metros de comprimento. Os besouros foram coletados com armadilhas pitfall com amostragens quinzenais na safra e mensais na entressafra, totalizando 27 amostras. A flutuação populacional foi analisada e relacionada com o total de espécimes e as fases fenológicas das plantas. Utilizou-se análise de regressão múltipla com seleção de variáveis “stepwise”, para verificar a influência dos fatores meteorológicos na ocorrência da espécie. Para determinar a distribuição espacial, os dados foram analisados por meio dos índices de dispersão e modelos probabilísticos, com base na distribuição de frequência dos coleópteros. A visualização da distribuição foi verificada por mapa de interpolação linear. Um total de 143 espécimes de A. basistriata foi coletado, sendo 83 na cultura de soja/milho e 60 na área de refúgio. Os períodos de elevada
população ocorreram, durante a estação de alta precipitação pluvial, com temperatura mínima e máxima elevada. Com base na análise da distribuição espacial de A. basistriata, verifica-se que essa espécie ocorre de forma agregada, preferencialmente, na área de refúgio.
Termos para indexação: Mapa de interpolação; flutuação populacional; áreas de refúgio; soja.
INTRODUCTION
For conservative biological control, techniques that conserve and increase the population density of natural enemies of insect pests are used (Thomas; Wratten; Sotherton, 1991; Dent, 1995; Dent, 2000). Establishment of nearby areas or refuges as islands in crop field centers can improve the diversity and occurrence of natural enemies,
and this technique can be easily implemented in integrated pest management programs (Thomas; Wratten; Sotherton,
phytophagous insects, and management studies may have to be performed in the future.
Establishment of refuge areas that focus on pest management in agricultural ecosystems requires information about the ecology of herbivorous insects, natural enemies, and interactions between organisms and plant-provided resources (Lavandero et al., 2006). Among the natural enemies commonly found in agroecosystems are species that belong to the family Carabidae (Collins et al., 2003; Macleod et al., 2004), and Abaris basistriata is considered to be dominant in agroecosystems and natural and semi-natural habitats (Cividanes et al., 2009; Martins et al., 2009).
In this study, we aimed to examine the population dynamics and spatial distribution of A. basistriata in two habitats (soybean/corn rotation and central refuge areas) and verify the influence of phenological phases of cultivated plants, meteorological factors, and the refuge area on the occurrence of this insect.
MATERIAL AND METHODS
This study was conducted in a 100 × 100-m area located on 10 ha of land that belongs to the Faculty of Agricultural and Veterinary Sciences (FCAV), São Paulo State University (UNESP), Jaboticabal Municipality, SP
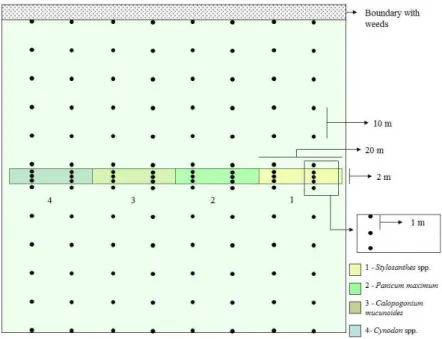
(latitude: 21°15′29″ south and longitude: 48°16′54’″ west). Based on the methods described by Collins et al. (2003), an 80-m-long, 2-m-wide, and 40-cm-high space at the center of this area was used as a shelter for the natural enemies of A. basistriata (Figure 1). This refuge area was divided into four 20-m plots cultivated with the following perennial herbaceous plant types: Panicum maximum ‘Massai’, Cynodon spp. ‘Tifton 85’, Stylosanthes spp. ‘BRS Campo Grande’, and Calopogonium mucunoides ‘Common’
(Figure 1). The following features of the selected herbaceous plants were considered prior to use in the sheltered area: rapid growth, resistance to adverse humidity and temperature conditions, low need for cultivation, durability, and reduced potential to become weeds (Thomas; Wratten; Sotherton, 1992; MacLeord et al., 2004).
The experimental area was planted with soybean in 2008-2009 and 2009-2010 and with winter corn in 2009. The area was left fallow after soybean harvest in 2010. Insecticides were not applied in this area, but each soybean crop received two fungicide and herbicide applications between January and February. In 2008-2009, soybean crops were sown on 12/05/2008 and harvested on 03/27/2009; in 2009-2010, soybean crops were sown on 12/17/2009 and harvested on 04/12/2010. Corn was sown on 03/04/2009 and harvested on 09/25/2009.
Figure 1: Design of the experimental area showing the position of the refuge area (central bar). Dots represent
Species that belonged to the family Carabidae were sampled in the refuge area and crop soils by using pitfall traps, which consisted of plastic cups (8 cm in diameter and 14 cm in height) containing 1/3 volume of a water solution with 1% formaldehyde and a mild detergent. A support cup with an equal volume of the water solution and a perforated bottom for drainage was used for fixing the pitfall trap. A removable plastic cover was placed on each trap at a sufficient height to allow the capture of insects and avoid flooding due to rainwater. Sampling was performed every 2 weeks during the in-season and every month during the off-season, and 27 samplings were performed between 12/17/2008 and 06/09/2010. The remaining traps were installed in the field for a week, and they were subsequently removed and sent to the laboratory for screening, assembly, and specimen labeling.
Six traps were installed in each plot of the herbaceous plants, which were distributed in 2 parallel rows that were 10 m apart; in-line traps were separated by 1 m (Figure 1). For soybean crops, traps were installed in the distribution grid, according to the methodology used by Holland, Perry and Winder (1999) and Thomas, Holland and Brown (2002). In this case, the traps were installed along trap lines of the refuge area. The first traps were 1 m from the refuge area, and the others were installed every 10 m (Figure 1).
To study fluctuations in A. basistriata populations, we analyzed the total number of specimens collected from all the traps in the sampling period. Moreover, we evaluated the influence of meteorological factors by using multiple regression analyses with variable “stepwise” selection (Draper; Smith, 1981), and 10% level of significance was used for the inclusion of independent variables (e.g., temperature and rainfall). The evaluated meteorological factors were maximum and minimum temperatures (°C) and rainfall (mm). Meteorological data were obtained from agrometeorological observations conducted at FCAV/ UNESP. When analyzing meteorological factors, we considered weekly mean temperatures and weekly sum of pluvial precipitation, which were always checked 7 days prior to sampling. Phenological phases of the cultivated plants were determined on the day of sampling, and the dominant phenological phase around each trap was visually observed. The dominant phenological phases were determined using the percentage of individuals verified on the basis of the presence or absence of plants with a determined phenology, according to the methodology used by Bencke and Morellato (2002). This method examines quantitative characteristics at the population level, and it determines the percentage of individuals that experienced a particular phenological event in the
plant population. Phenological phases of soybean were assessed in accordance with the descriptions of Fehr et al. (1971) and the names proposed by Câmara (1998), and phenological stages of corn were assessed on the basis of the names and descriptions reported by Fancelli and Dourado-Neto (2000).
To determine the spatial distribution of A. basistriata, mean (m), variance (s2), indices of dispersion,
and total data were tested to determine whether the data fit Poisson and negative binomial distributions.
Dispersion index:
Variance/mean ratio (I): It is used to measure the deviation of an array of randomness conditions (Equation 1). Values equal to 1 indicate random spatial distributions; values less than 1 denote uniform distributions; and values greater than 1 indicate aggregated distributions (Rabinovich, 1980).
(1)
where s2 = sample variance; = sample mean; x
i = number
of A. basistriatafound in the sample units; and n = number of sample units.
Morisita index (Iδ):Values equal to 1 indicate random distributions, and values greater than or less than 1 denote contagious distributions (Equation 2) (Morisita, 1962).
(2)
(3)
where n = number of sample units; xi = number of A. basistriata found in the sample units; Σxi = sum of individuals present in the sample units.
Randomness tests were calculated (Equation 3):
If
χ
δ2≥X 1 . .;0,05(2n− g l ), the randomness hypothesis is rejected.(
)
(
)
n 2
2
i i 1
x
m
s
I
ˆ
m
ˆ
m
ˆ n 1
=
−
=
=
−
∑
2 2 ( -1) 1 1-1
-
~
n n
i i n
i i
I
x
n
x
x
δ δ
χ
= =
=
+
∑
∑
(
)
(
)
2 1 2 1 1 ( 1) n i ii i i
n i i i i i x x x x I n
x x x x
Coefficient of Green (Cx): Index values range from negative to uniform distributions. Values equal to 0 denote random distributions, and values equal to 1 indicate maximum contagion (Green, 1966). The index is based on variance/mean distributions (Equation 4).
of these specimens were found in soybean and corn and 63, in the refuge area (Table 1). Plots of the grasses Cynodon
spp. and P. maximum yielded the highest number of specimens (19 and 23, respectively) when compared with the plots of the legumes C. mucunoides and Stylosanthes
spp. in the refuge area (Table 1). A. basistriata is a predator that is considered dominant in areas planted with soybean and in natural areas in the state of São Paulo (Cividanes et al., 2009; Martins et al., 2009).
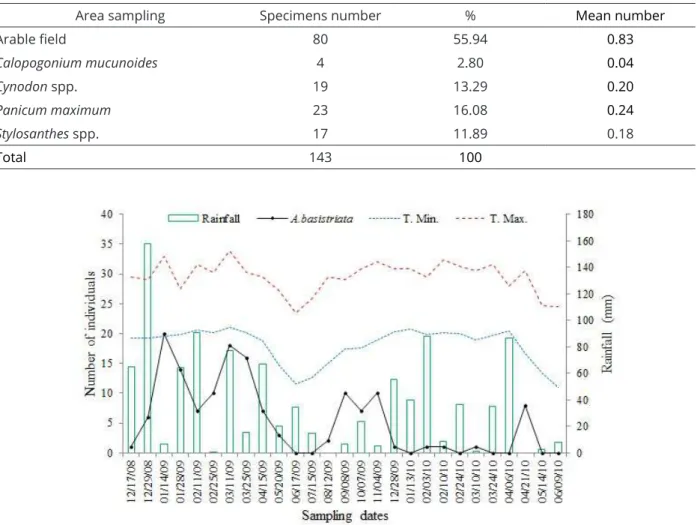
Fluctuation analyses of A. basistriata populations demonstrated that the species was present during most of the study period, and it was only absent during eight of the 27 sampling occurrences. However, the highest population density was observed in the first soybean crop (2008-2009). The results indicate that periods of large A. basistriata populations occurred during high rainfall and high minimum and maximum temperatures. The higher population peaks occurred on 01/14/2009 and 03/11/2009 when the highest maximum temperatures in the study period (32.9 ºC and 33.8 ºC, respectively) were recorded (Figure 2). The influence of weather factors were confirmed using multiple regression analyses, which showed a significant positive regression coefficient with the maximum temperature (parameters: 1.0519; F = 6.09; R2 = 0.1959).
Furthermore, this result explains 19.59% of population variation, so the period with high maximum ambient temperature corresponded with increased population density of A. basistriata.
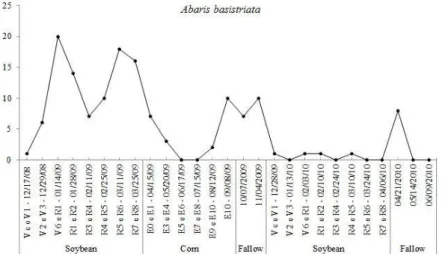
The two highest A. basistriata population peaks occurred when soybean reached the end of the vegetative and early flowering stages (V6 and R1) and during the reproductive stage when the plants produced pods (R5 and R6; Figure 3). Martins et al. (2009) found similar results; the A. basistriata population peaked at the beginning and end of soybean crops. This result suggests that environmental factors recorded during these vegetative stages may have benefited this predator. Among the factors that may influence A. basistriata occurrence is the presence of prey. Didonet et al. (2003) found that populations of
Anticarsia gemmatalis caterpillars mainly peak during the reproductive period of soybean crops.
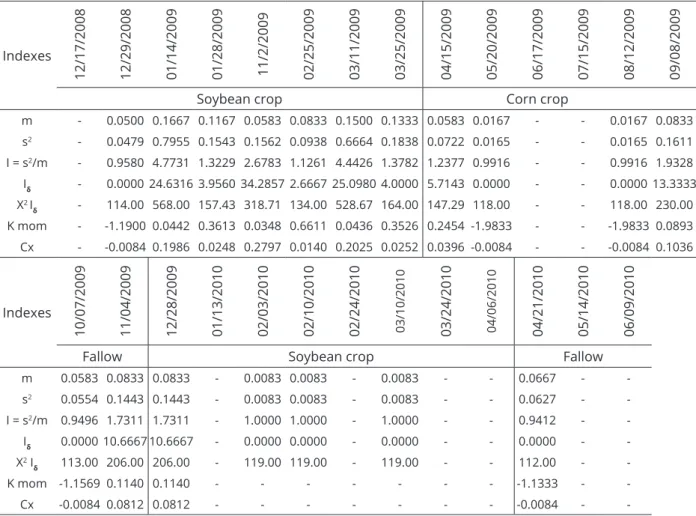
With respect to the spatial distribution of A. basistriata, the variance/mean relationship (I) and the Morisita index (Iδ) values obtained were greater than 1 on 9 dates in the sampling period, coinciding with periods of increased A. basistriata occurrences (Table 2). Therefore, the results indicate that this carabid beetle has aggregate distributions.
2 n
i i 1
s
Cx
1 /
x
1
m
ˆ
=
=
−
−
∑
The k exponent of negative binomial distribution: k is estimated using the method of moments (Equation 5). Negative values indicate uniform distributions, and low, positive values (k < 2) denote a highly aggregate dispersal. k values ranging from 2 to 8 indicate moderate aggregations, and values greater than 8 (k > 8) denote
random arrays (Elliott, 1979).
(4) 2 2
ˆ
ˆ
m
k
s
m
=
−
(5)Probabilistic models for the study of frequency distribution: Data for each sample were tested to see if they fit the Poisson distribution. The assumption is that all species have the same probability of occupying a given space and that the presence of an individual does not affect the presence of another individual; in this case, the variance equals the mean (σ2 > μ) (Barbosa; Perecin,
1982). However, when the variance is greater than the mean (σ2 > μ), individuals aggregate. Therefore, the
presence of an individual increases the chance that there is another on the same unit, which adjusts the negative binomial distribution (Barbosa; Perecin, 1982).
The models were properly adjusted when the observed and expected frequency data had similar values, and the proximity of this data was compared using the chi-square test (Greenwood; Nikulin, 1996).
To illustrate and verify aggregation and spatial distributions, maps of linear interpolation were used. We determined the observed frequency values at the sampling points and the interpolation between points. Surfer 8.0 for Windows software (Golden Software Inc. 2004) was used to plot the interpolation maps.
RESULTS AND DISCUSSION
The values obtained for the k parameter of the negative binomial distribution, estimated using the method of moments, were positive and less than 2 on dates with greater incidences of adult A. basistriata, indicating high aggregation of the beetles. This distribution was confirmed by analyses of the coefficient of Green, which showed values greater than 0 on the same dates; this indicated an aggregate distribution of the population (Table 2). Niemela et al. (1992) found that some carabids in Finnish forests exhibited a clustered distribution (Table 2). In Brazil, Barros et al. (2006) found another carabid (Calosoma granulatum, a cotton crop predator) that showed a clustered distribution pattern.
We initially tested the fit of the data to the probabilistic model of the Poisson distribution. However,
because the average was less than the variance on the dates of higher A. basistriata occurrence (Table 2), we used the negative binomial distribution model.
Only two assessments had sufficient degrees of freedom for the model analyses. Regarding the Poisson distribution, results of the chi-square test were significant at 1% probability, demonstrating that the distribution of these assessments was not random (Table 3). With respect to the negative binomial distribution, results of both assessments were not significant, confirming the aggregate spatial distribution of A. basistriata (Table 3). Results of the adjustments of the probabilistic models analyzed are according to the indexes tested for this beetle.
Table 1: Abaris basistriata specimens sampled in the experimental area. Jaboticabal, SP, 2008, 2009, and 2010.
(% = Percent of the total of specimens; Mean number = number of specimens/number of traps).
Area sampling Specimens number % Mean number
Arable field 80 55.94 0.83
Calopogonium mucunoides 4 2.80 0.04
Cynodon spp. 19 13.29 0.20
Panicum maximum 23 16.08 0.24
Stylosanthes spp. 17 11.89 0.18
Total 143 100
Figure 2: Population fluctuation of Abaris basistriata, rainfall and maximum and minimum temperature during
Figure 3: Population fluctuation of Abaris basistriata in relation to developmental stages of the soybean and corn
crop and fallow periods, Jaboticabal, SP - Brazil. Soybean phenological stages: vegetative = Vc-V6; flowering = R1 and R2; fruiting = R3-R6; maturation = R7 and R8. Corn phonological stages: germination = E0; vegetative = E1-E3; flowering = E4 and E5; fruiting = E6-E8; maturation = E9 and E10.
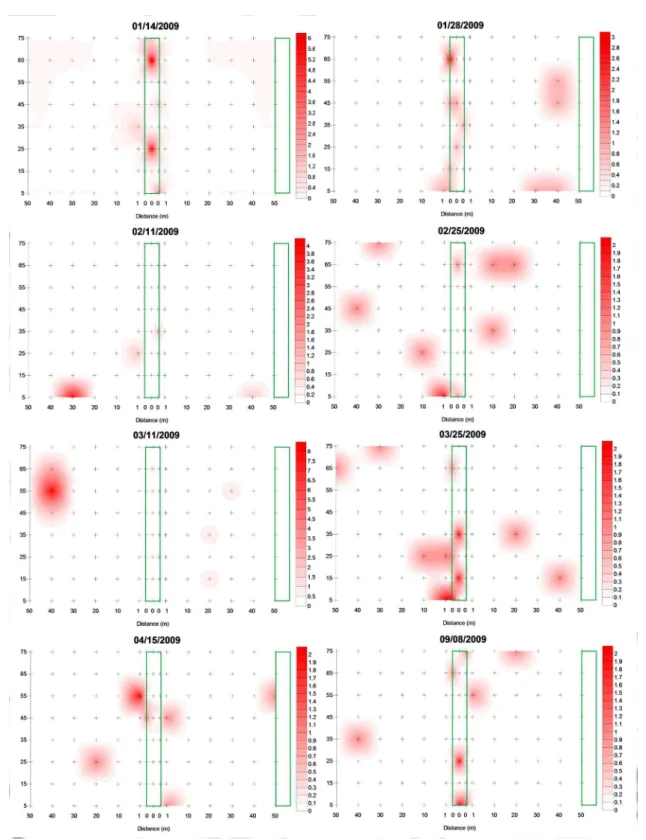
Samples with means lower than the variances were used to obtain linear interpolation maps, which provided a spatial pattern of A. basistriata clustering distribution that was determined by the dispersion index (Figures 4 and 5).
Refuge areas provide resources and shelter for many insect predators in agroecosystems (Altieri; Silva; Nicholls, 2003). A. basistriata exhibited clustering not only in the agricultural area but also in the refuge and nearby areas (Figures 4 and 5). For this species, the refuge area may have provided shelter and facilitated distribution.
Refuge areas established within crop fields serve as shelter
for carabids and other predators, thus contributing to colonization and crop distribution (Collins et al., 2002; Macleod et al., 2004). The high concentrations of A. basistriata in the refuge area indicate that this species is distributed by the agroecosystem from these aggregation points.
Analysis of the aggregation points indicated that
the first peak of the A. basistriata population was found clustered in the refuge area, which may indicate that the predator is distributed from this point. Moreover, the
results revealed peaks on 03/25/2009 and 09/08/2009,
when the cultivated plants were in dehiscence.Therefore,
at the end of the crop season, A. basistriata aggregation points mainly occurred in the refuge area. These results suggest that this beetle returned to colonize the refuge area when crop conditions were unfavorable (e.g., lower incidences of pests and lower plant cover), which indicates better microclimate conditions. Occurrence of carabids in agroecosystems is associated with microclimate conditions
(Döring; Kromp, 2003), and the vegetation structure is fundamental to the composition and distribution of carabid species (French; Elliott, 1999; Weibull; Östman, 2003).
According to Landis et al. (2005), refuge areas can provide shelter for carabids when crop conditions are unfavorable.
Table 2: Means, variances and dispersion indices for the occurrence of Abaris basistriata throughout the sampling period. Jaboticabal, SP.
Indexes
12/17/2008 12/29/2008 01/14/2009 01/28/2009 11/2/2009 02/25/2009 03/11/2009 03/25/2009 04/15/2009 05/20/2009 06/17/2009 07/15/2009 08/12/2009 09/08/2009
Soybean crop Corn crop
m - 0.0500 0.1667 0.1167 0.0583 0.0833 0.1500 0.1333 0.0583 0.0167 - - 0.0167 0.0833
s2 - 0.0479 0.7955 0.1543 0.1562 0.0938 0.6664 0.1838 0.0722 0.0165 - - 0.0165 0.1611
I = s2/m - 0.9580 4.7731 1.3229 2.6783 1.1261 4.4426 1.3782 1.2377 0.9916 - - 0.9916 1.9328
Iδ - 0.0000 24.6316 3.9560 34.2857 2.6667 25.0980 4.0000 5.7143 0.0000 - - 0.000013.3333
X2 I
δ - 114.00 568.00 157.43 318.71 134.00 528.67 164.00 147.29 118.00 - - 118.00 230.00
K mom - -1.1900 0.0442 0.3613 0.0348 0.6611 0.0436 0.3526 0.2454 -1.9833 - - -1.9833 0.0893
Cx - -0.0084 0.1986 0.0248 0.2797 0.0140 0.2025 0.0252 0.0396 -0.0084 - - -0.0084 0.1036
Indexes
10/07/2009 11/04/2009 12/28/2009 01/13/2010 02/03/2010 02/10/2010 02/24/2010 03/10/2010 03/24/2010 04/06/2010 04/21/2010 05/14/2010 06/09/2010
Fallow Soybean crop Fallow
m 0.0583 0.0833 0.0833 - 0.0083 0.0083 - 0.0083 - - 0.0667 -
-s2 0.0554 0.1443 0.1443 - 0.0083 0.0083 - 0.0083 - - 0.0627 -
-I = s2/m 0.9496 1.7311 1.7311 - 1.0000 1.0000 - 1.0000 - - 0.9412 -
-Iδ 0.0000 10.6667 10.6667 - 0.0000 0.0000 - 0.0000 - - 0.0000 -
-X2 I
δ 113.00 206.00 206.00 - 119.00 119.00 - 119.00 - - 112.00 -
-K mom -1.1569 0.1140 0.1140 - - - -1.1333 -
-Cx -0.0084 0.0812 0.0812 - - - -0.0084 -
-m = sa-mple -mean; s2 = variance; I = variance/mean; I
δ= Morisita index; X2 Iδ= chi-squared test of adherence to the values
calculated for the Morisita index; k mom = k calculated by the method of moments; Cx = coefficient of Green.
Table 3: Results obtained using a chi-squared test to adjust the Poisson and negative binomial distribution data
of adult Abaris basistriata. Jaboticabal, SP- Brazil.
Data Poisson Binomial negative
X2 df p X2 df p
01/14/2009 12.65** 1 0.000 2.51ns 1 0.113
03/11/2009 7.88** 1 0.005 1.24ns 1 0.266
Figure 4: Maps of linear interpolation of Abaris basistriata adults during the periods when there was an adjustment
to the models of spatial distribution. The area delimited and the zero distance correspond to the refuge area; the
area delimited on the right is the border of the cultivated area, and the + sign corresponds to the position of the
CONCLUSIONS
Occurrence of A. basistriata in agroecosystems was influenced by meteorological factors (mainly maximum temperature) and reproductive phenological stages of plants. Spatial distribution of the predator is clustered, and establishment of refuge areas contributes to the conservation and dispersal of this beetle species in agroecosystems.
ACKNOWLEDGEMENTS
We thank Alex Antonio Ribeiro and José de Souza Altamiro of the Departamento de Fitossanidade of the Universidade Estadual Paulista (UNESP) in Jaboticabal, SP, for helping with the development of the study. We are grateful to the Fundação de Amparo à Pesquisa do Estado de São Paulo (FAPESP) for providing the PhD scholarship granted to the first author. We also thank the Federal Rural University of Amazonia (UFRA) for the support given to disseminate this study.
REFERENCES
ALTIERI, M. A.; SILVA, N. E.; NICHOLLS, C. I. O papel da
biodiversidade no manejo de pragas. Ribeirão Preto:
Editora Holos, 2003. 226p.
BARBOSA, J. C.; PERECIN, D. Modelos probabilísticos para distribuições de lagartas de Spodoptera frugiperda (J. E.
SMITH, 1797), na cultura do milho. Científica, 10:181-191, 1982.
BARROS, R. et al. Flutuação populacional de insetos predadores
associados a pragas do algodoeiro. Arquivos do Instituto
Biológico, 73(1):57-64, 2006.
BENCKE, C. S. C.; MORELLATO, L. P. C. Comparação de dois métodos de avaliação da fenologia de plantas, sua interpretação e representação. Revista Brasileira
Botânica, 25:269-275, 2002.
CÂMARA, G. M. S. Fenologia da soja. In: CÂMARA G. M. S.
(Ed.). Soja: tecnologia da produção. Piracicaba: Editora
Publique, 1998. p.26-39.
CIVIDANES F. J. et al. Diversidade e distribuição espacial de
artrópodes associados ao solo em agroecossistemas.
Bragantia, 68(4):991-1002, 2009.
COLLINS, K. L. et al. Effects of different grass treatments used to create overwintering habitat for predatory
arthropods on arable farmland. Agriculture, Ecosystems
& Environment, 96:59-67, 2003.
COLLINS, K. L. et al. Influence of beetle banks on cereal aphid predation in winter wheat. Agriculture, Ecosystems &
Environment, 93:337-350, 2002.
DENT, D. Insect pest management. Cambridge: CABI
Publishing, 2000. p.180-233.
DENT, D. Integrated pest management. London: Chapman
& Hall, 1995. p.47-77.
DIDONET, J. et al. Abundância de pragas e inimigos naturais em soja na região de Gurupi, Brasil. Revista Manejo Integrado
de Plagas y Agroecologia, 69:50-57, 2003.
DÖRING, F. T.; KROMP, B. Which carabid species benefit from organic agriculture? a review of comparative studies in winter cereals from Germany and Switzerland. Agriculture,
Ecosystems & Environment, 98(1-3):153-161, 2003.
DRAPER, N. R.; SMITH, H. Applied regression analysis. 2nd
ed. New York: John Wiley, 1981. 709p.
ELLIOTT, J. M. Some methods for the statistical analysis of
sample benthic invertebrates. Ambleside: Freshwater
Biological Association, 1979. 157p.
FANCELLI, A. L.; DOURADO-NETO, D. Ecofisiologia e fenologia. In: FANCELLI, A. L.; DOURADO-NETO, D. Produção de
milho. Guaiba: Agropecuária, 2000. p.21-54.
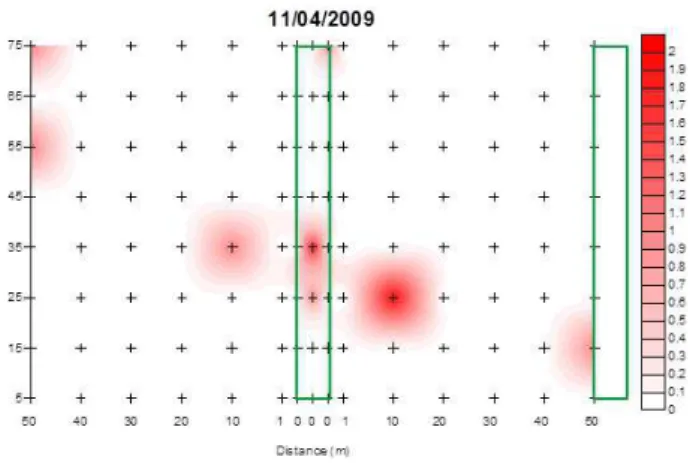
Figure 5: Maps of linear interpolation of Abaris basistriata adults during the periods when there was
an adjustment to the models of spatial distribution. The area delimited and the zero distance correspond
to the refuge area; the area delimited on the right is the border of the cultivated area, and the + sign corresponds to the position of the traps in the soil; darkening indicates a higher density of insects.
FEHR, W. R. et al. Stage of development descriptions for
soybean, Glycine max (L.) Merrill. Crop Science,
11:929-931, 1971.
FRENCH, B. W.; ELLIOTT, N. C. Temporal and spatial distribution of ground beetle (Coleoptera: Carabidae) assemblages in grasslands and adjacent wheat fields. Pedobiologia,
43(1):73-84, 1999.
GREEN, R. H. Measurement of non-randomness in spatial
distributions. Researches on Population Ecology, 8:1-7,
1966.
GREENWOOD, P.; NIKULIN, M. S. A. Guide to Chi-squared
Testing. New York: Wiley, 1996. 304p.
HOLLAND, J. M.; PERRY, J. N.; WINDER, L. The within-field spatial and temporal distribution of arthropods in winter wheat.
Bulletin of Entomological Research, 89:499-513, 1999.
LANDIS, D. A. et al. Manipulating plant resources to enhance
beneficial arthropods in agricultural landscapes. Weed
Science, 53:902-908, 2005.
MACLEOD, A. et al. “Beetle banks” as refuges for beneficial arthropods in farmland: long-term changes in predator
communities and habitat. Agricultural and Forest
Entomology, 6(2):147-154, 2004.
MARTINS, I. C. F. et al. Análise de fauna e flutuação populacional de Carabidae e Staphylinidae (Coleoptera) em sistemas
de plantio direto e convencional. Revista Brasileira de
Entomologia, 53(3):432-443, 2009.
MORISITA, M. Id-index, a measure of dispersion of individuals.
Researches on Population Ecology, 4:1-7, 1962.
NIEMELA, J. et al. Small-scale heterogeneity in the spatial
distribution of carabid beetles in the Southern Finnish
Taiga. Journal of Biogeography, 19(2):173-181, 1992.
LAVANDERO, B. I. et al. Increasing floral diversity for selective enhancement of biological control agents: A double-edged sward? Basic and Applied Ecology, 7:236-243, 2006.
RABINOVICH, J. E. Introducción a la ecologia de poblaciones
animales. México: Continental, 1980. 313p.
THOMAS, C. F. G.; HOLLAND, J. M.; BROWN, N. J. The spatial
distribution of carabid beetles in agricultural landscapes. In:
HOLLAND, J. M. (Ed.). The agroecology of carabid beetles.
Andover: Intercept, 2002. p.305-344.
THOMAS, M. B.; WRATTEN, S. D.; SOTHERTON, N. W. Creation of “island” habitats in farmland to manipulate populations of beneficial arthropods: Predator densities and emigration.
The Journal of Applied Ecology, 28:906-917, 1991.
THOMAS, M. B.; WRATTEN, S. D.; SOTHERTON, N. W. Creation of “island” habitats in farmland to manipulate populations of beneficial arthropods: Predator densities and species
composition. The Journal of Applied Ecology,
29:524-531, 1992.
WEIBULL, A. C.; ÖSTMAN, Ö. Species composition in agroecosystems: The effect of landscape, habitat, and farm