Cardiac index by thermodilution or transthoracic echocardiography in dogs at different hemodynamic states.
Ciência Rural, v.46, n.11, nov, 2016.
2049
Cardiac index by thermodilution or transthoracic echocardiography
in dogs at different hemodynamic states
Índice cardíaco pelos métodos de termodiluição ou ecocardiografia transtorácica em cães sob diferentes situações hemodinâmicas
Martielo Ivan GehrckeI Helena Mondardo CardosoII Doughlas RegalinIII Gizelli da SilvaII Vanessa Sasso PadilhaIV Aury Nunes de MoraesII Nilson OleskoviczII ISSN 1678-4596
Received 03.11.15 Approved 05.22.16 Returned by the author 08.01.16
ABSTRACT
Proper monitoring of cardiac index (CI) in critically ill patients requires accurate and minimally invasive methods. The aim of this study was to compare the CI values obtained by thermodilution or echocardiography using different methods in dogs in different hemodynamic states. Nine dogs weighing 19.6±1.3kg were anesthetized with isoflurane at 1.4V% (Baseline) and subjected to mechanical ventilation (MV),a hypodynamic state (Hypo) with isoflurane at 3.5V% and hyperdynamic state (hyper) with dobutamine infusion at
5μgkg-1min-1. CI analysis was performed by thermodilution
(TD) and using the modified Simpson’s method, aortic velocity-time integral (A-VTI) method and pulmonary VTI (P-VTI) method. We performed Pearson’s correlation and Bland-Altman analysis. The CI values (Lm-2min-1) of the animals in
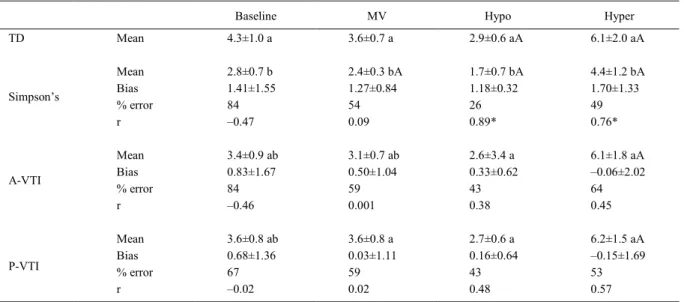
the Baseline, MV, Hypo and Hyper states were 4.3±1, 3.6±0.7, 2.9±0.66 and 6.1±2, for TD; 2.8±0.7, 2.4±0.3, 1.7±0.7 and 4.4±1.2, for Simpson’s method; 3.4±0.9, 3.1±0.7, 2.6±3.4, 6.1±1.8 for A-VTI; and 3.6±0.8, 3.6±0.8, 2.7±0.6 and 6.2±1.5, for P-VTI. The CI values using Simpson’s method were lower than those obtained by TD in all states, and it was observed a significant correlation in the Hypo (r=0.89) and Hyper (r=0.76) groups. In addition,the percent error in the Hypo group using Simpson’s method was 26% relative to TD, which allowed for the identification of the different hemodynamic states. With respect to the other methods and states, there was no agreement or correlation between the methods and TD. We concluded that none of the tested echocardiography methods exhibited acceptable agreement with thermodilution at different hemodynamic states.
Key words: cardiac index, hypotension, echocardiography, bland-altman.
RESUMO
A adequada monitoração do índice cardíaco (IC) em pacientes críticos requer métodos acurados e minimamente invasivos. O objetivo deste estudo foi comparar o IC obtido por termodiluição ou
ecocardiografia em cães sob alterações hemodinâmicas.
Utilizaram-se nove cães pesando 19,6±1,3kg, os quais foram anestesiados com
isofluoranoa1,4V% (Basal) e submetidos à ventilação mecânica (VM) e estados hipodinâmico (Hipo) com isofluoranoa3,5V% e hiperdinâmico (Hiper), com dobutaminaa5µgkg-1min-1. O IC foi obtido
por termodiluição (TD) e pelos métodos ecocardiográficos de Simpson modificado, e pela velocidade em tempo integral (VTI) nas valvas
aórtica (VTI-A) e pulmonar (VTI-P). Realizou-se a análise de correlação
de Pearson e de concordância de Bland-Altman. O IC (Lm-2min-1) nas
fases Basal, VM, Hipo e Hiper foi de 4,3±1, 3,6±0,7, 2,9±0,66 e 6,1±2 para TD; 2,8 ±0,7, 2,4±0,3, 1,7±0,7 e 4,4±1,2 para Simpson; 3,4±0,9, 3,1 ±0,7, 2,6±3,4, 6,1±1,8 para VTI-A e 3,6±0,8, 3,6±0,8, 2,7±0,6 e 6,2±1,5 para VTI-P. O método de Simpson foi menor que a TD em todas
as fases, mas com correlação significativa nos estados Hipo (r=0,89)
e Hiper (r=0,76) e percentagem de erro de 26% no Hipo em relação
à TD, identificando os diferentes estados hemodinâmicos. Nos demais, não houve concordância ou correlação com a TD. Conclui-se que nenhum dos métodos testados apresentou concordância aceitável com a termodiluição nos diferentes estados hemodinâmicos.
Palavras-chave: índice cardíaco, hipotensão, ecocardiografia,
band-altman.
INTRODUCTION
The monitoring of cardiac index (CI), equal tocardiac output (CO) to body surface area and
IDepartamento de Clínicas Veterinárias, Faculdade de Veterinária, Universidade Federal de Pelotas (UFPEL), Av. Eliseu Maciel, S/N,
Jardim América, 96010-610, Capão do Leão, RS, Brasil. E-mail: martielogehrcke@hotmail.com. *Corresponding author.
IIDepartamento de Medicina Veterinária, Centro de Ciências Agroveterinárias (CAV), Universidade do Estado de Santa Catarina
(UDESC), Lages, SC, Brasil.
IIIDepartamento de Medicina Veterinária, Universidade Federal de Goiás (UFG), Jataí, GO, Brasil.
IVDepartamento de Medicina Veterinária, Universidade Federal de Santa Catarina (UFSC), Curitibanos, SC, Brasil.
provides valuable information on the hemodynamic state and supply a demand of tissue oxygen. Thermodilution (TD) method, which is currently accepted as the most reliable method, is associated with some complications, including arrhythmias, vascular injury, infections and systematic errors related to the hemodynamic state and the level of experience of the intensive care professional (ANOV et al., 2000; YANG et al., 2013).
Conversely, transthoracic echocardiography is used for the analysis of cardiac function and for the determination of the CO using different methods. The most common methods to determine CO include the
modified Simpson’s method, which uses the
two-dimensional mode and the estimation of ventricular
volume, and the methods that use the ventricular outflow
velocity-time integral (VTI) with the Doppler function (DAY et al., 2007; SERRES et al., 2008; ANAVEKAR & OH, 2009; PARK et al., 2012). However, there are discrepancies in the literature to which method is more effective because of the lack of data uniformity, and reports vary depending on the experience of the examiner (DAY et al., 2007; SERRES et al., 2008; ANAVEKAR & OH, 2009) and on the adequacy of the statistical analysis used (BLAND & ALTMAN, 1999; CRITCHLEY & CRITCHLEY, 1999).
In normovolemic dogs and in dogs after hemorrhagic shock, DAY et al. (2007) observed a low correlation and agreement between TD and transthoracic echocardiography using the VTI method in different
outflow tracts. LOPES et al. (2010) reported a high
correlation and adequate agreement between TD and transthoracic echocardiography using the VTI method in the pulmonary valve of dogs anesthetized with propofol, emphasizing the need to use accurate equipment and a trained operator to decrease variations and errors. However, the absence of hemodynamic interventions was one of the limitations of the study. With respect to
the modified Simpson’s method, only PARK et al. (2012)
compared this method with TD in dogs but did not perform an appropriate statistical analysis (BLAND&ALTMAN, 1999; CRITCHLEY & CRITCHLEY, 1999).
Therefore, this study aimed to evaluate the agreement and correlation of CI values by TD and transthoracic echocardiography using the
modified Simpson’s method, aortic VTI method,
and pulmonary VTI method in dogs under different hemodynamic states.
MATERIALS AND METHODS
A total of nine adult male dogs were obtained from non-governmental organizations.
The dogs weighed 19.6±1.3kg on average and were neutered and sent for adoption at the end of the study. The study animals were subjected to clinical examination and blood research included complete blood count (CBC) and limited chemistry profile with renal (Blood Urea Nitrogen -
BUN and Creatinine) and liver profile (albumin,
alkaline phosphatase, alanine aminotransferase, aspartate aminotransferase, and gamma-glutamyl aminotransferase), and echocardiographic examination to detect changes that could potentially compromise the study. The cervical, left paracostal, and metatarsal regions were shaved, and animals were fasted for 12 hours prior to procedure.
General anesthesia was induced with propofol at a dose of 8mgkg-1 intravenously, after
which the animals were intubated and maintained on
general inhalation anesthesia using 2% isofluraneand 60% oxygen as the diluent gas at a flowrate of
50mLkg-1min-1on spontaneous ventilation; animals
were kept in the left lateral decubitus position on a thermal mattress. The metatarsal or coccygeal arteries were accessed with a 22-G venous catheter made of Vialon, and the mean arterial pressure (MAP) was measured with a pressure transducer connected to a multiparameter monitor. After local anesthetic blockade using 2% lidocaine in the right jugular vein puncture site, thorough antisepsis was performed, and a 5F Swan-Ganz catheter was inserted using a 6F
introducer kit after confirming the proper insertion of
the catheter in the pulmonary artery by pulse wave analysis. At the end of the instrumentation, anesthesia
was maintained with isoflurane at 1.4%.Animals were
stabilized for 15 minutes using a 60% inspired oxygen fraction on spontaneous ventilation (baseline).The procedure lasted an average of 30 minutes.
Thermo dilution CO was calculated after administration of 3mL of saline at 0-5ºC in the proximal catheter segment, and three consecutive measurements were made, allowing a maximum variation of 10% between measurements. For echocardiographic analyses, the transducer was positioned in the 3rd intercostal space in the left
cranial view for the analysis of the pulmonary valve. In the 5th intercostal space and in the left 5-chamber
apical view for the analysis of the aortic valve, In the 5th intercostal space and in the left 4-chamber apical view for analysis using the modified Simpson’s
method.Velocity-time integrals (VTIs) were measured in the aortic and pulmonary valves using the Doppler function. CO was calculated as the product of VTI, the sectional area of the aortic or pulmonary valves, and
determined using the equipment’s software, taking
into account the end systolic and diastolic volumes by manual delimitation of the left ventricular borders by an examiner with experience in echocardiographic analysis. The CIs were calculated based on CO using different methods and body surface area.
After the measurement of CO at baseline using different methods, the hemodynamic interventions were initiated, allowing a 15-minute stabilization period in each state before CO
measurement. In the first intervention, mechanical
ventilation (MV) was performed with an inspiratory pressure of 12mmHg, tidal volume of 12mLkg-1,
and frequency of 10 strokes per minute; after this period, the animals remained under MV without adjustments until the completion of the study. Subsequently, the hypodynamicstate (Hypo) was initiated, and hypotension was induced with
isoflurane at 3.5% and MAP <50mmHg. At the
end of this state, the animals were stabilized with
isoflurane at 1.4% and MAP>60mmHg for 15
minutes. Later, the hyperdynamic state (Hyper) was induced by continuous infusion of dobutamine at a
rate of 5μgkg-1min-1 for 5 minutes and MAP at least
30% higher than at baseline.
Statistical analysis was performed using repeated-measures analysis of variance
(RM-ANOVA) followed by Dunnett’s test to evaluate
the differences between the hemodynamic states
using the same method or Tukey’s test to evaluate differences between methods (P≤0.05).
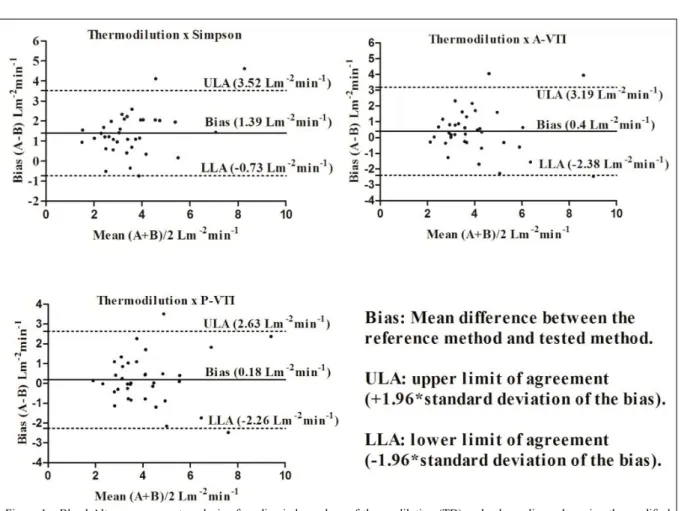
Bland-Altman agreement was evaluated by calculating the mean bias between the methods (mean difference between the reference method and tested method) and the means between methods, and these values were plotted on a scatterplot. Lower limit of agreement (LLA) and upper limit of agreement (ULA) was calculated as ± 1.96 times the standard deviation of the mean bias (SDbias). The error percentage was calculated as the relationship between the agreement interval and the mean of the values obtained using each method (1.96 x SDbias/mean between each
method). Furthermore,significant correlations were calculated by Pearson’s correlation.
RESULTS AND DISCUSSION
There were no statistical difference between the dogs with de same method at baseline, MV, hypo and hyper and all animals recovered with no complications from the protocol. The median MAP values (mmHg) were 71 (65-79) in baseline, 74 (62-68) in MV, 43 (31-49) in Hypo and 99 (79-124)
in Hyper, remaining within the pre-defined values.
However, the greater variability of results at baseline may be the result of individual respiratory frequency variation which compromises the assessment. This was corrected after the VM.
The mean values and standard deviations for CI using TD compared with the echocardiographic methods are presented in table 1. The CI values using
the Simpson’s method were 30% to 40% lower than
those obtained with TD in all states and lower than those obtained with the other echocardiographic
methods since the MV. No significant differences
were observed between the aortic and pulmonary VTI methods compared with TD.
With respect to the Pearson’s correlation, only the modified Simpson’s method exhibited a significant correlation with TD in the hypo- and
hyperdynamic states (Table 1). The Bland-Altman analysis indicated lower bias values for the aortic and pulmonary VTI methods in the different states (Table 1) and according to the graphical analysis in which all states were considered (Figure 1); however, these values exhibited large standard deviations, which generated too broad limits of agreement between the methods tested. With respect to the mean error percentage, none of the methods
tested were equivalent to TD, except Simpson’s
method in the hypodynamic state (Table 1).
In the available literature, the P-VTI method is considered the most accurate compared with TD; whereas, A-VTI did not exhibit adequate agreement (DAY et al., 2007; LOPES et al., 2010).
Furthermore, Simpson’s method appeared to be worse than the out flow methods (PARK et al., 2012).
However, in this study, it was possible to assess the importance of data analysis in interpreting the results. By analyzing the means and bias using Bland-Altman agreement analysis, P-VTI seemed to have the best
results due to the lack of a significant difference
with TD and a low bias. However, the analysis of the error percentage and the limits of agreement between the methods revealed that these limits were outside those considered clinically acceptable for
method substitution. Due to this findings we can’t use
interchangeably Simpson and P-VTI.
In addition, when analyzing CI changes in the different hemodynamic states, one of the points
to be considered is that only Simpson’s method
followed the changes observed in TD and yielded
significantly different results among the states (Table
the true CO values obtained by direct measurement
of the aortic outflow in experimental models
(CRITCHLEY&CRITCHLEY, 1999; YANG et al.,
2013). However, the ability of Simpson’s method to
identify the different hemodynamic states allowed it to be used as a therapeutic guide; thus, these data become important when one wishes to monitor patient progression during treatment.
CRITCHLEY & CRITCHLEY (1999) conducted a meta-analysis of studies on humans and animals using different methods for the measurement of CO compared with TD and reported that
correlation coefficient did not provide concrete data
to allow the establishment of agreement between methods. Bland-Altman agreement analysis was mandatory (BLAND & ALTMAN, 1999), and error percentages should not be higher than 30% for equivalent methods. In the present study, only
Simpson’s method exhibited adequate agreement
with TD in the hypodynamic state.
The main errors related to the accuracy in the evaluation of CO using echocardiographic
methods included the proper identification of the cardiac structures and the examiner’s experience with
the method (DAY et al., 2007; ANAVEKAR & OH, 2009). This fact becomes even more important when
the efficiency of transesophageal echocardiography
is compared transthoracic echocardiography (YAMASHITA et al., 2007) due to the proximity and
definition of the cardiac structures analyzed. In this
study the evaluator was a cardiologist blinded to TD values to try to reduce the error.
With respect to transthoracic echocardiography, two studies obtained distinct results using pulmonary VTI. DAY et al. (2007) reported that the mean differences varied between -0.47 and 0.35Lmin-1 depending on the region in which the flow
rate was measured (aorta or pulmonary); however, these differences exhibited large deviations, which increased the agreement intervals and indicated a low agreement with TD. By contrast, LOPES et al. (2010) reported with the measurement of CO by analysis of the pulmonary valve was more accurate, with a mean difference of -0.04Lmin-1compared with TD and an
error percentage of 26%, in contrast to 0.87Lmin-1
and an error percentage of 54% in the analysis of the aortic valve. Authors reported that the divergence of data in the literature is due to differences in the level of experience of the examiner as well as the degree of reliability in evaluating the ultrasound views of the
ventricular outflow area in question.
The determination of CO using volumetric
methods (modified Simpson’s method) has been
reported to exhibit limited accuracy because these
Table 1 - The means and standard deviations of the cardiac index (CI) (Lm-2min-1), the mean difference (bias) (Lm-2min-1) and standard
deviation, the percentage error and Pearson's correlation coefficient (r) calculated using thermodilution (TD) .The modified
Simpson’s method, the aortic VTI (A-VTI) method, or the pulmonary VTI (P-VTI) method in dogs anesthetized with isoflurane
(baseline), those under mechanical ventilation (MV), those in a hypodynamic state (hypo), and those in a hyperdynamic state (hyper).
Baseline MV Hypo Hyper
TD Mean 4.3±1.0 a 3.6±0.7 a 2.9±0.6 aA 6.1±2.0 aA
Mean 2.8±0.7 b 2.4±0.3 bA 1.7±0.7 bA 4.4±1.2 bA
Bias 1.41±1.55 1.27±0.84 1.18±0.32 1.70±1.33
% error 84 54 26 49
Simpson’s
r –0.47 0.09 0.89* 0.76*
Mean 3.4±0.9 ab 3.1±0.7 ab 2.6±3.4 a 6.1±1.8 aA
Bias 0.83±1.67 0.50±1.04 0.33±0.62 –0.06±2.02
% error 84 59 43 64
A-VTI
r –0.46 0.001 0.38 0.45
Mean 3.6±0.8 ab 3.6±0.8 a 2.7±0.6 a 6.2±1.5 aA
Bias 0.68±1.36 0.03±1.11 0.16±0.64 –0.15±1.69
% error 67 59 43 53
P-VTI
r –0.02 0.02 0.48 0.57
A: Difference from the baseline after Dunnett’s test (P 0.05). Lowercase letters: Difference between the methods after Tukey’s test (P 0.05). *
: Significant using Pearson's correlation coefficient (P 0.05).
≤
methods depend on the image quality to define the
ventricular borders (AXLER et al., 2003). For this
reason, most studies used outflow methods with
Doppler function. However, SERRES et al. (2008)
reported a low coefficient of variation of the modified Simpson’s method for evaluating diastolic dysfunction
in dogs. Authors also underscored the need to consider intra-observer variability, which can be a source of error. PARK et al. (2012) compared the evaluation of CO in dogs by TD or echocardiography using manual or
automated modified Simpson’s methods and using the aortic outflow method. The authors reported significantly higher
CO values using TD compared with echocardiographic
techniques, and the mean CO values using aortic outflow
methods were similar to those obtained with TD, similar to the results of the present study. However, data analysis
based on correlation coefficients and on the analysis of the
means cannot be used to evaluate the accuracy of these methods (CRITCHLEY & CRITCHLEY, 1999).
In this study, the same method that exhibited excellent accuracy in the study of LOPES
et al. (2010) did not demonstrate satisfactory results.
This discrepancy can be attributed to the difficulty
in performing the examinations, which led to the low accuracy observed. The examiner had experience in echocardiography and evaluation of CO using the
modified Simpson’s method but reported difficulty using the outflow methods because of the positioning
of the transducer and the limited access to the cardiac structures due to the limited intercostal window and chest conformation of the animals. KAMAL et al. (1990), Abbott and MacLEAN (2004), and DAY et al. (2007) reported problems with the adequate positioning of the probe and the correct calculation
of the diameter of the outflow tract, which can
increase error exponentially.
The methodologies used in this study and in the studies of DAY et al. (2007), LOPES et al. (2010), and PARK et al. (2012) differed, may explain the divergent results obtained. None of the previous studiesusedthe different methods under different hemodynamic states, which restricts their results to
Figure 1 - Bland-Altman agreement analysis of cardiac index values of thermodilution (TD) and echocardiography using the modified Simpson’s method, aortic VTI (A-VTI) method, and pulmonary VTI (P-VTI) method in anesthetized dogs in different
a particular clinical condition. Moreover, the present study observed the best results in the hypodynamicstate,
possibly owing to ease identification of cardiac
structures due to decreased heart rate.
Therefore, the fact that Simpson’s method is sufficiently sensitive to detect changes in the hemodynamic state and to correlate with Simpson’s
method in the hypo - and hyperdynamic states. This suggests that with its own reference values and without extrapolating TD data, this method can be used to monitor patient outcomes based on therapeutic goals and in the percentage increase or decrease in CO. CAPOMOLLA et al. (2005) used echocardiography and cardiac catheterization to determine the therapeutic goals in patients with decompensated heart disease and reported that the method can be safely used for patient monitoring because it revealed the same hemodynamic changes as the pulmonary artery catheter.
CONCLUSION
Considering the methodology and analyses proposed in this study, we concluded that none of the tested echocardiography methods exhibited acceptable agreement with thermodilution at different hemodynamic states.
BIOETHICS AND BIOSSECURITY COMMITTE APPROVAL
This study was approved by the Ethics Committee on Animal Experimentation from the host institution under protocol No. 1.36.13.
REFERENCES
ABBOTT, J.A. et al. Comparison of Doppler-derived peak aortic velocities obtained from subcostal and apical transducer sites in healthy dogs. Veterinary Radiology and Ultrasound, v.44, n.6,
p.695-698, 2003.Available from: <http://onlinelibrary.wiley.com/ doi/10.1111/j.1740-8261.2003.tb00533.x>. Accessed: Sept. 2014.
doi: 10.1111/j.1740-8261.2003.tb00533.x.
ANAVEKAR, N.S.; OH, J.K. Doppler echocardiography: a contemporary review. Journal of Cardiology, v.54, n.3,
p.347-358, 2009. Available from: <http://www.sciencedirect.com/ science/article/pii/S0914508709002731>. Accessed: Aug. 2014.
doi: 10.1016/j.jjcc.2009.10.001.
ANOV, R. et al. The incidence of major morbidity in critically ill patients managed with pulmonary artery catheters: a meta- analysis. Critical Care Medicine, v.28, p.615-619, 2000. Available from: <http://www.
ncbi.nlm.nih.gov/pubmed/10752803>. Accessed: Aug. 2014.
AXLER, O. et al. Comparison of cardiac output measured with echocardiographic volumes and aortic Doppler methods during mechanical ventilation. Intensive Care Medical, v.29, n.2,
p.208-217, 2003. Available from: <http://www.ncbi.nlm.nih.
gov/pubmed/12541152>. Accessed: Sept. 2014. doi: 10.1007/
s00134-002-1582-1.
BLAND, J.M.; ALTMAN, D.G. Measuring agrément in method comparison studies. Statistical Methods in Medical Research,
v.8, p.135-160, 1999. Available from: <http://www.ncbi.nlm.nih. gov/pubmed/10501650>. Accessed: Aug. 2014.
CAPOMOLLA, S. et al. Echo-Doppler and clinical evaluations to
define hemodynamic profile in patients with chronic heart failure:
accuracy and influence on therapeutic management. Heart
Failure, v.7, p.624-630, 2005. Available from: <http://www.
ncbi.nlm.nih.gov/pubmed/15921804>. Accessed: Sept. 2014.doi:
10.1016/j.ejheart.2004.07.013.
CRITCHLEY, L.A.H.; CRITCHLEY, J.A.J.H. A meta-analysis of studies using bias and precision statistics to compare cardiac output measurement techniques. Journal of clinical Monitoration, v.15,
p. 85-91, 1999. Available from: <http://www.ncbi.nlm.nih.gov/ pubmed/12578081>. Accessed: Aug. 2014.
DAY, T.K. et al. Lack of agreement between thermodilution and echocardiographic determination of cardiac output during normovolemia and acute hemorrhage in clinically healthy, anesthetized dogs. Journal of Veterinary Emergency and Critical Care, v.17, n.1, p.22-31, 2007. Available from: <http://
onlinelibrary.wiley.com/doi/10.1111/j.1476-4431.2006.00208.x>.
Accessed: Aug. 2014.doi: 10.1111/j.1476-4431.2006.00208.x.
KAMAL, G.D. et al. Inconsistent esophageal Doppler cardiac output during acute blood loss. Anesthesiology, v.72,
p.95-99, 1990. Available from: <http://www.ncbi.nlm.nih.gov/
pubmed/2404431. Accessed: Sept. 2014.
LOPES, P.C.F. et al. Comparison between two methods for cardiac output measurement in propofol-anesthetized dogs: thermodilution and Doppler. Veterinary Anaesthesia and Analgesia, v.37, n.5, p.401-408, 2010. Available from: <http://
www.ncbi.nlm.nih.gov/pubmed/20712606>. Accessed: Aug.
2014. doi: 10.1111/j.1467-2995.2010.00552.x.
PARK, K. et al. Comparative evaluation of cardiac output using echocardiography in beagle dogs. Journal of Veterinary Clinics, v.29, n.5, p.384-390, 2012.
SERRES, F. et al. Comparison of 3 ultrasound methods for quantifying left ventricular systolic function: correlation with disease severity and prognostic value in dogs with mitral valve disease.
Journal of Veterinary Internal Medicine, v.22, p.566-577, 2008.
Available from: <http://www.ncbi.nlm.nih.gov/pubmed/18466240>.
Accessed: Sept.2014. doi: 10.1111/j.1939-1676.2008.0097.x.
YANG, X.X. et al. Systematic error of cardiac output measured by bolus thermodilution with a pulmonary artery catheter
compared with that measured by an aortic flow probe in a pig
model. Journal of Cardiothoracic and Vascular Anesthesia,
v.27, n.6, p.1133-1139, 2013. Available from: <http://www.ncbi. nlm.nih.gov/pubmed/24035141>. Accessed: Aug. 2014. doi:
10.1053/j.jvca.2013.05.020.
YAMASHITA, K. et al. Minimally invasive determination of cardiac output by transthoracic bioimpedance, partial carbon dioxide rebreathing, and transesophageal Doppler echocardiography in beagle dogs. Journal of Veterinary Medical Science/the Japanese Society of Veterinary Science, v.69, n.1, p.43-47, 2007. Available from: <http://