Copyright: This is an open-access article distributed under the terms of the Creative Commons Attribution License®, which permits unrestricted use, distribution, and reproduction in any medium, provided that the original author and source are credited.
Introduction
In the last decades, it was observed an increasing prevalen-ce of overweight and obesity in children and adolesprevalen-cents from low-income and middle-income countries (LMIC)1, 2. These data reinforce that youth obesity is a global pande-mic2, with moderate-to-high estimates of tracking3,4, and demonstrated an eventual worsening in health conditions
in children living in LMIC. Moreover, this highlight that the exposure to obesity during childhood and adolescence have been contributing to an increase of the public ex-pending for the treatment of the related problems and an increase risk of early mortality in adulthood5,6.
Lifestyle changes are placed as one of the determi-nants responsible for the rapid increase in the number of
Sedentary behavior and body composition in
children of low-and mid-income countries: a review
Comportamento sedentário e composição corporal em crianças de países de baixa
e média renda: uma revisão
AUTHOR’S
Paulo Henrique Guerra1,2
Evelyn Helena Corgosinho Ribeiro2
Ana Carolina Barco Leme3
Jorge Mota4
José Cazuza de Farias Júnior5
Alex Antonio Florindo1,2
1 University of Sao Paulo, School of Arts, Sciences and Humanities, Sao Paulo, SP, Brazil.
2 University of Sao Paulo, Physical Activity Epidemiology Group, Sao Paulo, SP, Brazil. 3 University of Sao Paulo, Faculty of Public Health, Sao Paulo, SP, Brazil.
4 University of Porto, Faculty of Sport, Porto, Portugal.
5 Federal University of Paraiba, Health Sciences Centre, Joao Pessoa, PB, Brazil.
CORRESPONDING Paulo Henrique Guerra
Avenida Arlindo Béttio, no1000, Ermelino Matarazzo, São Paulo, SP, Brasil. CEP: 03828-000.
DOI
10.12820/rbafs.23e0002
ABSTRACT
This study reviewed the relationship between sedentary behavior (SB) and body composition in children and adolescents from low-and-mid income countries (LMIC). A systematic review was developed through manual and electronic searches in eight databases. Were included observational studies conducted in LMIC, with children and adolescents from three to 19 years. As results, 39 original articles were found (37 cross-sectional, 1 case control study and 1 cohort), which in all presented 75 analyzes, most of them based on screen behaviors (n = 71; 94.7%). At all, 15 of 25 analyses showed risk associations between SB and unfavorable body composition. When focusing on the dose of sedentary behavior, risk associations were verified in distinct cutoff points: 1h/d (3 of 3 analyses); 2h/d (9 of 16); 3h/d (2 of 5); 4h/d (4 of 5) and 5h/d (3 of 6). Television time was the SB type most frequently associated as risk in all categories. In conclusion, recognition of these associa-tions is important both to support future studies and for its dissemination in preventive messages in the population of interest. Also, further longitudinal studies are necessary for narrowing the casual relationships between the variables.
Keywords: Child; Adolescent; Sedentary lifestyle; Pediatric obesity; Review.
RESUMO
Este estudo revisou as relações entre o comportamento sedentário (CS) e composição corporal em crianças e adolescentes de países de renda baixa e média. Uma revisão sistemática foi desenvolvida por meio de buscas manuais e eletrônicas em oito bases de dados eletrônicas. Foram incluídos estudos observacionais conduzidos nos países de renda baixa e média, envolvendo crianças entre três e 19 anos de idade. Como resultados, 39 artigos originais foram encontrados (37 transversais, 1 caso-controle e 1 coorte), que, ao todo, apresentaram 75 análises, sendo a maioria delas baseadas em comportamentos de tela (n = 71; 94,7%). No geral, 15 de 25 análises apresentaram associações de risco entre o CS e composição corporal desfavorável. Quando analisadas doses de comportamento sedentário, associações de risco foram verificadas em distintos pontos de corte: 1h/d (3 de 3 análises encontradas); 2h/d (9 de 16); 3h/d (2 de 5); 4h/d (4 de 5) e 5h/d (3 de 6). O tempo de televisão foi o tipo de CS mais frequentemente associado enquanto risco em todas as categorias. Concluindo, o reconhecimento destas associações é importante tanto para o suporte de futuros estudos, assim como para sua disseminação em mensagens preventivas na população de interesse. Também, estudos longitudinais são necessários para estreitamento das relações causais entre as variáveis.
overweight children that live in LMIC2. As observed in high-income countries, there is an increase in the preva-lence of children and adolescents with inadequate eating behaviors (i.e., higher intake in the sugar and sweets, and oils and fats groups)7, reduced levels of moderate-vigorous physical activity8 and, more recently, demonstrated the higher exposure to sedentary behaviors (SB)9. Those be-haviors have been pointed as the main risk factors that con-tribute to the increase of the pediatric obesity prevalence.
In turn, SB is a group of behaviors that have energy expenditure similar to resting level (≤ 1.5 MET), gen-erally happen with the body in a sitting or reclining position10,11. In children and adolescents, SB has as its main interlocutor the screen-based activities (i.e. use of television and computer/internet and non-active vide-ogames)10, 11. There is a consensus in the literature that SB is a distinct behavior in relation to physical inactivi-ty, being that it presents determinants and implications for the health12–14, as well as their health consequences15.
However, the majority of the available evidence that demonstrates risk associations between higher expo-sures of SB and high body composition in studies devel-oped in high-income countries16, 17. Looking to expand the limits of this debate, we seek, in previous study, to raise the variables more common associated with high exposure to SB in Brazilian children and adolescents9. As the main findings of this study, also, was observed the existence of consistent associations between SB and unfavorable body composition9. This evidence was the starting point for us to hypothesize that those asso-ciations also can be observed in other countries with similar economic conditions. Thus, the purpose of this study was to review and appraise original findings that analyzed the relationship between SB and body com-position in children and adolescents from LMIC.
Methods
This review is registered in the International Prospec-tive Register of Systematic Reviews -PROSPERO (CRD42014014107). The operational process and its report were based on PRISMA statement18.
It was previously established that the scientific arti-cles that adequately meet the following criteria would compose the synthesis of this current review: (i) have observational design (cross-sectional, case-control or co-hort); (ii) data collected in LMIC, in accordance with the classification of the World Bank (Gross National In-come per capita of US$ ≤ 12.7), regardless of their rep-resentativeness (local, regional and national); (iii) report
the assessment of SB for their total time, screen time or by a specific type (e.g., TV time, computer, videogame ), in a certain domain (e.g., leisure time, school period) or combination (e.g., time sitting at school and at leisure), regardless if assessed in an objective way (i.e. accelerom-eter, ACTIVPal®) or by questionnaire, or both, as an exposure or an outcome variable; (iv) involve sample of children and/or adolescents in the range of three to 19 years of age, or with mean age in this interval, and (v) have its report in English, Italian, Portuguese or Spanish. Were not included studies that used the term “sedentary” as synonymous of the absence of physical activity (or in-sufficient physical activity) or studies aimed to clinical groups (e.g. with type II diabetes or hypertensive), with exception for those that presented samples with children and/or adolescents with overweight and/or obesity.
The relevant articles were searched in eight electronic databases: CINAHL, Physical Education Index, Psy-cINFO, PubMed, SciELO, SCOPUS, SPORTDiscus e Web of Science, with reference to the initial search realized in PubMed: ((((((((((((sedentary behavior[-Text Word]) OR sitting time[behavior[-Text Word]) OR sitting activit*[Text Word]) OR television [Text Word]) OR computer [Text Word]) OR videogame[Text Word]) OR screen time[Text Word]) OR screen activit*[Text Word])) AND (((((((((normal weight[Text Word]) OR overweight[Text Word]) OR obese[Text Word]) OR obesity[Text Word]) OR body mass index[Text Word]) OR bmi[Text Word]) OR anthropometr*[Text Word]) OR waist circumference[Text Word]) OR skinfold thickness[Text Word])) AND ((((correlate*[Text Word]) OR predictor*[Text Word]) OR associated factor[Text Word]) OR determinant*[Text Word]))). Were included the references available in the literature until 25th De-cember 2015. Also, manual searches for potential studies were conduced in reference lists of assessed papers.
Risk of bias was assessed by an adapted 17-point ver-sion of Quality Assessment Tool for Quantitative Studies of Effective Public Health Practice Project (EPHPP)19. Original papers were assessed by seven methodological domains: (a) selection bias (characteristics of samples in relation to the review target population); (b) study de-sign (information about study representativeness; sam-pling methods); (c) confounders (control of relevant confounders in analyses); (d) blinding (of outcome as-sessor and participants); (e) information about tools that evaluated the SB (report of its previous validation and Information that would make it possible to reproduce the SB assessment); (f) Flow of people throughout the
study (report in terms of numbers and/or reasons and percentage of participants completing the study) and (g) analyses (the use of appropriate methods for analyses). The risk classification (low, moderate and high risk of bias) was done based on the distribution of studies.
Data extraction was realized in an electronic spread-sheet, in which the information was clustered in three domains: (a) descriptive data (name of study, local of re-alization, year of data collection, sample method, sample size, percentage of girls in the sample and age group); (b) methods (type of study, dependent variable of the re-search, type of SB assessed, cutoff to the risk exposure, tool used to assess the sedentary behavior, obesity pred-itor measures, method used to analyzed the associations and the effect measured employed), and (c) description of the results (e.g. cutoff point used, and its magnitude). The procedures of the assessments articles (titles, abstracts and full texts), data extraction and syntheses elaboration were realized by two researchers, in an independently way (ER, PG), with permanent consultation of a third reviewer in the case of doubts and disagreement (AF).
Results
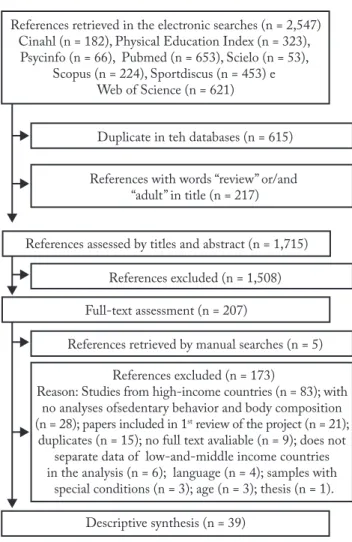
The searches in eight databases identified 2,547 po-tential references (Figure 1). After identification and exclusion of duplicates, reviews and studies with adult samples (n = 832), 1,715 were assessed by its titles and abstracts. As a result of this evaluation, 207 studies re-mained in the review, which were added to the five stu-dies identified by the manual searches in reference lists.
At the end of full text assessment, 173 references were not eligible, with the main reasons: studies developed in high-income countries (n = 83; 48%) and studies that did not assess associations between sedentary behaviors and body composition (n = 28; 16.2%). Therefore, a to-tal of 39 original studies met the inclusion criteria and composed the descriptive synthesis20–58 (Figure 1).
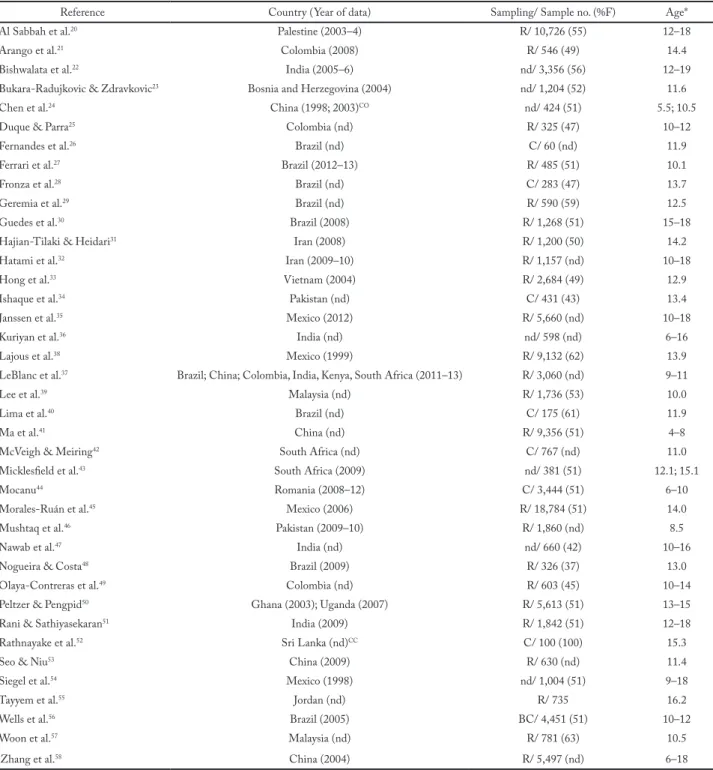
Included studies were conducted in eighteen coun-tries of four continents (Africa, Americas, Asia and Eu-rope). By time, were aggregated data collected among 1999 and 2013. Thirty-seven studies used across-sec-tional design (94.9%), one used a case-control design52 and one used a cohort design54 (Table 1).
Random methods were employed in sampling pro-cesses of 24 articles (61.5%). By sample sizes, there was variation among 6026 and 18,78445 participants. By sex, the majority of the studies have larger percentage of girls compared to boys (n = 21; 53.9%). One study had
a sample composed only by girls52 (Table 1).
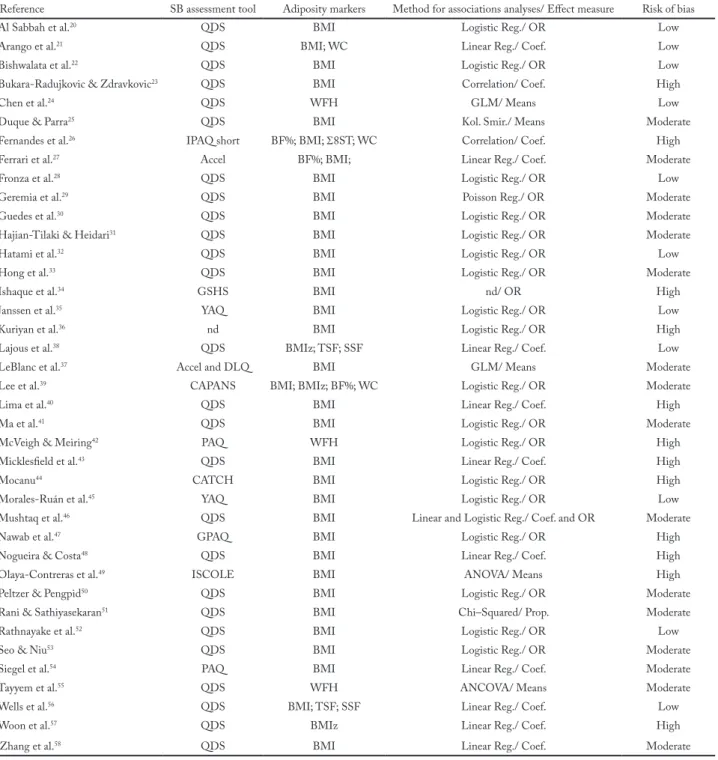
Thirty-six studies assessed SB by questionnaires (92,3%) and in one by accelerometer27. In LeBlanc et al.37, SB was assessed both by questionnaire and accelerome-ter. In regard to adiposity markers, only four studies not showed Body Mass Index measures 24, 38, 42, 55 (Table 2).
In risk of bias assessment, the most frequent problems found in included papers were the absence of reports: blindness of outcome assessor (if aware of research ques-tion and/or exposure status of participants) (n = 0); pre-vious validation of questionnaire (n = 25 of 37; 67.6%); number of withdrawals and dropouts (n = 25; 64.1%) and sample representativeness (n = 15; 38.5%) (Table 2).
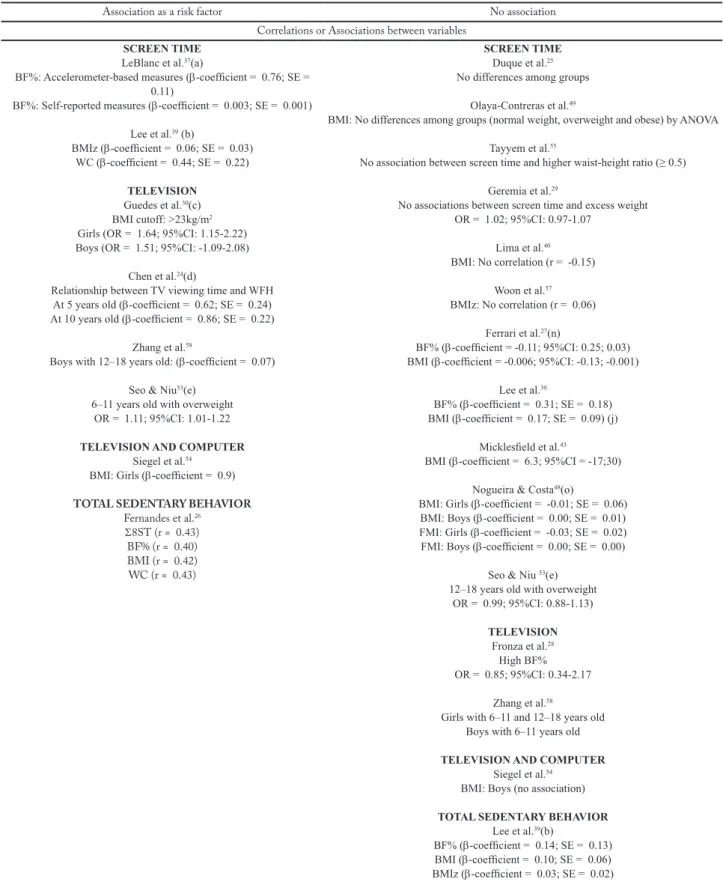
In Table 3 results are summarized. At all, 75 anal-yses were retrieved, being 71 based on screen behav-iors, as television, computer television and videogame (94.7%). Eighteen studies showed more than one result (46.2%), by sex (n = 7)23, 30, 38, 48, 50, 54, 58, weight marker (n = 5)21, 26, 27, 39, 38, 48, age group (n = 3)24, 35, 53, 58, SB type (n = 4)23, 31, 33, 39, nutritional status (n = 1)56, and SB measure (n = 1)37.
About data of the included cohort and case-control studies, were verified risk associations between the TV viewing exposures ≥ 4h/d and weight-for-height ratio both at five (β = 0.62) and ten years old (β = 0.86)24. In case control study52, risk association was verified in group with screen time exposures over two hours per day OR = 2.96 (95%CI: 1.33-6.61) (Table 3).
In regard to the associations between variables, 15 of 25 analyses showed risk associations between SB and body composition (Table 3). When focusing on the dose of sed-entary behavior, risk associations were found in distinct cut off points: 1h/d (3 of 3 analyses); 2h/d (9 of 16); 3h/d (2 of 5); 4h/d (4 of 5) and 5h/d (3 of 6). By type, television time showed a large number of risk associations in all categories.
Table 1 – Descriptive characteristics of included studies (n = 39).
Reference Country (Year of data) Sampling/ Sample no. (%F) Age* Al Sabbah et al.20 Palestine (2003–4) R/ 10,726 (55) 12–18
Arango et al.21 Colombia (2008) R/ 546 (49) 14.4
Bishwalata et al.22 India (2005–6) nd/ 3,356 (56) 12–19
Bukara-Radujkovic & Zdravkovic23 Bosnia and Herzegovina (2004) nd/ 1,204 (52) 11.6
Chen et al.24 China (1998; 2003)CO nd/ 424 (51) 5.5; 10.5
Duque & Parra25 Colombia (nd) R/ 325 (47) 10–12
Fernandes et al.26 Brazil (nd) C/ 60 (nd) 11.9
Ferrari et al.27 Brazil (2012–13) R/ 485 (51) 10.1
Fronza et al.28 Brazil (nd) C/ 283 (47) 13.7
Geremia et al.29 Brazil (nd) R/ 590 (59) 12.5
Guedes et al.30 Brazil (2008) R/ 1,268 (51) 15–18
Hajian-Tilaki & Heidari31 Iran (2008) R/ 1,200 (50) 14.2
Hatami et al.32 Iran (2009–10) R/ 1,157 (nd) 10–18
Hong et al.33 Vietnam (2004) R/ 2,684 (49) 12.9
Ishaque et al.34 Pakistan (nd) C/ 431 (43) 13.4
Janssen et al.35 Mexico (2012) R/ 5,660 (nd) 10–18
Kuriyan et al.36 India (nd) nd/ 598 (nd) 6–16
Lajous et al.38 Mexico (1999) R/ 9,132 (62) 13.9
LeBlanc et al.37 Brazil; China; Colombia, India, Kenya, South Africa (2011–13) R/ 3,060 (nd) 9–11
Lee et al.39 Malaysia (nd) R/ 1,736 (53) 10.0
Lima et al.40 Brazil (nd) C/ 175 (61) 11.9
Ma et al.41 China (nd) R/ 9,356 (51) 4–8
McVeigh & Meiring42 South Africa (nd) C/ 767 (nd) 11.0
Micklesfield et al.43 South Africa (2009) nd/ 381 (51) 12.1; 15.1
Mocanu44 Romania (2008–12) C/ 3,444 (51) 6–10
Morales-Ruán et al.45 Mexico (2006) R/ 18,784 (51) 14.0
Mushtaq et al.46 Pakistan (2009–10) R/ 1,860 (nd) 8.5
Nawab et al.47 India (nd) nd/ 660 (42) 10–16
Nogueira & Costa48 Brazil (2009) R/ 326 (37) 13.0
Olaya-Contreras et al.49 Colombia (nd) R/ 603 (45) 10–14
Peltzer & Pengpid50 Ghana (2003); Uganda (2007) R/ 5,613 (51) 13–15
Rani & Sathiyasekaran51 India (2009) R/ 1,842 (51) 12–18
Rathnayake et al.52 Sri Lanka (nd)CC C/ 100 (100) 15.3
Seo & Niu53 China (2009) R/ 630 (nd) 11.4
Siegel et al.54 Mexico (1998) nd/ 1,004 (51) 9–18
Tayyem et al.55 Jordan (nd) R/ 735 16.2
Wells et al.56 Brazil (2005) BC/ 4,451 (51) 10–12
Woon et al.57 Malaysia (nd) R/ 781 (63) 10.5
Zhang et al.58 China (2004) R/ 5,497 (nd) 6–18
*: Age of samples in means or ranges; %F: percentage of females in sample; BC: birth cohort; C: convenience sampling; CC: case-control study; CO: cohort study; nd: not described; R: random sampling.
Discussion
The present study had as the main purpose to review the relationship between SB and body composition in
children and adolescents from LMIC. As main fin-dings, risk associations between SB and body com-position were found in data of included cohort and
Table 2 – Methodological characteristics of included studies (n = 39).
Reference SB assessment tool Adiposity markers Method for associations analyses/ Effect measure Risk of bias Al Sabbah et al.20 QDS BMI Logistic Reg./ OR Low
Arango et al.21 QDS BMI; WC Linear Reg./ Coef. Low
Bishwalata et al.22 QDS BMI Logistic Reg./ OR Low
Bukara-Radujkovic & Zdravkovic23 QDS BMI Correlation/ Coef. High
Chen et al.24 QDS WFH GLM/ Means Low
Duque & Parra25 QDS BMI Kol. Smir./ Means Moderate
Fernandes et al.26 IPAQ short BF%; BMI; Σ8ST; WC Correlation/ Coef. High
Ferrari et al.27 Accel BF%; BMI; Linear Reg./ Coef. Moderate
Fronza et al.28 QDS BMI Logistic Reg./ OR Low
Geremia et al.29 QDS BMI Poisson Reg./ OR Moderate
Guedes et al.30 QDS BMI Logistic Reg./ OR Moderate
Hajian-Tilaki & Heidari31 QDS BMI Logistic Reg./ OR Moderate
Hatami et al.32 QDS BMI Logistic Reg./ OR Low
Hong et al.33 QDS BMI Logistic Reg./ OR Moderate
Ishaque et al.34 GSHS BMI nd/ OR High
Janssen et al.35 YAQ BMI Logistic Reg./ OR Low
Kuriyan et al.36 nd BMI Logistic Reg./ OR High
Lajous et al.38 QDS BMIz; TSF; SSF Linear Reg./ Coef. Low
LeBlanc et al.37 Accel and DLQ BMI GLM/ Means Moderate
Lee et al.39 CAPANS BMI; BMIz; BF%; WC Logistic Reg./ OR Moderate
Lima et al.40 QDS BMI Linear Reg./ Coef. High
Ma et al.41 QDS BMI Logistic Reg./ OR Moderate
McVeigh & Meiring42 PAQ WFH Logistic Reg./ OR High
Micklesfield et al.43 QDS BMI Linear Reg./ Coef. High
Mocanu44 CATCH BMI Logistic Reg./ OR High
Morales-Ruán et al.45 YAQ BMI Logistic Reg./ OR Low
Mushtaq et al.46 QDS BMI Linear and Logistic Reg./ Coef. and OR Moderate
Nawab et al.47 GPAQ BMI Logistic Reg./ OR High
Nogueira & Costa48 QDS BMI Linear Reg./ Coef. High
Olaya-Contreras et al.49 ISCOLE BMI ANOVA/ Means High
Peltzer & Pengpid50 QDS BMI Logistic Reg./ OR Moderate
Rani & Sathiyasekaran51 QDS BMI Chi–Squared/ Prop. Moderate
Rathnayake et al.52 QDS BMI Logistic Reg./ OR Low
Seo & Niu53 QDS BMI Logistic Reg./ OR Moderate
Siegel et al.54 PAQ BMI Linear Reg./ Coef. Moderate
Tayyem et al.55 QDS WFH ANCOVA/ Means Moderate
Wells et al.56 QDS BMI; TSF; SSF Linear Reg./ Coef. Low
Woon et al.57 QDS BMIz Linear Reg./ Coef. High
Zhang et al.58 QDS BMI Linear Reg./ Coef. Moderate
Legends:*: Accelerometer Actigraph model GT3x+; Σ8ST: Sum of 8 Skinfolds; BF%: body fat percentage; BMI: Body Mass Index; BMIz: Body Mass Index z-score; CAPANS: Child and Adolescent Physical Activity and Nutrition Survey; CATCH: CATCH Kids Club Af-ter-School Student Short Questionnaire; Coef.: coefficient; DLQ: Diet and Lifestyle Questionnaire; GLM: general linear model; h/ d: hour(s) per day; GPAQ: Global Physical Activity Questionnaire; GSHS: Global School-based Student Health Survey; h/ w: hour(s) per week; ISCOLE: The International Study of Childhood Obesity, Lifestyle and the Environment; Kol. Smir.: Kolmogorov-Smirnov; nd: not described; OR: Odds Ratio; PAQ: Physical Activity Questionnaire; Prop.: proportion(s); QDS: questionnaire developed for the study; RP: Prevalence Ratio; Reg.: Regression; SSF: Suprailiac skinfold; TSF: Triceps skinfold; WC: Waist Circumference; WFH: Weight for Height Ratio; YAQ: Youth Activity Questionnaire.
Table 3 – Synthesis of the relationships between sedentary behavior and high levels of weight in children and adolescents from low-and-mid-dle income countries. (Included studies = 39)
Association as a risk factor No association Correlations or Associations between variables
SCREEN TIME
LeBlanc et al.37(a)
BF%: Accelerometer-based measures (β-coefficient = 0.76; SE = 0.11)
BF%: Self-reported measures (β-coefficient = 0.003; SE = 0.001) Lee et al.39 (b) BMIz (β-coefficient = 0.06; SE = 0.03) WC (β-coefficient = 0.44; SE = 0.22) TELEVISION Guedes et al.30(c) BMI cutoff: >23kg/m2
Girls (OR = 1.64; 95%CI: 1.15-2.22) Boys (OR = 1.51; 95%CI: -1.09-2.08)
Chen et al.24(d)
Relationship between TV viewing time and WFH At 5 years old (β-coefficient = 0.62; SE = 0.24) At 10 years old (β-coefficient = 0.86; SE = 0.22)
Zhang et al.58
Boys with 12–18 years old: (β-coefficient = 0.07) Seo & Niu53(e)
6–11 years old with overweight OR = 1.11; 95%CI: 1.01-1.22
TELEVISION AND COMPUTER
Siegel et al.54
BMI: Girls (β-coefficient = 0.9)
TOTAL SEDENTARY BEHAVIOR
Fernandes et al.26 Σ8ST (r = 0.43) BF% (r = 0.40) BMI (r = 0.42) WC (r = 0.43) SCREEN TIME Duque et al.25
No differences among groups Olaya-Contreras et al.49
BMI: No differences among groups (normal weight, overweight and obese) by ANOVA Tayyem et al.55
No association between screen time and higher waist-height ratio (≥ 0.5) Geremia et al.29
No associations between screen time and excess weight OR = 1.02; 95%CI: 0.97-1.07 Lima et al.40 BMI: No correlation (r = -0.15) Woon et al.57 BMIz: No correlation (r = 0.06) Ferrari et al.27(n) BF% (β-coefficient = -0.11; 95%CI: 0.25; 0.03) BMI (β-coefficient = -0.006; 95%CI: -0.13; -0.001)
Lee et al.39
BF% (β-coefficient = 0.31; SE = 0.18) BMI (β-coefficient = 0.17; SE = 0.09) (j)
Micklesfield et al.43
BMI (β-coefficient = 6.3; 95%CI = -17;30) Nogueira & Costa48(o)
BMI: Girls (β-coefficient = -0.01; SE = 0.06) BMI: Boys (β-coefficient = 0.00; SE = 0.01) FMI: Girls (β-coefficient = -0.03; SE = 0.02) FMI: Boys (β-coefficient = 0.00; SE = 0.00)
Seo & Niu 53(e)
12–18 years old with overweight OR = 0.99; 95%CI: 0.88-1.13) TELEVISION Fronza et al.28 High BF% OR = 0.85; 95%CI: 0.34-2.17 Zhang et al.58
Girls with 6–11 and 12–18 years old Boys with 6–11 years old
TELEVISION AND COMPUTER
Siegel et al.54
BMI: Boys (no association)
TOTAL SEDENTARY BEHAVIOR
Lee et al.39(b) BF% (β-coefficient = 0.14; SE = 0.13) BMI (β-coefficient = 0.10; SE = 0.06) BMIz (β-coefficient = 0.03; SE = 0.02) WC (β-coefficient = 0.19; SE = 0.15) Continue…
Cutoff point of 1 hour per day SCREEN TIME Mushtaq et al.46 Risk cutoff: > 1 to 3h/d OR = 1.56; 95%CI: 1.19-2.03 TELEVISION Kuriyan et al.36(f) Risk cutoff: > 1.5 h/d OR = 19.8; 95%CI: 5.4-71.9
Hatami et al. 32(e)
Risk cutoff: 5 to 13.3 h/w OR = 1.58; 95%CI: 1.01-2.47
–
Cutoff point of 2 hours per day
COMPUTER
Bukara-Radujkovic & Zdravkovic23
Risk cutoff: > 2 h/d
Boys (computer use for more 2 h/d was correlated to increased BMI) Hajian-Tilaki & Heidari31
Risk cutoff: > 2h/d (crude analysis) OR = 1.57; 95%CI: 1.14-2.16
SCREEN TIME
Janssen et al.35(g)
15–18 years old: higher chance for the normal weight children to meet the screen time recommendations of ≤ 2h/ d
OR = 2.10; 95%CI: 1.31-3.38 Rathnayake et al.52 Risk cutoff: > 2h/d OR = 2.96; 95%CI: 1.33-6.61 Moralez-Ruan et al.45 (h) Risk cutoff: ≥ 21h/w OR = 1.29; 95%CI: 1.13-1.48 TELEVISION Hong et al.33
Risk cutoff: 2 to 3 h/d (i) OR = 1.9; 95%CI: 1.5-2.5 Nawab et al.47 Risk cutoff: > 2 h/d OR = 3.3; 95%CI: 1.4-7.6 Bishwalata et al.22 Risk cutoff: > 2h/d OR = 2.05; 95%CI: 1.19-3.53 Ma et al.41(j) Risk cutoff: > 2h/d OR = 1.4; 95%CI: 1.1-1.8 COMPUTER
Bukara-Radujkovic & Zdravkovic23
Risk cutoff: > 2 h/d Girls (no correlation)
COMPUTER AND VIDEOGAME
Hong et al.33
Risk cutoff: > 2 h/d (crude analysis) OR = 1.2; 95%CI: 0.8-1.6
SCREEN TIME
Janssen et al.35 (g)
10–14 years old: no chance for the normal weight children to meet the recommendations of ≤ 2h/ d
OR = 1.23; 95%CI: 0.78-1.93
TELEVISION
Rani & Sathiyasekaran51
Risk cutoff: > 2h/d No association (x2 test) Hajian-Tilaki & Heidari31
Risk cutoff: > 2h/d (crude analysis) OR = 1.03; CI95%: 0.78-1.35
Al Sabbah et al.20(p)
Risk cutoff:> 2h/d OR = 1.01; 95%CI: 0.84-1.21
TELEVISION AND COMPUTER
Mocanu44
Risk cutoff: ≥ 2h/d (d) OR = 1.01; 95%CI: 0.73-1.38
Cutoff point of 3 hours per day
SCREEN TIME Arango et al.21 (k) Risk cutoff: > 3h/d BMI (β-coefficient = +0.43; SE = 0.09) WC (β-coefficient = +0.40; SE = 0.09) SCREEN TIME Ishaque et al.34 Risk cutoff: > 3h/d OR = 0.97 Peltzer & Pengpid50
Risk cutoff: ≥ 3h/d (crude analysis) Girls (OR = 1.01; 95%CI: 0.67-1.51) Boys (OR = 1.33; 95%CI: 0.75-2.35)
Continue… … continue
case-control studies. In regard to dose of SB, risk asso-ciations were verified in cutoffs of 1, 2 and 4 hours per day. Also, television time was the most frequently SB type associated as risk with body composition.
However, it is important to point the majority of the studies were cross-sectional, and does not allow infer-ences about causality. Therefore, it is important to recog-nize these associations, either for the support for future studies or as a support message in preventive strategies.
On the other hand, the recognition of the inverse associations between screen time and aerobic fitness during childhood in longitudinal studies13, and associ-ations between SB and consumption of energy-dense nutrient-poor food meals59, suggests that greater ex-posures of SB are associated with an increase energy intake and a decrease in daily energy expenditure, fa-voring the excessive energy accumulation, which is a concern associated with overweight and obesity. More-over, it is important to note that the reduction of the
enzyme activity LPL (Lipoprotein Lipase) during the adoption of SB contributed to unfavorable changes in lipid and glucose profile, contributing to the increase in the amount of body fat60.
In the present review, the data from two longitu-dinal studies 24, 52 corroborates previous evidence from longitudinal studies conducted in high-income coun-tries, such as Australia, Canada, Netherlands and the United States61. Therefore, aiming to advance and deepen the debate, the current evidence allows demon-strating that novel longitudinal studies direct to chil-dren and adolescents from LMIC are needed.
Methodological issues verified in the available arti-cles are another important concern. Current synthesis presented high variability in the types of SB assessed, with predominance of the screen measures (television, computer and non-active electronic games), in special to the measure separated by TV time and sum of time for TV, computer and non-active electronic games. The
Cutoff point of 4 hours per day
SCREEN TIME
McVeigh et al.42
Risk cutoff: > 4h/d (strata of overweight children) OR = 1.96; 95%CI: 1.06-3.64
TELEVISION
Wells et al. 56(l)
Risk cutoff: ≥ 4h/d
Overweight (OR = 1.31; 95%CI: 1.05-1.62) Obesity (OR = 1.56; 95%CI: 1.04-2.33)
Bukara-Radujkovic & Zdravkovic23
Risk cutoff: > 4h/d
Boys (television time for > 4 h/d was correlated to increased BMI)
TELEVISION
Bukara-Radujkovic & Zdravkovic23
Risk cutoff: > 4h/d
Boys (television time for > 4 h/d was correlated to increased BMI)
Cutoff point of 5 hours per day
SCREEN TIME
Lajous et al. 38(m)
Risk cutoff: ≥ 5h/d, comparing to 2h/d cutoff - Boys BMIz (Difference = 0.13; 95%CI: 0.04; 0.23)
SSF (Difference = 0.74; 95%CI: 0.24; 1.22) TSF (Difference = 1.08; 95%CI: 0.36; 1.81)
SCREEN TIME
Lajous et al.38 (m)
Risk cutoff: ≥ 5h/d, comparing to 2h/d cut off - Girls BMIz (Difference = 0.02; 95%CI: -0.07; 0.10)
SSF (Difference = 0.22; 95%CI: -0.22; 0.68) TSF (Difference = 0.35; 95%CI: -0.29; 0.98)
Legends: (a) Adjusted for sex, age, and highest parental education; (b) Adjusted for age, sex, area of residence, energy intake, ethnicity, household income and
parental education; (c) Adjusted for age, marital status of parents, family nucleus, number of siblings, parent’s education, socioeconomic status, school structure, time of study, transport to school, paid work, smoking, alcohol use and BMI; (d): Adjusted for gender and family income; (e) Adjusted for age and sex; (f): Adjusted for age, gender, living location and socioeconomic status and the other significant predictors of overweight in the data; (g): Adjusted for gender, BMI classification, Region of country, Urban/rural area, Socioeconomic status and Education level; (h): Adjusted for gender, urban o rural setting, and indigenous ethnicity, studying at present, tobacco use, alcohol consumption and physical activity; (i): Adjusted analysis from the equation corresponding to the level in which the risk factor was first entered; (j): adjusted for sex, age, domicile regions, domicile situation, income, educational level of parents, breakfast frequency, fast food consumption frequency, desired body size by children and their parents; (k): Adjusted for age, location, physical activity level, type of institution (public or private), consumption of sweetened beverages, consumption of fast foods, consumption of food fries and cardio respiratory fitness;(l) Adjusted for child sex, birthweight, birth length, maternal smoking and alcohol intake during pregnancy, maternal prepregnancy BMI, socio-economic level, physical activity patterns, and systolic and diastolic blood pressure, number of hours of sleep; (m): Adjusted for age, height, socio-economic status, single-parent family, birth in hospital, parental education level, family income, family health insurance, physical activity, inactivity excluding television, video and videogames, community type, sexual maturity, diagnosis of asthma, dieting and frequency of restaurant dining; (n): Adjusted for sex, school and moderate-to-vigorous physical activity; (o): Adjusted for age and maturation; (p) Adjusted for region, grade, weight status and weight dissatisfaction; Σ8ST: Sum of 8 Skinfolds; 95%CI: 95th Confidence Interval;
BF%: Body Fat Percentage; BMI: Body Mass Index; BMIz: Body Mass Index z-score; d: day; FMI: Fat Mass Index; h: hour(s); OR: Odds Ratio; w: week(s); SSF: Suprailiac Skinfold; TSF: Triceps Skinfold; WC: waist circumference; WFH: weight for height ratio; SE: standard error.
literature demonstrates that the key determinants of the screen time are different from the determinants of the total spent time in SB12. However, it is important that future studies add observations beyond traditional screen time measures (television, computer and videog-ame), such as time in mobile phone and tablets. This ob-servation is important, taking into account the frequen-cy of its use in daily life of children and adolescents.
Is also important that future researches broaden their observations in a way that reaches a total measure through the day, raising different domain issues (leisure time, school and travelling)62. Taking into account the interest of domains can strengthen the adoption of more specific intervention strategies with the purpose to con-trol and/or reduce this type of SB at an interest venue.
Based on risk of bias assessment, the findings of the current synthesis reinforce, those future studies in these thematic report important issues, as blindness of outcome assessor, previous validation of questionnaire, number of withdrawals and dropouts and sample rep-resentativeness. As the information of the question-naire validity, can be highlighted that this is also a lim-itation in studies conducted in high-income countries, such as the need of an adequate report of the validity tools to measure the sedentary behaviors, as well as the recommendation to their use, along with, tools that al-low objective and subjective measures of SB62.
Even with the growing investigation about this top-ic, remains the need for adequate tools to assess SB in epidemiological researches63 and the use of objective meausres in parallel of questionnaire, allowing a total sitting time measure all over the day, while the adoles-cents are awake. It is noteworthy that only two included studiesused objective measures to assess SB27, 37. There-fore, is important that further studies assess SB through quality validity tools to the population of interesting, in which will reduce the evidence’s risk of bias.
The high heterogeneity of the available data in the original articles did not allow the realization of a me-ta-analysis. On the other hand, one of the main limita-tions of this review is the fact that the synthesis are based, in the majority, by cross-sectional evidence, requesting caution in extrapolating this result, due to the reverse risk of causality and possible confounder variables. This reinforces the need of studies that look forward to ana-lyze the relationship between SB and body composition in a longitudinal perspective in LMIC. Nevertheless, be-cause the current review presented a specific issue about the associations between sedentary behaviors and body
composition in children and adolescents from LMIC, the current work sought to fill the gap once specified by revisions that were based, for the most part, in evidence from high-income countries12, 17, 62, 64.
Finally, some conclusions can be made. The rec-ognition of these associations is important both to support future studies and preventive messages in the population of interest. Also, further longitudinal stud-ies are necessary for narrowing the casual relationships between the aforementioned variables.
Conflict of interest
The authors declared no conflict of interest.
Funding
Author PG received a postdoctoral scholarship from the São Paulo Research Foundation (Fundação de Amparo à Pesquisa do Estado de São Paulo - FAPESP), process no.: 2013/22204–7.
Contribution of the authors
Guerra PH, elaboration of the central idea; Identification, asses-sment and data extraction of original studies; development and interpretation of the results; drafting of the manuscript. Ribeiro EHC, identification, assessment and data extraction of original stu-dies; interpretation of the results; critical review of the text. Leme ACB, interpretation of the results; translation and critical review of the text. Mota J, interpretation of the results; critical review of the text. Farias Junior JC, interpretation of the results; critical review of the text. Florindo AA, elaborated the idea; assessment of original studies; interpretation of the results; critical review of the text.
References
1. Ng M, Fleming T, Robinson M, Thomson B, Graetz N, Margono C, et al. Global, regional, and national prevalence of overweight and obesity in children and adults during 1980-2013: a systematic analysis for the Global Burden of Disease Study 2013. Lancet. 2014;384(9945):766-81.
2. Popkin BM, Adair LS, Ng SW. Global nutrition transition and the pandemic of obesity in developing countries. Nutr Rev. 2012;70(1):3-21.
3. Mo-suwan L, Tongkumchum P, Puetpaiboon A. Determinants of overweight tracking from childhood to adolescence: a 5 y follow-up study of Hat Yai schoolchildren. Int J Obes Relat Metab Disord. 2000;24(12):1642-7. 4. Julia M, van Weissenbruch MM, Prawirohartono EP, Surjono
A, Delemarre-van de Waal HA. Tracking for underweight, overweight and obesity from childhood to adolescence: a 5-year follow-up study in urban Indonesian children. Horm Res. 2008;69(5):301-6.
5. Flegal KM, Kit BK, Orpana H, Graubard BI. Association of all-cause mortality with overweight and obesity using standard body mass index categories: a systematic review and meta-analysis. JAMA. 2013;309(1):71-82.
6. Aune D, Sen A, Prasad M, Norat T, Janszky I, Tonstad S, et al. BMI and all cause mortality: systematic review and non-linear dose-response meta-analysis of 230 cohort studies with 3.74 million deaths among 30.3 million participants. BMJ. 2016;353:i2156.
7. Philippi ST, Leme ACB. Dietary intake and meal frequency of Brazilian girls attending a school-based randomized controlled trial. Nutr Food Sci. 2015;45(6):954-68.
8. Hallal PC, Andersen LB, Bull FC, Guthold R, Haskell W, Ekelund U. Global physical activity levels: surveillance progress, pitfalls, and prospects. Lancet. 2012;380(9838):247-57. 9. Guerra PH, Farias Junior JC, Florindo AA. Sedentary
behavior in Brazilian children and adolescents: a systematic review. Rev Saude Publica. 2016;50.
10. Pate RR, O’Neill JR, Lobelo F. The evolving definition of “sedentary”. Exerc Sport Sci Rev. 2008;36(4):173-8.
11. Ainsworth BE, Haskell WL, Whitt MC, Irwin ML, Swartz AM, Strath SJ, et al. Compendium of physical activities: an update of activity codes and MET intensities. Med Sci Sports Exerc. 2000;32(9 Suppl):S498-504.
12. Stierlin AS, De Lepeleere S, Cardon G, Dargent-Molina P, Hoffmann B, Murphy MH, et al. A systematic review of determinants of sedentary behaviour in youth: a DEDIPAC-study. Int J Behav Nutr Phys Act. 2015;12.
13. Chinapaw MJM, Proper KI, Brug J, van Mechelen W, Singh AS. Relationship between young peoples’ sedentary behaviour and biomedical health indicators: a systematic review of prospective studies. Obes Rev. 2011;12(7):E621-E32. 14. Fletcher E, Leech R, McNaughton SA, Dunstan DW,
Lacy KE, Salmon J. Is the relationship between sedentary behaviour and cardiometabolic health in adolescents independent of dietary intake? A systematic review. Obes Rev. 2015;16(9):795-805.
15. Chau JY, Grunseit AC, Chey T, Stamatakis E, Brown WJ, Matthews CE, et al. Daily sitting time and all-cause mortality: a meta-analysis. PLoS One. 2013;8(11):e80000. 16. Marshall SJ, Biddle SJ, Gorely T, Cameron N, Murdey I.
Relationships between media use, body fatness and physical activity in children and youth: a meta-analysis. Int J Obes. 2004;28(10):1238-46.
17. Carson V, Hunter S, Kuzik N, Gray CE, Poitras VJ, Chaput JP, et al. Systematic review of sedentary behaviour and health indicators in school-aged children and youth: an update. Appl Physiol Nutr Metab. 2016;41(6 Suppl 3):S240-65. 18. Liberati A, Altman DG, Tetzlaff J, Mulrow C, Gotzsche PC,
Ioannidis JP, et al. The PRISMA statement for reporting systematic reviews and meta-analyses of studies that evaluate healthcare interventions: explanation and elaboration. BMJ. 2009;339:b2700.
19. Thomas BH, Ciliska D, Dobbins M, Micucci S. A process for systematically reviewing the literature: providing the research evidence for public health nursing interventions. Worldviews Evid Based Nurs. 2004;1(3):176-84.
20. Al Sabbah H, Vereecken C, Abdeen Z, Coats E, Maes L. Associations of overweight and of weight dissatisfaction among Palestinian adolescents: findings from the national study of Palestinian schoolchildren (HBSC-WBG2004). J Hum Nutr Diet. 2009;22(1):40-9.
21. Arango CM, Parra DC, Gomez LF, Lema L, Lobelo F, Ekelund U. Screen time, cardiorespiratory fitness and adiposity among school-age children from Monteria, Colombia. J Sci Med Sport. 2014;17(5):491-5.
22. Bishwalata R, Singh AB, Singh AJ, Devi LU, Singh RKB. Overweight and obesity among schoolchildren in Manipur, India. Natl Med J India. 2010;23(5):263-6.
23. Bukara-Radujkovic G, Zdravkovic D. Physical activity as an important determinant in developing childhood obesity. Med Pregl. 2009;62(3-4):107-13.
24. Chen Y-Y, Lee Y-S, Wang J-P, Jiang Y-Y, Li H, An Y-L, et al. Longitudinal Study of Childhood Adiposity and the Risk of Developing Components of Metabolic Syndrome-The Da Qing Children Cohort Study. Ped Res. 2011;70(3):307-12. 25. Duque IL, Parra JH. Exposure to screens, being overweight
and physical deconditioning in children. Rev Latinoam Ci Soc Niñez Juv. 2012;10(2):971-81.
26. Fernandes RA, de Oliveira AR, Júnior IFF. Correlation between different body fat indicators and habitual physical activity in boys. Rev Bras Cineantropom Desempenho Hum. 2006;8(4):32-8.
27. Ferrari GLM, Oliveira LC, Araujo TL, Matsudo V, Barreira TV, Tudor-Locke C, et al. Moderate-to-Vigorous Physical Activity and Sedentary Behavior: Independent Associations With Body Composition Variables in Brazilian Children. Ped Exerc Sci. 2015;27(3):380-9.
28. Fronza FCAO, Minatto G, Martins CR, Petroski EL. Excessive TV Viewing Time and Associated Factors in Brazilian Adolescents from a Rural Area. Hum Mov. 2015;16(1):20-7.
29. Geremia R, Speranza Cimadon HM, de Souza WB, Pellanda LC. Childhood overweight and obesity in a region of Italian immigration in Southern Brazil: a cross-sectional study. Ital J Pediatr. 2015;41.
30. Guedes DP, Souza MV, Ferreirinha JE, Silva AJRM. Physical activity and determinants of sedentary behavior in brazilian adolescents from an underdeveloped region. Percept Mot Skills. 2012;114(2):542-52.
31. Hajian-Tilaki K, Heidari B. Prevalences of overweight and obesity and their association with physical activity pattern among Iranian adolescents aged 12-17 years. Public Health Nutr. 2012;15(12):2246-52.
32. Hatami M, Taib MNM, Jamaluddin R, Abu Saad H, Djazayery A, Chamari M, et al. Dietary factors as the major determinants of overweight and obesity among Iranian adolescents. A cross-sectional study. Appetite. 2014;82:194-201.
33. Hong TK, Trang NHHD, Dibley MJ, Sibbritt DW, Binh PNT, Hanh TTM. Factors associated with adolescent overweight/obesity in Ho Chi Minh city. Int J Ped Obes. 2010;5(5):396-403.
34. Ishaque A, Ahmad F, Zehra N, Amin H. Frequency of and factors leading to obesity and overweight in school children. J Ayub Med Coll Abbottabad. 2012;24(2).
35. Janssen I, Medina C, Pedroza A, Barquera S. Screen time in Mexican children: findings from the 2012 National Health and Nutrition Survey (ENSANUT 2012). Salud Publica Mex. 2013;55(5):484-91.
36. Kuriyan R, Bhat S, Thomas T, Vaz M, Kurpad AV. Television viewing and sleep are associated with overweight among urban and semi-urban South Indian children. Nutr J. 2007;6. 37. LeBlanc AG, Katzmarzyk PT, Barreira TV, Broyles ST,
Chaput JP, Church TS, et al. Correlates of Total Sedentary Time and Screen Time in 9-11 Year-Old Children around the World: The International Study of Childhood Obesity, Lifestyle and the Environment. PLoS One. 2015;10(6):e0129622.
38. Lajous M, Chavarro J, Peterson KE, Hernandez-Prado B, Cruz-Valdez A, Hernandez-Avila M, et al. Screen time and adiposity in adolescents in Mexico. Public Health Nutr. 2009;12(10):1938-45.
Quote this article as:
Guerra PH, Ribeiro EHC; Leme ACB, Mota J, Farias Júnior JC; Florindo AA. Sedentary behavior and body composition in children of low- and mid-income countries: a review. Rev Bras Ati Fis Saúde. 2018;23:e0002. DOI: 10.12820/rbafs.23e0002
39. Lee ST, Wong JE, Shanita SN, Ismail MN, Deurenberg P, Poh BK. Daily physical activity and screen time, but not other sedentary activities, are associated with measures of obesity during childhood. Int J Environ Res Public Health. 2015;12:146-61.
40. Lima MCC, Romaldini CC, Romaldini JH. Frequency of obesity and related risk factors among school children and adolescents in a low-income community. A cross-sectional study. Sao Paulo Med J. 2015;133(2):125-30.
41. Ma GS, Li YP, Hu XQ, Ma WJ, Wu J. Effect of television viewing on pediatric obesity. Biomed Environ Sci. 2002;15(4):291-7.
42. McVeigh J, Meiring R. Physical Activity and Sedentary Behavior in an Ethnically Diverse Group of South African School Children. J Sports Sci Med. 2014;13(2):371-8. 43. Micklesfield LK, Pedro TM, Kahn K, Kinsman J, Pettifor
JM, Tollman S, et al. Physical activity and sedentary behavior among adolescents in rural South Africa: levels, patterns and correlates. BMC Public Health. 2014;14.
44. Mocanu V. Prevalence of Overweight and Obesity in Urban Elementary School Children in Northeastern Romania: Its Relationship with Socioeconomic Status and Associated Dietary and Lifestyle Factors. Biomed Res Intl. 2013. 45. Morales-Ruan MC, Hernandez-Prado B, Maria
Gomez-Acosta L, Shamah-Levy T, Cuevas-Nasu L. Obesity, overweight, screen time and physical activity in Mexican adolescents. Salud Publica Mex. 2009;51:S613-S20.
46. Mushtaq MU, Gull S, Mushtaq K, Shahid U, Shad MA, Akram J. Dietary behaviors, physical activity and sedentary lifestyle associated with overweight and obesity, and their socio-demographic correlates, among Pakistani primary school children. Int J Behav Nutr Phys Act. 2011;8.
47. Nawab T, Khan Z, Khan IM, Ansari MA. Influence of behavioral determinants on the prevalence of overweight and obesity among school going adolescents of Aligarh. Indian J Public Health. 2014;58(2):121-4.
48. Nogueira JAD, da Costa THM. Gender Differences in Physical Activity, Sedentary Behavior, and Their Relation to Body Composition in Active Brazilian Adolescents. J Phys Act Health. 2009;6(1):93-8.
49. Olaya-Contreras P, Bastidas M, Arvidsson D. Colombian Children With Overweight and Obesity Need Additional Motivational Support at School to Perform Health-Enhancing Physical Activity. J Phys Act Health. 2015;12(5):604-9.
50. Peltzer K, Pengpid S. Overweight and Obesity and Associated Factors among School-Aged Adolescents in Ghana and Uganda. Int J Environ Res Public Health. 2011;8:3859-70. 51. Rani MA, Sathiyasekaran BWC. Behavioural Determinants
for Obesity: A Cross-sectional Study Among Urban Adolescents in India. J Prev Med Public Health. 2013;46(4):192-200.
52. Rathnayake KM, Roopasingam T, Wickramasighe VP. Nutritional and behavioral determinants of adolescent obesity: a case-control study in Sri Lanka. BMC Public Health. 2014;14.
53. Seo DC, Niu J. Trends in underweight and overweight/ obesity prevalence in Chinese youth, 2004-2009. Int J Behav Med. 2014;21(4):682-90.
54. Siegel SR, Malina RM, Reyes ME, Barahona EE, Cumming SP. Correlates of physical activity and inactivity in urban Mexican youth. Am J Hum Biol. 2011;23(5):686-92. 55. Tayyem RF, Al-Hazzaa HM, Abu-Mwe SS, Bawadi HA,
Qatatshe A, Musaiger AO. Association of Lifestyle Factors with Obesity Indices among Adolescents in Amman, Jordan. Mal J Nutr. 2014;20(1):51-62.
56. Wells JC, Hallal PC, Reichert FF, Menezes AM, Araujo CL, Victora CG. Sleep patterns and television viewing in relation to obesity and blood pressure: evidence from an adolescent Brazilian birth cohort. Int J Obes. 2008;32(7):1042-9. 57. Woon FC, Chin YS, Mohd Nasir MT. Association between
behavioural factors and BMI-for-age among early adolescents in Hulu Langat district, Selangor, Malaysia. Obes Res Clin Pract. 2015;9(4):346-56.
58. Zhang J, Seo D-C, Kolbe L, Middlestadt S, Zhao W. Associated Trends in Sedentary Behavior and BMI Among Chinese School Children and Adolescents in Seven Diverse Chinese Provinces. Int J Behav Med. 2012;19(3):342-50. 59. Pearson N, Biddle SJH. Sedentary Behavior and Dietary
Intake in Children, Adolescents, and Adults A Systematic Review. Am J Prev Med. 2011;41(2):178-88.
60. Hamilton MT, Hamilton DG, Zderic TW. Exercise physiology versus inactivity physiology: an essential concept for understanding lipoprotein lipase regulation. Exerc Sport Sci Rev. 2004;32(4):161-6.
61. Mitchell JA, Byun W. Sedentary behavior and health outcomes in children and adolescents. Am J Lifestyle Med. 2014;8(3):173-99.
62. Lubans DR, Hesketh K, Cliff DP, Barnett LM, Salmon J, Dollman J, et al. A systematic review of the validity and reliability of sedentary behaviour measures used with children and adolescents. Obes Rev. 2011;12(10):781-99.
63. Atkin AJ, Gorely T, Clemes SA, Yates T, Edwardson C, Brage S, et al. Methods of Measurement in epidemiology: Sedentary Behaviour. Int J Epidemiol. 2012;41(5):1460-71. 64. Tremblay MS, LeBlanc AG, Kho ME, Saunders TJ, Larouche
R, Colley RC, et al. Systematic review of sedentary behaviour and health indicators in school-aged children and youth. Int J Behav Nutr Phys Act. 2011;8:98.
Recebido: 02/07/2017 Aprovado: 25/09/2017