OrganiC CarbOn COntents and stOCks in PartiCle
size FraCtiOns OF a tyPiC HaPludOx Fertilized witH
Pig slurry and sOluble Fertilizer
Maria sueli Heberle Mafra(1)*, Paulo Cezar Cassol(2), Jackson adriano albuquerque(2),
Marco andré grohskopf(3), andreia Patrícia andrade(2), luiz Paulo rauber(2) and
augusto Friederichs(2)
(1) Universidade do Planalto Catarinense, Programa de Pós Graduação em Ambiente e Saúde, Lages, Santa Catarina, Brasil. (2) Universidade do Estado de Santa Catarina, Departamento de Solos e Recursos Naturais, Lages, Santa Catarina, Brasil. (3) Universidade Estadual Paulista, Campus de Botucatu, Programa de Pós-graduação em Agronomia - Agricultura, Botucatu, São
Paulo, Brasil. * Corresponding author.
E-mail: mshmafra@gmail.com
abstraCt
the use of pig slurry (Ps) as fertilizer can affect the soil quality and increase total stocks of soil organic carbon (tOC). However, the effects of Ps on tOC amount and forms in the soil are not fully understood, particularly in areas under no-tillage (nt). the purpose of this study was to determine tOC contents and stocks in the particulate (POC) and mineral-associated C fractions (MaC) of an Oxisol after nine years of maize-oat rotation under nt, with annual applications of Ps, soluble fertilizer and combined fertilization (pig slurry + soluble fertilizer). the experiment was initiated in 2001 in Campos novos, santa Catarina, with the following treatments: Ps at rates of 0 (without fertilization - Ps0); 25 (Ps25); 50 (Ps50); 100 (Ps100); and 200 m3 ha-1 yr-1 (Ps200); fertilization with soluble fertilizer (sF); and mixed fertilization (Ps + sF). the tOC content was determined in samples of six soil layers to a depth of 40 cm, and the POC and MaC contents in four layers to a depth of 20 cm. From the rate of 50 m3 ha-1 yr-1 and upwards, the soil tOC content and stock increased according to the Ps rates in the layers to a depth of 10 cm. the POC and MaC contents and stocks were higher in the surface layers, with a clear predominance of the second fraction, but a greater relative amplitude in the contents of the first fraction.
Keywords: manure, swine slurry, carbon fixation, soil organic matter, no-tillage.
intrOduCtiOn
The fixation of organic carbon (OC) in soil organic matter (SOM) contributes to the mitigation of greenhouse gas emissions from agriculture (Lal, 2004; Carvalho et al., 2010) compensating for the increasing carbon dioxide (CO2) a major cause
of global warming (IPCC, 2007). The fixation of atmospheric C in the soil can be increased by appropriate management practices and, according to some estimates, could reach global levels of 0.6 to 1.2 Pg yr-1 of C in agricultural soils (Lal, 2004).
Among the land management strategies that can increase total organic carbon (TOC) are the no-tillage system (NT), which reduces the decomposition rate (Six et al., 2000; Chen et al., 2009), and fertilization with waste from animal production, which can increase the C input, mainly by stimulating the biomass production of crops (Steiner et al., 2012). Currently, NT is used on about 7 % of the world’s cultivated land area, i.e., on around 95 million hectares (Huggins and Reganold, 2008). In the 0-20 cm layer of fields in southern Brazil, NT can potentially fix about 0.57 Mg C ha-1 yr-1 (Costa et al.,
2008). The potential for total organic carbon accumulation (TOC) in the form of soil organic matter (SOM) in NT is greater than in conventional tillage systems, since the latter involves soil plowing (Bayer et al., 2000). Fertilization with organic fertilizers such as animal waste, alone or in combination with soluble fertilizers, generally also increases TOC stocks in the soil (Gong et al., 2009). On the other hand, fertilization with soluble fertilizer alone has led to increases in TOC contents, and its particulate (POC) and mineral-associated
fractions (MAC) (Gong et al., 2009; Maltas et al., 2013), as well as to reductions (Wu et al., 2004), or even to the absence of any effect (Simon, 2008). These differences were ascribed to processes that control SOM accumulation and preservation and that vary mainly according to the soil type and its management, climate and crops. Therefore, the C fixation potential of soil is being assessed in a number of specific systems of climate, soil and crop, to obtain consistent conclusions (Liang et al., 2012). In this sense, the effects of pig slurry (PS) application to the soil surface, especially at high rates and in NT areas, are still largely unknown, calling for long-term evaluations.
The accumulation of TOC in pig slurry-fertilized areas can be a guideline to determine PS rates, with a view to exploit the fertilizer effect for crops, improve the soil and food quality, and mitigate potential pollutants of this residue. However, in the short and medium term, the TOC content and stock do generally not reflect the changes in soil quality resulting from management practices and the application of organic materials to the soil. In this case, the particle size fractionation of SOM contributes to the assessment of these changes, because its effects on the amounts and proportions of forms of particulate organic C and mineral-associated organic carbon (MAC) may be greater (Cambardella and Elliott, 1992; Bayer et al., 2004).
Particulate organic carbon (POC) is the SOM fraction with a particle diameter greater than 53 μm, consisting of residues derived from plants and organisms in early degradation stages, with still recognizable cell structure, a slower turnover
resuMO: Teores e esToques de Carbono orgâniCo em Frações
granuloméTriCas de laTossolo FerTilizado Com dejeTo suíno e adubo solúvel
o uso de dejeto suíno (ds) como fertilizante pode interferir na qualidade do solo e aumentar os estoques de carbono orgânico total do solo (CoT). entretanto, os efeitos do ds na quantidade e formas de CoT acumulados no solo não são totalmente conhecidos, em especial em áreas em sistema plantio direto (sPd). o objetivo deste trabalho foi analisar os teores e estoques de CoT e de C nas frações particulada (CoP) e associada aos minerais (Cam) em latossolo vermelho cultivado com a sucessão milho e aveia-preta, sob sPd após nove anos com aplicações anuais de ds, de adubo solúvel e fertilização combinada (ds + adubo solúvel). o experimento foi iniciado em 2001, no município de Campos novos, sC, e compreendeu os seguintes tratamentos: ds nas doses zero (sem adubação), 25, 50, 100 e 200 m3 ha-1 ano-1; adubação com adubo solúvel (as); e adubação mista (25 m3 ha-1 ano-1
de ds + as). o teor de CoT foi determinado em seis camadas de solo até a profundidade de 40 cm, enquanto os teores de CoP e Cam foram determinados em quatro camadas até a profundidade de 20 cm. o teor e estoque de CoT no solo aumentaram em razão da dose de ds aplicada nas camadas até 10 cm de profundidade, com doses a partir de 50 m3 ha-1 ano-1. os teores e estoques de CoP e Cam
foram maiores nas camadas superficiais, com expressiva predominância da segunda fração, porém com
maior amplitude relativa nos teores da primeira fração.
rate and shorter soil residence time. The POC represents a form of labile C that is susceptible to mineralization in the short term, very sensitive to variations in plant residue inputs and their exposure to degradation in relation to the soil management, and the first fraction to reflect changes in the C content in the soil (Conceição et al., 2005). The particles of the MAC fraction of SOM have a diameter smaller than 53 μm, and interact with the surface of mineral particles to form organo-mineral complexes. This fraction corresponds to SOM in an advanced stage of stabilization and with longer residence time in the soil (Christensen, 2001). Thus, the size fractionation of SOM particles can help assess the changes resulting from the land use, due to the sensitivity of these fractions to the effects of soil management (Bayer et al., 2004).
The objective of this study was to determine the contents and stock of total organic carbon in the soil, as well as their particulate fractions and associated minerals in an Oxisol after nine years of maize-oat rotation under no-tillage, with annual applications of pig slurry, soluble fertilizer and combined fertilization (pig slurry + soluble fertilizer).
Material and MetHOds
A field experiment was carried out in Campos Novos, Santa Catarina (51º 21’ 47’’ W and 27º 23’ 34.5’’ S; 863 m asl), where the climate is humid mesothermal with mild summers, classified as Cfb (köppen), with mean annual rainfall and temperature of 1,480 mm and 16 °C, respectively. The soil of the study area originates from basalt and was classified as Typic Hapludox (Embrapa, 2013), with contents of 664 to 701 g kg-1 clay
and 120 g kg-1 Fe oxide (hematite and goethite)
(Almeida et al., 2003).
At the beginning of the experiment, the soil (layer 0-20 cm) had the following chemical properties: pH(H2O) 6.1; TOC content 25 g kg-1;
exchangeable Ca and Mg (1 mol L-1 kCl) of 8.2 and
4.6 cmolc dm-3; and extractable P and K (Mehlich-1)
of 6.4 and 67 mg dm-3, respectively. Total organic
C was quantified by acid digestion, Ca and Mg by atomic absorption spectrophotometry, K by flame photometry and P by colorimetry, according to procedures described by Tedesco et al. (1995).
The pig slurry (PS) applied was generated by fattening and growing animals, and was collected and stored in open dunghills. Two samples were collected from the annual PS applications, which were analyzed according to the methods described by Tedesco et al. (1995). The pH measured directly in the PS sample was 7.2 and the dry matter content 59 kg m-3. The total N content was
3.6 kg m-3, determined by the kjeldahl method in a
wet sample. Organic C was measured in 100 mL of wet sample dried at 60 °C to constant weight and then ground in a porcelain mortar to determine TOC by the Walkley-Black method, as described by Tedesco et al. (1995).
The experiment was implemented in 2001, in a randomized block design with four replications in plots (total area 12 × 6.3 m). The treatments consisted of a control (PS0), pig slurry (PS) application at annual rates of 25, 50, 100 and 200 m3 ha-1, soluble fertilizer (SF) and fertilization
with 25 m3 ha-1 PS combined with SF (PS + SF).
From 2001 to 2006, in the SF treatment, annual rates of 130, 44 and 58 kg ha-1 of N, P and k were
applied, which increased from 2007 to, respectively, 170, 57 and 67 kg ha-1, using the sources urea,
superphosphate and potassium chloride. The rates were defined for a maize grain yield of 8 Mg ha-1
in the first period and 11 Mg ha-1 in the second, as
recommended by the Commission of Chemistry and Soil Fertility (CQFS-RS/SC, 2004). Twenty percent of the N fertilizer was applied at planting and the rest sidedressed. Treatment PS + SF included, aside from PS, applications of the soluble fertilizers mentioned above, at rates of N, P2O5 and k2O that
were adjusted annually, to provide similar total quantities of the three nutrients as in treatment SF. For N, the final rate of the water-soluble source in sidedressing was applied as described below, but P and k in two applications (80 % on the day of PS application and the rest 10 days later). On average, the PS applications contributed with approximately 61, 75 and 65 % of the total applied N, P2O5 and k2O,
respectively, in the treatment PS + SF.
The treatments, except N, which was always applied in October of each year, were applied between 15 and 20 days after glyphosate desiccation of the winter crop. Both PS and SF were broadcast on the soil surface on the straw of winter crops. The PS was distributed by a hose with a jet, connected to a pressurized tank, and soluble fertilizer by hand (Cassol et al., 2012).
Annually, maize and black oat were grown in rotation and NT, except for the summer of 2002-2003, when common bean (Phaseolus vulgaris) was planted instead of maize, and in the winters of 2005 and 2008, when wild radish (raphanus sativus) was used instead of oat. All crops were sown with a no-till seeder, consisting of a front disc gang and double-disc furrower (Cassol et al., 2012).
in samples in kopeck rings (height 2.5 cm, diameter 5.88 cm, volume 68 cm3).
The contents and stocks of organic carbon were determined for two particle size fractions, i.e., particulate (POC), containing particles >53 μm and mineral-associated organic carbon (MAC), with particles <53 μm. The TOC was determined in six layers to a depth of 40 cm while the POC and MAC fractions were determined in four layers to a depth of 20 cm. The POC was determined according to the procedure described by Cambardella and Elliot (1992) and MAC was estimated as the difference between TOC and POC. The organic carbon of TOC and POC were determined by the Walkley-Black method, as described by Tedesco et al. (1995), after drying the samples at 60 °C and grinding them in a porcelain mortar. Carbon stocks were estimated by the Veldkamp (1994) equation as follows: StC = (TOC × ρ × Th)/10, where: StC is the TOC stock (Mg ha-1) in a given layer; TOC, the
total organic carbon content (g kg-1); ρ, bulk density
(kg dm-3); and Th the layer thickness (cm). Soil bulk
density (Table 1) was determined at three points per plot in layers down to 20 cm, and the amounts used to calculate the TOC stocks, POC and MAC. In the 20-30 and 30-40 cm layers, sampling was conducted at only one point per plot and the overall mean calculated (1.45 kg dm-3) from these samples
and used to compute the TOC stock in these layers. Data were subjected to analysis of variance by the F test, and means compared by the Tukey test (p<0.05) and by regression analysis for the effect of PS rates on TOC.
results and disCussiOn
The TOC contents in layers to 10 cm deep increased according to the PS rate, adjusted to the exponential model and tending to a maximum value (Figure 1). This behavior shows that the increase in TOC promoted by PS is most significant at rates up to about 50 m3 ha-1, which is evidenced by the mean
rates of variation of this attribute with the increase of the applied rate. Thus, in the 0-2.5 cm layer, the rates of 25, 50, 100 and 200 m3 ha-1 yr-1 resulted
in mean TOC increase rates of, respectively, 0.28, 0.17, 0.08 and 0.02 g kg-1 TOC for each additional
applied m3 of PS. In the 2.5-5 cm layer, the mean
TOC increase rates were, respectively, 0.15, 012, 0.07, and 0.03 g kg-1.
In the 5-10 cm layer, the mean increment rates were lower (0.08, 0.05, 0.02, and 0.006 g kg-1 TOC,
respectively). In the mean of the three upper layers, applications of 50 and 100 m3 of PS, respectively,
resulted in TOC increases of 58 and 83 %. The low increase obtained at the higher rates, especially at rates of 100 m³ PS and higher, may indicate
a tendency of saturation of the soil capacity to accumulate C in these surface layers, under the crop and management conditions of this study. As reported by Stewart et al. (2007), a given soil has a maximum TOC content it can accumulate when the supply sources of this component are maximized.
There was no significant effect of treatments on the TOC content in the 10-40 cm layers (Figure 1). Significant effects of crop and soil management on TOC contents in NT were generally observed in the upper soil layers, usually to a depth of 10 cm, especially in maize. This has been mainly attributed to the deposition of large amounts of crop residues, as well as root concentration and decomposition, humus production and residue deposition in the surface layer (Lovato et al., 2004). Maize residues generally contain high levels of recalcitrant fibers such as lignin and have a high C/N ratio, which are favorable aspects in the conversion of this material in humified organic compounds in the soil (Six et al., 2002; Bordin et al., 2008). This layer also concentrates most of the fine roots, which are important sources of humified organic compounds in the soil (Bordin et al., 2008; kätterer et al., 2011). The roots grow and spread in the profile, and thus act as a major source of humified organic compounds, which are the main form of OC accumulation in the deeper soil layers under NT (Bayer et al., 2000; Lovato et al., 2004).
The TOC stocks determined in the soil layers in different treatments are listed in table 2. In layer table 1. soil bulk density in the layers 0.0-2.5, 2.5-5.0, 5-10, and 10-20 cm of a typic Hapludox cultivated for nine years with no-tillage maize and oat and annually fertilized with soluble fertilizer (sF), pig slurry (Ps) at rates of up to 200 m3 ha-1, and the combination Ps + sF. Mean of four replications
treatment 0.0-2.5 cm 2.5-5.0 cm 5-10 cm 10-20 cm
kg dm-3
SF 1.28 a 1.28ns 1.45ns 1.43ns
PS + SF 1.15 ab 1.24 1.46 1.40
PS0 1.22 a 1.28 1.47 1.39
PS25 1.23 a 1.28 1.41 1.46
PS50 1.28 a 1.31 1.44 1.46
PS100 1.22 ab 1.23 1.45 1.34
PS200 1.08 b 1.27 1.45 1.41
Means followed by different letters in columns differ by the Tukey
test (p<0.05); ns: not significant. SF: treatment with soluble fertilizer as recommended by the Commission of Chemistry and Soil Fertility of RS/SC (CQFS-RS/SC, 2004); PS + SF: treatment
with 25 m3 ha-1 yr-1 PS combined with soluble fertilizer to complete the amount of NPk recommended by CQFS-RS/SC; PS0:
unfertilized treatment; PS25, PS50, PS100 and PS200: treatment
0.0-2.5 cm, PS50 (50 m3 ha-1 yr-1) accumulated a
larger TOC stock (5 Mg ha-1), than the unfertilized
treatment PS0. However, at higher rates there was no additional effect of PS on the TOC stock of that layer. On the other hand, TOC stocks were intermediate and similar to each other in the treatments SF, PS + SF and PS25, and did not differ from PS0 treatments in the deeper layers, nor from PS50, PS100 and PS200 in the upper layers. In the 2.5-5.0 cm layer, the general behavior was similar as in the surface layer, with a TOC increase at PS rates of 50 m3 ha-1 yr-1 and higher. A treatment
effect was also observed in the 5-10 cm layer, but the differences were relatively minor than in the surface layers. In this layer, TOC stocks were highest in the PS treatments (PS100 and PS200), exceeding PS0, but similar to PS + SF. In the three surface layers, with significant treatment effects on TOC stocks, the rate of 200 m3 ha-1 yr-1 did not
increase this fraction in comparison with the 100 m3 ha-1 yr-1 rate, but added the double of organic C
via PS. It is worth remembering that the PS rate 200 m³ ha-1 yr-1 exceeds four times the threshold
of the environmental legislation of Santa Catarina (FATMA, 2004).
In the layers 10-20 cm and 20-30 cm, the TOC stocks did not differ between treatments. However, in the 30-40 cm layer, the same trend was observed
as in the two upper layers, where PS rates of 50 m3 ha-1 yr-1 and higher increased TOC stocks,
being similar to each other and also to the PS + SF treatment. The differences between the treatments in this lower layer may indicate a contribution of crop roots to C accumulation in deeper layers. In the same experimental area, Cassol et al. (2012) observed that at PS rates of 50 m3 ha-1 yr-1 or more,
the content of available Ca increased in the layer 20-30 cm, favoring root growth (Caires et al., 2008).
Although the PS amount applied was two and four times higher in treatments PS100 and PS200 than in PS50, respectively, there was no significant increase in TOC stock due to the increase of PS with rates higher than 50 m3 ha-1, except in the 5-10 cm
layer, where TOC in PS100 was higher than in PS50 (Table 2). One of the reasons for this result may be the saturated soil capacity to accumulate SOM, evidenced by the fitting to exponential regression of the TOC content, tending to a maximum value, according to the PS rates, in agreement with Bayer et al. (2006) and Stewart et al. (2007).
In addition, PS application on crop residues may have increased the mineralization rate of this material due to the reduction of the C/N ratio of the residue left on the soil and consequent stimulation of microbial activity, bearing in mind that the mean C/N ratio of PS applied in the evaluation period was less than 10. The PS applied on crop residues can stimulate microbial activity and thus increase the consumption of SOM in the soil surface layer, which is called the ‘activator’ or ‘priming’ effect. The result is an increase in CO2 emission, reducing the soil TOC
source (Aita et al., 2007). Aita et al. (2007) observed that when PS was applied on black oat residues, the apparent mineralization of C increased, exceeding treatments exclusively with residues on the surface and incorporated PS + plant residues on the surface by 9 %. According to the authors, the N demand of the decomposing microbial population was best supplied when PS was applied together with the C source. On the other hand, Saviozzi et al. (1997) and Chantigny et al. (2001) observed that PS applied to wheat stimulated residue decomposition since the total CO2-C emission in the treatment containing the mixture of pig slurry and plant residues exceeded the sum of the CO2-C quantities emitted
from the treatments with separate use of PS and plant residues.
For the sum of TOC stocks to a soil depth of 40 cm, the trend of treatment effects observed in the separate layers was confirmed. Thus, PS treatments with rates of at last 50 m3 ha-1 yr-1 and treatment PS + SF
increased the TOC stocks. The TOC stocks in the treatments PS200, PS100, PS50 and PS + SF were not significantly different from each other and varied from 13 to 16 Mg ha-1, compared to treatment PS0.
The result of treatment PS + SF was noteworthy, for being similar to PS100 and PS200 and higher Figure 1. relation between total organic carbon
(tOC) contents and pig slurry (Ps) rates (unfertilized treatment - 0; treatment with 25, 50, 100 and 200 m3 ha-1 yr-1) applied annually in soil layers (0.0-2.5, 2.5-5.0, 5-10, 10-20, 20-30, and 30-40 cm) of a typic Hapludox under no-tillage (nt) maize and black oat in the mean of four replications. *: significant at 5 %, ns: not significant.
Pig slurry rate (m3 ha-1 yr-1)
0 50 100 150 200
To
ta
l
or
ga
ni
c
ca
rb
on
(g
kg
-1)
10 20 30 40 50 60
0-2,5 cm TOC = 34 + 18 (1-exp (-0,02 DS)) R2 = 0,77* 2,5-5 cm TOC = 30 + 16 (1-exp (-0,011 DS)) R2 = 0,81* 5-10 cm TOC = 24 + 5 (1-exp (-0,02 DS)) R2 = 0,45* 10-20 cm y = 22,8ns
than SF and PS25. This result may indicate synergism in the complementary use of organic fertilizer with soluble fertilizer, with greater plant development, as observed by Mafra et al. (2014) in another study in the same experimental area. These authors reported that the combined treatment PS + SF resulted in a biomass yield similar to the treatments with highest PS rates and this yield was positively correlated with the TOC fixation rate in the soil (Mafra et al., 2014).
Pig slurry applied at rates of 50 m3 ha-1 yr-1
and higher resulted in larger TOC stocks than fertilization with SF only, although both provided similar amounts of N, P and k. Similar results were reported by Gong et al. (2009) in successive cultivation of maize and wheat for about 17 years, in a flooded Neosol in northern China. The authors observed a greater TOC increase when applying organic and mixed fertilizer than with exclusively soluble sources (urea, triple superphosphate and potassium sulfate).
However, the increase in TOC stocks resulting from fertilization with organic sources has also been explained by the higher productivity of plant biomass it promotes, especially of roots, bearing in mind that roots are the main source of accumulated C in the soil, as reported by Gale and Cambardella (2000), Albuquerque et al. (2005) and kätterer et al. (2011).
The effects of treatments on POC contents and stocks were significant to a depth of 20 cm, but in the surface layers to a depth of 5 cm, the differences were proportionally higher (Table 3). The POC contents had a gradient decreasing with depth, as also observed for TOC. This shows the strong influence of NT on the SOM dynamics,
promoting greater contribution and consequent POC accumulation in the surface layer, usually to a depth of 5 cm. In the 0.0-2.5 layer, the POC content was five to nine times higher than in the 10-20 cm layer (Table 3). This indicates the strong influence of the quantity of pig slurry and plant residues added to the soil surface and by the management on POC.
In the 0.0-2.5 cm layer, POC stocks were highest in the treatments PS100 and PS200, as generally observed in the other layers as well and their sum, in the mean 100 and 73 % higher than in the treatments PS0 and PS25, respectively. In the 5-10 cm layer, POC contents did not differ between treatments, however, the POC stock had a similar tendency to that observed in the surface layers, although with proportionally smaller differences, for considering the double soil mass.
In the sum of POC stocks in the layers 0-20 cm the largest stock was observed in treatment PS100, followed by treatments PS200 and PS + SF (Table 3), whereas PS50 had an intermediate stock, being similar to treatments PS25, SF and PS + SF. These data show that rates up to 50 PS m³ ha-1 yr-1,
in general, were not sufficient to significantly increase the POC stocks to the maximum value observed in the study that occurred at a rate of 100 m³ ha-1 yr-1.
The significant treatment effect on POC stocks to depths of 20 cm highlights the significant contribution of crop roots to C input in this soil layer. Gale and Cambardella (2000) found that most of the 14C added by roots was recovered
in silt + clay and particulate (POC) fractions, indicating that shortly after soil tillage, POC is derived mainly from roots. Thus, the combined table 2. stock of total organic carbon (tOC) in the layers 0.0-2.5; 2.5-5.0; 5-10; 10-20; 20-30; 30-40 and 0-40 cm of a typic Hapludox, cultivated for nine years with no-tillage maize and oat, fertilized annually with soluble fertilizer (sF), pig slurry (Ps) rates up to 200 m3 ha-1 and combined Ps + sF. Mean of four replications
treatment 0.0-2.5 cm 2.5-5.0 cm 5-10 cm 10-20 cm 20-30 cm 30-40 cm 0-40 cm
Mg ha-1
SF 12 ab 11 bc 19 b 33ns 33ns 27 bc 135 b
PS + SF 12 ab 12 abc 20 ab 36 34 27 bc 141 a
PS0 10 b 9 c 18 c 33 30 26 bc 126 c
PS25 13 ab 11 bc 19 b 33 29 25 c 129 bc
PS50 15 a 12 ab 19 b 31 31 31 a 139 ab
PS100 14 a 12 abc 22 a 33 32 29 ab 142 a
PS200 14 a 14 a 21 ab 33 30 28 abc 140 a
CV (%) 9.1 10 6.7 6.3 9.8 6.3 6.1
Means followed by different letters in columns differ by Tukey’s test (p<0.05). SF: treatment with soluble fertilizer; PS + SF: treatment
effect of NT management associated with PS fertilization possibly increased the plant dry weight, which induced higher soil POC stocks (Bayer et al., 2003). Campos et al. (2011) also observed a higher POC stock in the intermediate soil layer (20-30 cm) in cultivation systems with greater plant diversity and root cycling at an intermediate soil depth. The greater range of proportional variation of contents as well as of the POC compared to TOC stocks, observed between treatments, shows that this fraction most directly reflects changes in soil management and C input, affecting SOM dynamics within a relatively short period, in line with findings of Bayer et al. (2001) and Quanying et al. (2014).
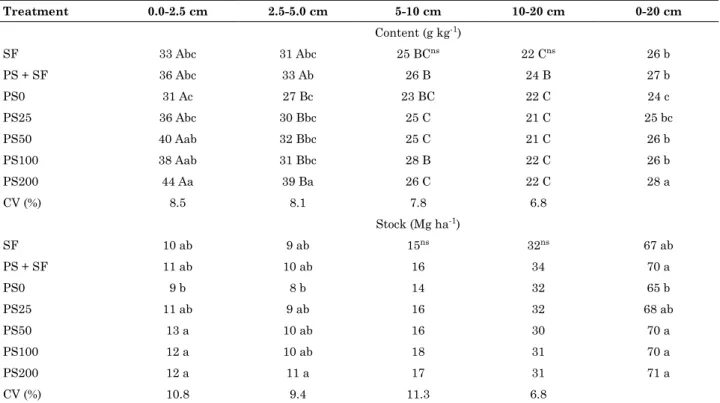
The effects of treatments on the MAC content (Table 4) were also more significant in the surface layers to a depth of 5 cm, and significantly higher than in the 10-20 cm layer. The MAC contents to a depth of 5 cm in the layers differed between treatments, but with proportionally lower amplitude of variation than observed in POC contents. In the various treatments in the 0.0-2.5 cm layer, MAC contents were 36 to
40 % higher than in the 10-20 cm layer, while POC contents differed between 400 and 600 %.
No differences were observed between SF, PS + SF, PS25, PS50 and PS100, in the weighted mean of MAC contents in the 0-20 cm layer. The largest difference in MAC content was observed between treatments PS200 (28 g kg-1) and PS0
(24 g kg-1) with 4 g kg-1, corresponding to 6 Mg ha-1
of MAC in this layer, with a relative lower variation that that in the POC fraction.
The percentage of POC compared to TOC (Table 5) was higher in the upper two surface layers (9 to 20 %), in the order of 3 to 6 times higher in the respective treatments than in the 10-20 cm layer, equivalent to results of Campos et al. (2011). This higher contribution of POC to TOC accumulation in the surface layer to a depth of 5 cm can be due to a higher input of organic waste by crop shoots and roots and their partial biological degradation (Balota et al., 1998) under NT management. There was no significant difference between treatments in the 0.0-2.5 and Table 3. Contents and stocks as particulate organic carbon (POC), with size >53 μm in layers 0.0-2.5, 2.5-5.0, 5-10, 10-20 and 0-20 cm of a typic Hapludox cultivated for nine years with no-tillage maize and oat and annually fertilized with soluble fertilizer (sF), pig slurry (Ps) at rates up to 200 m3 ha-1 and combined Ps + sF. Mean of four replications
treatment 0.0-2.5 cm 2.5-5.0 cm 5-10 cm 10-20 cm 0-20 cm
Content (g kg-1)
SF 5.2 Aabc 3.4 ABbc 1.7 BCns 0.9 Cab 1.8 cd
PS + SF 6.5 Aabc 4.9 Ab 1.9 B 0.9 Bab 2.4 bc
PS0 3.5 Ac 2.7 Bc 1.5 C 0.7 Dab 1.5 d
PS25 4.7 Abc 4.4 Ab 1.4 B 0.7 Bab 1.8 cd
PS50 5.5 Aabc 5.0 Ab 1.7 B 0.6 Bb 2.1 bc
PS100 8.2 Aa 7.6 Aa 2.5 B 1.2 Ba 3.2 a
PS200 7.5 Aab 5.1 Bb 2.5 C 1.1 Da 2.8 ab
CV (%) 24.3 23.7 27.4 27.1 25
Stock (Mg ha-1)
SF 1.6 abc 1.0 b 1.1 ab 1.3 ab 5.0 cd
PS + SF 1.9 abc 1.5 ab 1.2 ab 1.3 ab 5.9 bc
PS0 1.1 c 0.8 b 0.9 b 1.1 ab 4.0 d
PS25 1.4 bc 1.4 b 0.9 b 1.0 ab 4.7 cd
PS50 1.7 abc 1.6 ab 1.1 ab 0.8 b 5.2 c
PS100 2.4 a 2.3 a 1.6 ab 1.7 a 8.0 a
PS200 2.0 ab 1.4 b 1.7 a 1.6 a 6.7 b
CV (%) 23.2 25.4 25.8 27.1 26.2
Means followed by lowercase letters in columns and capital letter in rows with the same sign are not significantly different at 5 % by the Tukey test. SF: treatment with soluble fertilizer as recommended by the Commission of Chemistry and Soil Fertility of
RS/SC (CQFS-RS/SC, 2004); PS + SF: treatment with 25 m3 ha-1 yr-1 PS combined with soluble fertilizer to complete the amount of
NPK recommended by CQFS-RS/SC; PS0: unfertilized treatment; PS25, PS50, PS100 and PS200: treatment with 25, 50, 100 and
5-10 cm layers. In the 2.5-5.0 and 5-10 cm layers, the highest POC percentage was observed in treatment PS100, while PS200 was similar to PS0 and PS25 and SF. The lower percentage of POC/TOC in treatment PS200 than in PS100 can be explained by the activator or priming effect, which leads to accelerated decomposition and higher CO2 emissions (Aita et al., 2007).
In the weighted mean of the POC compared to TOC percentages, the highest value occurred in treatment PS100, followed by the other PS treatments, which were similar to each other. The two highest PS rates resulted in higher values than the mean percentages of treatments PS0 and SF. This result reflects the increased POC stock in response to the addition of OC in manure and especially the higher biomass yield of crops, in line with the findings of Diekow et al. (2005). In the 10-20 cm layer, the differences in POC percentage can be related to the contribution of the root system in response to PS application (kong et al., 2005).
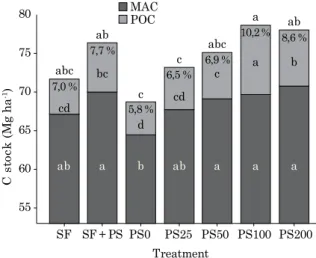
The MAC stock represents on average 92 % of the total TOC stock in the 0-20 cm layer (Figure 2), constituted by organic material stabilized over
Table 4. Contents and stocks of mineral-associated organic carbon (MAC) with particle diameter of <53 μm in the layers 0.0-2.5, 2.5-5.0, 5-10, 10-20 and 0-20 cm of a typic Hapludox cultivated for nine years with no-tillage maize and oat and annually fertilized with soluble fertilizer (sF), pig slurry (Ps) at rates up to 200 m3 ha-1 and combined Ps + sF. Mean of four replications
treatment 0.0-2.5 cm 2.5-5.0 cm 5-10 cm 10-20 cm 0-20 cm
Content (g kg-1)
SF 33 Abc 31 Abc 25 BCns 22 Cns 26 b
PS + SF 36 Abc 33 Ab 26 B 24 B 27 b
PS0 31 Ac 27 Bc 23 BC 22 C 24 c
PS25 36 Abc 30 Bbc 25 C 21 C 25 bc
PS50 40 Aab 32 Bbc 25 C 21 C 26 b
PS100 38 Aab 31 Bbc 28 B 22 C 26 b
PS200 44 Aa 39 Ba 26 C 22 C 28 a
CV (%) 8.5 8.1 7.8 6.8
Stock (Mg ha-1)
SF 10 ab 9 ab 15ns 32ns 67 ab
PS + SF 11 ab 10 ab 16 34 70 a
PS0 9 b 8 b 14 32 65 b
PS25 11 ab 9 ab 16 32 68 ab
PS50 13 a 10 ab 16 30 70 a
PS100 12 a 10 ab 18 31 70 a
PS200 12 a 11 a 17 31 71 a
CV (%) 10.8 9.4 11.3 6.8
Means followed by lowercase letters in columns and capital letters in rows with the same sign are not significantly different at 5 % by the Tukey test. SF: treatment with soluble fertilizer as recommended by the Commission of Chemistry and Soil Fertility of RS/SC (CQFS-RS/SC, 2004);
PS + SF: treatment with 25 m3 ha-1 yr-1 PS combined with soluble fertilizer to complete the amount of NPK recommended by CQFS-RS/SC;
PS0: unfertilized treatment; PS25, PS50, PS100 and PS200: treatment with 25, 50, 100 and 200 m3 ha-1 yr-1 pig slurry, respectively.
table 5. Percentage of POC compared with tOC in the layers 0.0-2.5, 2.5-5.0, 5-10, 10-20 and 0-20 cm of a typic Hapludox cultivated for nine years with no-tillage maize and oat and annually fertilized with soluble fertilizer (sF), fertilizer combination (Ps + sF) and pig slurry (Ps) at rates up to 200 m3 ha-1. Mean of four replications
treatment 0.0-2.5 cm 2.5-5.0 cm 5-10 cm 10-20 cm 0-20 cm
%
SF 13 A 10 ABb 7 BC 4 Cab 6 c
PS + SF 15 A 13 ABab 7 BC 4 Cab 8 bc
PS0 10 A 9 Ab 6 B 3 Cab 6 c
PS25 13 A 11 Aab 5 B 3 Bab 7 bc PS50 12 A 13 Aab 6 AB 2 Bb 8 bc PS100 17 A 20 Aa 8 B 5 Ba 11 a PS200 14 A 11 Bb 9 B 4 Cab 9 b Means followed by different, lowercase letters in columns and
capital letters in rows are significantly different at 5 % by the Tukey test. SF: treatment with soluble fertilizer as recommended
by the Commission of Chemistry and Soil Fertility of RS/SC
(CQFS-RS/SC, 2004); PS + SF: treatment with 25 m3 ha-1 yr-1,
PS combined with soluble fertilizer to complete the amount of NPK recommended by CQFS-RS/SC; PS0: unfertilized treatment;
long periods. In a study on two Brazilian Latosols, Denef et al. (2007) observed that the C associated with minerals in microaggregates and intra macroaggregates stocked most of the accumulated C in NT, and concluded that MAC contributes more than POC to the C-fixation process in the soil in the long-term.
However, although most C is accumulated in the MAC fraction, Six et al. (2000) emphasized the role of the POC fraction as a “bridge” between the light fraction of organic material consisting of plant residue fragments and MAC, characterized by the C stock in the stabilized fraction. Carbon of the residue is not stabilized immediately at the surfaces of minerals or in microaggregates, but first undergoes slow stabilization processes, whereas POC can persist for a longer time if protected within the aggregates (Six et al., 2000).
Organic C of residues is not stabilized immediately on the surfaces of minerals, or the microaggregates, but undergoes slow first stabilization process, while the COP can only stay protected inside the aggregates for a longer time.
COnClusiOns
The total organic carbon (TOC) content in the layers of 0.0-2.5, 2.5-5.0 and 5-10 cm of a Typic Hapludox cultivated with no-tillage maize-oat rotation is increased by pig slurry rates applied to the soil, in an exponential model with highest growth rate per unit (m3) up to the rate of 50 m3 ha-1 yr-1.
The actual increase in the TOC stock can be obtained with the application rate from 50 m3 ha-1 yr-1
PS and with 25 m3 ha-1 yr-1, but in this case, only
when supplemented with SF.
The content and stock of OC in the particulate (POC) and mineral-associated fractions (MAC) were higher in the surface layers to a depth of 5 cm, with greater amplitude of variation in the POC contents and stocks compared to TOC in the treatments.
aCknOwledgeMents
The authors thank the farmer Celso Retore for granting permission to use the experimental area, and are indebted to the Brazilian Federal Agency for Support and Evaluation of Graduate Education (CAPES) for assistance with the experiment and the Brazilian Council for Scientific and Technological Development (CNPq) for scholarships and researcher.
reFerenCes
Aita C, Giacomini SJ, Hübner AP. Nitrificação do nitrogênio
amoniacal de dejetos líquidos de suínos em solo sob sistema de plantio direto. Pesq Agropec Bras. 2007;42:95-102.
Albuquerque JA, Argenton J, Bayer C, Wildner LP, Kuntze MAG.
Relação de atributos do solo com a agregação de um Latossolo Vermelho sob sistemas de preparo e plantas de verão para cobertura do solo. R Bras Ci Solo. 2005;29:415-24.
Almeida JA, Torrent J, Barrón V. Cor de solo, formas do fósforo e adsorção de fosfato em Latossolos desenvolvidos de basalto do
extremo-sul do Brasil. R Bras Ci Solo. 2003;27:985-1002. Balota El, Colozzi-Filho A, Andrade DS, Hungria M. Biomassa
microbiana e sua atividade em solos sob diferentes sistemas de prepare e sucessões de culturas. R Bras Ci Solo. 1998;22:641-9.
Bayer C, Lovato T, Dieckow J, Zanatta JA, Mielniczuk J. A method for estimating coefficients of soil organic matter dynamics based on long-term experiments. Soil Til Res. 2006;91:217-26. Bayer C, Martin Neto L, Mielniczuk J, Pavinato A. Armazenamento
de carbono em frações lábeis da matéria orgânica de um Latossolo Vermelho sob plantio direto. Pesq Agropec Bras. 2004;39:677-83.
Bayer C, Martin Neto L, Mielniczuk J, Pillon CN, Sangoi L.
Changes in soil organic matter fractions under subtropical no-till cropping systems. Soil Sci Soc Am J. 2001;65:1473-8.
Treatment SF C st oc k (M g ha -1) 55 60 65 70 75
80 MACPOC
7,0 % ab cd abc PS25 ab 6,5 % cd c
SF + PS a 7,7 % bc ab PS50 6,9 % a c abc PS100 a 10,2 % a a PS200 8,6 % a b ab PS0 b c 5,8 % d
Bayer C, Mielniczuk J, Amado TJC, Martin Neto L, Fernandes
SV. Organic matter storage in a sandy clay loam Acrisol affected
by tillage and cropping systems in southern Brazil. Soil Till Res.
2000;54:101-9.
Bayer C, Spagnollo E, Wildner LP, Ernani PR, Alburqueque JA.
Incremento de carbono e nitrogênio num Latossolo pelo uso de
plantas estivais para cobertura do solo. Ci Rural. 2003;33:469-75. Bordin I, Neves CSVJ, Medina CC, Santos JCF, Torres E,
Urquiaga S. Matéria seca, carbono e nitrogênio de raízes de soja
e milho em plantio direto e convencional. Pesq Agropec Bras. 2008;12:1785-92.
Caires EF, Garbuio EJ, Churka S, Barth G, Correa JCL. Effects of soil acidity amelioration by surface liming on no-till corn, soybean and wheat root growth and yield. Eur J Agron. 2008;28:57-64. Cambardella CA, Elliot ET. Particulate soil organic-matter changes across a grassland cultivation sequence. Soil Sci Soc Am J. 1992;56:777-83.
Campos BC, Amado TJC, Bayer C, Nicoloso R, Fiorin JE. Carbon
stock and its compartments in a subtropical Oxisol under
long-term tillage and crop rotation systems. R Bras Ci Solo. 2011;35:805-17.
Carvalho JLN, Avanzi JC, Silva MLN, Mello CR, Cerri CEP.
Potencial de sequestro de carbono em diferentes biomas do Brasil. R Bras Ci Solo. 2010;34:277-89.
Cassol PC, Costa AC, Ciprandi O, Pandolfo CM, Ernani PR. Disponibilidade de macronutrientes e rendimento de milho
em Latossolo fertilizado com dejeto suíno. R Bras Ci Solo.
2012;36:1911-23.
Chantigny MH, Rochette P, Angers DA. Short-term C in the cumulative NH3-N losses were not statistically and N dynamics in a soil amended with pig slurry and barley straw: A field experiment. Can J Soil Sci. 2001;81:131-7.
Chen HQ, Hou RX, Gong YS, Li HW, Fan MS, Kuzyakov Y.
Effects of 11 years of conservation tillage on soil organic matter fractions in wheat monoculture in Loess Plateau of China. Soil Till Res. 2009;106:85-94.
Christensen BT. Physical fractionation of soil and structural and
functional complexity in organic matter turnover. Eur J Soil Sci.
2001;52:345-53.
Comissão de Química e Fertilidade do Solo - CQFS-RS/SC. Manual de adubação e de calagem para os estados do Rio Grande do Sul e Santa Catarina. Porto Alegre: Sociedade Brasileira de
Ciência do Solo-Núcleo Regional Sul; 2004.
Conceição PC, Amado TJC, Mielniczuk J, Spagnollo E. Qualidade
do solo em sistemas de manejo avaliada pela dinâmica da matéria orgânica e atributos relacionados. R Bras Ci Solo. 2005;29:777-88. Costa FS, zanatta JA, Bayer C. Emissões de gases de efeito estufa em agroecossistemas e potencial de mitigação. In: Santos GA, Silva LS, Canellas LP, Camargo FAO, editores. Fundamentos da matéria orgânica do solo: ecossistemas tropicais e subtropicais.
Porto Alegre: Gênesis; 2008. p.545-59.
D e n e f K , Z o t a r e l l i a L , B o d d e y d R M , S i x A J .
Microaggregate-associated carbon as a diagnostic fraction for management-induced changes in soil organic carbon in two
Oxisols. Soil Biol Biochem. 2007;39:1165-72.
Diekow J, Mielniczuk J, Knicker H, Bayer C, Dick DP,
kögel-knabner I. Carbon and nitrogen stocks in physical fractions
of a subtropical Acrisol as influenced by long-term no-till cropping systems and N fertilization. Plant Soil. 2005;268:319-28.
Empresa Brasileira de Pesquisa Agropecuária - Embrapa.
Sistema brasileiro de classificação de solos. 3ª.ed. Brasília, DF:
Embrapa Solos; 2013.
Fundação do Meio Ambiente de Santa Catarina - FATMA. Instrução Normativa para licenciamento ambiental. FATMA:
Instrução normativa nº 11, de 13 de dez. 2004. [Acessado 10 out.
2014]. Disponível em: http://www.fatma.sc.gov.br
Gale WJ, Cambardella CA. Carbon dynamics of surface residue and root-derived organic matter under simulated no-till. Soil Sci Soc Am J. 2000;64:190-5.
Gong W, yan Xy, Wang Jy, Hu TX, Gong yB. Long-term
manuring and fertilization effects on soil organic carbon pools under a wheat-maize cropping system in North China Plain.
Plant Soil. 2009;314:67-76.
Huggins DR, Reganold JP. No-till: the quiet revolution. Sci Am. 2008;299:70-7.
Intergovernmental Panel on Climate Change - IPCC - 2007: Climate change impacts, adaptation and vulnerability. Summary for policy makers. Paris: 2007.
kätterer T, Bolinder MA, Andrén O, kirchmann H, Menichetti L. Roots contribute more to refractory soil organic matter than
aboveground crop residues, as revealed by a long-term field
experiment. Agric Ecosyst Environ. 2011;141:184-92.
Kong AY, Six J, Bryant DC, Denison RF, Kessel C. The
relationship between carbon input, aggregation, and soil organic
carbon stabilization in sustainable cropping systems. Soil Sci Soc
Am J. 2005;69:1078-85.
Lal R. Soil carbon sequestration impacts on global climate change and food security. Science. 2004;304:1623-7.
Liang Q, Chen H, Gong Y, Fan M, Yang H, Lal R, Kuzyakov Y. Effects of 15 years of manure and inorganic fertilizers on soil organic carbon fractions in a wheat-maize system in the North
China Plain. Nutr Cycling Agroecosyst. 2012;92:21-33.
Lovato T, Mielniczuk J, Bayer C, Vezzani C. Adição de carbono e nitrogênio e sua relação com os estoques no solo e com o rendimento
do milho em sistemas de manejo. R Bras Ci Solo. 2004;28:175-87. Mafra MSH, Cassol PC, Albuquerque JA, Correa JC, Grohskopf MA, Panisson J. Acúmulo de carbono em Latossolo adubado com dejeto líquido de suínos e cultivado em plantio direto. Pesq Agropec Bras. 2014;49:630-8.
Maltas AR, Jeangros CB, Sinaj S. Effect of organic fertilizers and
reduced-tillage on soil properties, crop nitrogen response and crop
yield: results of a 12-year experiment in Changins, Switzerland.
Soil Till Res. 2013;126:11-8.
Quanying W, yang W, Qicun W, Jingshuang L. Impacts of 9 years of a new conservational agricultural management on soil organic carbon fractions. Soil Till Res. 2014;143:1-6.
Saviozzi A, Levi-Minzi R, Riffaldi R, Vanni G. Role of chemical
constituents of wheat straw and pig slurry on their decomposition in soil. Biol Fertil Soils. 1997;25:401-6.
Simon T. The influence of long-term organic and mineral
fertilization on soil organic matter. Soil Water Res. 2008;3:41-51. Six J, Conant RT, Paul EA, Paustian K. Stabilization mechanisms
Six J, Paustian K, Elliott ET, Combrink C. Soil structure and soil organic matter: I. Distribution of aggregate size
classes and aggregate associated carbon. Soil Sci Soc Am J. 2000;64:681-9.
Steiner F, Pivetta LA, Zoz T, Pinto Junior AS. Estoque de
carbono orgânico no solo afetado por adubação orgânica e sistemas de culturas no Sul do Brasil. Semina: Ci Agrár. 2012;33:2775-88.
Stewart CE, Paustian K, Conant RT, Plante AF, Six J. Soil carbon
saturation: concept, evidence and evaluation. Biogeochemistry. 2007;86:19-31.
Tedesco MJ, Volkweiss SJ, Bohnen H, Gianello C, Bissani
CA. Análises de solos, plantas e outros materiais. 2ª.ed. Porto
Alegre: Universidade Federal do Rio Grande do Sul; 1995. (Boletim técnico de solos, 5)
Veldkamp E. Organic carbon turnover in three tropical soils under pasture after deforestation. Soil Sci Soc Am J. 1994;58:175-80.
Wu Ty, Schoenau JJj, Li FM, Qian Py, Malhi SS, Shi yC, Xu FL.
Influence of cultivation and fertilization on total organic carbon