www.ccarevista.ufc.br ISSN 1806-6690
Macronutrients uptake rate and biomass partitioning during early
growth of Jatropha plants
1Taxa de absorção de macronutrientes e partição de biomassa durante o crescimento
inicial do pinhão-manso
Elcio Ferreira Santos2, Fernando Giovannetti Macedo2, Bruno José Zanchim2, Marcos Antonio Camacho3 and
José Lavres2*
ABSTRACT - Jatropha seeds oil can replace fossil fuels, but the nutrient supply management for this species is not fully described. The objective with this work was to establish curves of macronutrient (nitrogen - N; phosphorus - P; potassium - K; calcium - Ca; magnesium - Mg and sulfur - S) content in leaves, stem and roots, and to evaluate the relative growth rate (RGR), absolute growth rate (AGR) and the foliar mass ratio (FMR). The experiment was arranged in completely randomized design with five replications. Jatropha plants were grown in nutrient solution and collected at intervals of 14 up to 119 days after treatments started. The period of highest uptake of nutrients occurred from 7 to 35 days after treatments started, which coincides with highest AGR, RGR, FMR and accumulation of dry biomass. The highest Ca and Mg accumulation occurred in the leaves (respectively 48% and 47% of the total taken up), while N, K, S and P were mostly accumulated in the stem (58%, 56%, 56% and 53%, respectively). The nutrients more taken up by Jatropha plants were N and Ca, and the order of macronutrients uptake was: N > Ca > K > Mg > S > P. Jatropha plants have shown high macronutrients content on its early development, indicating the importance of nutritional management to achieve reliable biomass yield.
Key words: Jatropha curcas. Nutrient uptake. Relative growth rate. Macronutrients uptake curves. Macronutrient uptake rates.
RESUMO -O óleo das sementes de pinhão-manso possui potencial para substituir combustíveis fósseis, porém o manejo
nutricional para a espécie ainda não é totalmente descrito. O objetivo com esse trabalho foi estabelecer curvas de acumulo de macronutrientes em folhas, caule e raiz, bem como avaliar a taxa de crescimento relativo (TCR), taxa de crescimento absoluto (TCA) e relação de massa foliar (RMF) do pinhão-manso. O experimento foi inteiramente casualizado com cinco repetições. Plantas de pinhão-manso foram cultivadas em solução nutritiva e coletadas em intervalos de 14 dias até 119 após o início do tratamento. O período de maior absorção de macronutrientes ocorreu entre 7 a 35 dias após o início dos tratamentos, que coincidiu com a maior TCR, TCA, RMF e acúmulo de biomassa seca. O maior conteúdo de Ca e Mg ocorreu nas folhas (respectivamente 48% e 47% do total absorvido), enquanto N, K, S e P foram mais acumulados no caule (58%, 56%, 56% e 53%, respectivamente). Os nutrientes mais absorvidos pelo pinhão-manso foram N e Ca, e a ordem de conteúdo de macronutrientes foi: N > Ca > K > Mg > S > P. O pinhão-manso apresentou alto acúmulo de macronutrientes no seu desenvolvimento inicial, indicando a importância do manejo nutricional para alcançar a produção adequada.
Palavras-chaves: Jatropha curcasL.. Absorção de nutrientes. Taxas de crescimento relativo. Curvas de absorção de macronutrientes.
Taxas de absorção de macronutrientes.
DOI: 10.5935/1806-6690.20170066 *Autor para correspondência
Recebido para publicação em 12/08/2016; aprovado em 09/12/2016
1Pesquisa apoiada pela FAPESP
2Laboratório de Nutrição de Plantas Prof. E. Malavolta, Centro de Energia Nuclear na Agricultura, Universidade de São Paulo/USP, Av. Centenário,
303, São Dimas, Piracicaba-SP, Brasil, 13.400-970, elciosantos@cena.usp.br, giovanetti_agro@yahoo.com.br, bruno.zanchim@yahoo.com.br, jlavres@usp.br
INTRODUCTION
The constant increases in crude oil prices and environmental concerns have led to the search for renewable fuels, such as biodiesel. Jatropha plants (Jatropha curcas L.) has great potential as a feedstock
for biofuel and can be cultivated in regions of low water availability, high temperatures and low natural fertility
(SILVA et al., 2015; YONG et al., 2010). The species
presents some desirable characteristics, such as high oil concentration (33–38% in seeds) and the possibility of insertion into the production chain of family agriculture. However, the global cultivation of Jatropha plants has greatly increased without prior adequate agronomic knowledge of the species and with limited genetic
diversity (ROSADOet al., 2010).
Technical limitations have prevented full insertion of Jatropha plants as an energy source in the world. In addition to the non-uniform maturation of fruits and low production observed in different edaphoclimatic conditions
(EDRISIet al., 2015), better crop management during early
growth of Jatropha plants is essential. The establishment of large cropped areas with Jatropha plants depends on the appropriate initial growth of the species. Therefore, information concerning nutritional requirement during early development of the species is needed to establish
highly productive Jatropha plants (ROSADO et al.,
2010; SANTOSet al., 2013; SOUZAet al., 2011).
The adequate cultivation of the species requires determining its nutritional status for better planning and implementation of fertilization (CHAUDHARY;
GHOSH, 2013; YONGet al., 2010). Therefore, Jatropha
plants is still in the domestication process, and since this species offers potential for biodiesel production, studies
on the characterization of nutritionaluptake and biomass
partitioningduring its initial growth should be intensified
to ensure the optimum establishment of plants and to meet
its nutritional requirements (GARRONE et al., 2016;
SANTOSet al., 2013).
The macronutrients uptake and partitioning are
strongly influenced by the plant development (LIMAet al.,
2011; MOREIRA; FAGERIA, 2009; NASCIMENTOet al.,
2012). In the most of species, the macronutrients are usually considered as having high phloem mobility, except calcium (Ca) and sulfur (S). However, a new tissues formation in plants alters the source-sink relation in plants. Moreover, the content of nutrients in plants are frequently associated with foliar senescence, which makes nutrients available for younger plant tissue and contributes to nutrient use
efficiency (ABDALLAH et al., 2010). In addition, the
nutrients redistribution is influenced by plant species
(MAILLARD et al., 2015). Therefore, studies that
investigate the content (uptake) and redistribution of
nutrients according to the plant development are very
pressing, as pointed by Maillardet al. (2015).
Evaluation of the nutritional requirements of seedlings is necessary, as this can benefit the proper establishment of Jatropha plants crops, and indicate the period when the plant has a greater demand for nutrients, as well as show changes in nutrient uptake during plant development and the relative concentration of nutrients in the biomass. These results can lead to a more efficient fertilization program and consequently, result in greater crop productivity. Thus, the objective with this study was to establish the curves of accumulation of N, P, K, Ca, Mg, and S in leaves, stem and roots of Jatropha plants and to identify the rates of biomass content.
MATERIAL AND METHODS
Initiation and development of experiments
The study was carried out under greenhouse conditions at University of São Paulo (USP), Piracicaba, São Paulo State, Brazil, from March to July 2013. The maximum, minimum and average temperatures during the experimental period were 39.8, 19.7; and 29.6 °C,
respectively. Seeds of Jatropha plants (Jatropha curcas L.)
were previously selected by the same size (±5.0 cm) and weight (±0.6 g), germinated in sand and irrigated with deionized water. When seedlings reached about 5 cm in height, they were transferred to a plastic tray (40 L) containing nutrient solution diluted of Hoagland and Arnon (1950), diluted at 20 % of the usual concentration. After one week, seedlings of similar size (±10 cm) were transferred to individual pots, where they were grown in nutrient
solution with 100% concentration (SANTOSet al., 2013;
SILVAet al., 2015). The cultivation solutions remained
under constant aeration and were monitored on a daily basis, with the pH being adjusted to 6.0 ± 0.5 with NaOH
(1 mol L-1) and HCl (1 mol L-1) whenever necessary. The
nutrient solutions were renewed every seven days. The complete nutrient solution (HOAGLAND;
ARNON, 1950) was composed of 12.0 mmol L-1
N-NO3-; 4.0 mmol L-1 N-NH
4+; 2.0 mmol L-1 P; 6.0 mmol L-1
K; 4.0 mmol L-1 Ca; 1.0 mmol L-1 Mg; 1.0 mmol L-1 S;
25.0 µmol L-1 B; 50.0 µmol L-1 Cl; 0.5 µmol L-1 Cu;
53.7 µmol L-1 Fe; 2.0 µmol L-1 Mn; 0.5 µmol L-1 Mo
and 2.0 µmol L-1 Zn.
(DAT), so after seedling transferred to full nutrient solution. The experiment was conducted for 119 days, and three plants were harvested per treatment, and were separated into leaves, stem and roots.
Dry-mass production and chemical analyses of plant tissues
After each plant sampling, the material was separated into leaves, stems and roots. Plant material was oven-dried at 65 °C for 72 h, weighed and crushed in a Wiley-type mill (sieved through a 1-mm mesh). The concentrations of N, P, K, Ca, Mg, and S was determined in the plant tissues. The extract to determine the N concentration was obtained via sulfuric digestion and total N was determined by the analytical method of micro-Kjeldahl. The analysis of P, K, Ca, Mg, and S was performed following perchloric-nitric digestion; the amount of P was determined by colorimetry of ammonium metavanadate, K by flame photometry, Ca and Mg by atomic absorption spectrometry and S by Ba chloride turbidimetry (MALAVOLTA; VITTI; OLIVEIRA, 1997). Nutrient content was calculated by multiplying the dry-mass by the element concentration of the respective plant part. The uptake rate of macronutrients was calculated based on nutrient content during the assessment period and the quantities extracted from the aerial parts (stem + leaves) or roots.
The results for dry mass allowed the following growth parameters to be determined: absolute growth rate (AGR), relative growth rate (RGR) and foliar mass ratio (FMR), according to the equation of Radford (1967):
(1)
(2)
(3)
where: Dw2 – Dw1 = difference between a total dry mass
of the plants of each experimental unit; t2 – t1 = Number
of days between sampling times; Dwtotal = total dry mass of each experimental unit; DwLeaves= dry mass of the leaves of each experimental unit; ln = natural logarithm.
Statistical analysis
The results were analyzed statistically using the SAS statistical program for Windows 9.2. The means of AGR, RGR, FMR, nutrient uptake rate and macronutrient amount (accumulation) were compared using the Tukey’s when F was significant
(p≤0.05). The means of AGR, RGR and FMR were
compared according to evaluation time. The means of macronutrients uptake were compared between the thirds of experiment evaluation times, indicating in which third of experiment evaluation times the highest uptake of each nutrient occurred. The means of macronutrients content of plant harvested at the end of experiment (119 DAT), were compared between of plant tissue (leaves, stem and roots), in order to find out which plant tissue takes up more macronutrients. The effects of the days of evaluation in the macronutrients content were adjusted using regression models for linear or quadratic orthogonal polynomials, when F was
significant (p≤0.05), to establish the content curves of
N, P, K, Ca, Mg and S in the leaves, stem and roots.
RESULTS AND DISCUSSION
Dry-mass production
The content of dry mass in leaves, stem and roots, as well as the macronutrients content in these plant tissues were affected according with time course of the experiment. The parameters of growth (AGR, RGR and FMR) were also influenced by the evaluation days. In addition, the macronutrient uptake rate was different in each thirds of the experiment time evaluation (0-35 DAT; 36-77 DAT; 78-119 DAT). The macronutrients accumulation was also different in the different plant parts (leaf, stem and root) at the end of the experiment (Table 1).
The total dry mass production and the dry mass of roots and stems increased throughout the assessment period (Figure 1). Thus, plants were still in the process of biomass accumulation at the end of the experiment. The assessments considered only the vegetative stages of the growth period, and at the end of the experiment, there was no sign of the onset of flowering
Variation Source Variables
Leaves Content
---Days after treatments started DW N P K Ca Mg S
425.28** 102.62** 7350.80** 504.58** 1221.83** 1154.18** 1016.04**
Stem Content
---Days after treatments started DW N P K Ca Mg S
3680.36** 1456.77** 3528.86** 3349.29** 2178.44** 3084.24** 3921.72** --- Roots Content
---Days after treatments started DW N P K Ca Mg S
3847.63* 79.85** 3200.86** 3434.89** 3954.57** 3000.58** 3576.28**
Total Content
---Days after treatments started DW N P K Ca Mg S
3168,11** 122.84** 2646.13** 2600.85** 1941.72** 2056.85** 3155.99**
--- Growth Parameters
---Days after treatments started AGR RGR FMR
325.41* 333.52* 136.25*
- Macronutrients Uptake Rate (119 DAT)
---Third Time Eveluation N P K Ca Mg S
138.42* 232.74* 196.96* 115.89* 204.27* 33.45*
Macronutrients Content (119 DAT)
---Plant Tissue N P K Ca Mg S
127.75* 139.76* 170.03* 129.30* 126.68* 173.76*
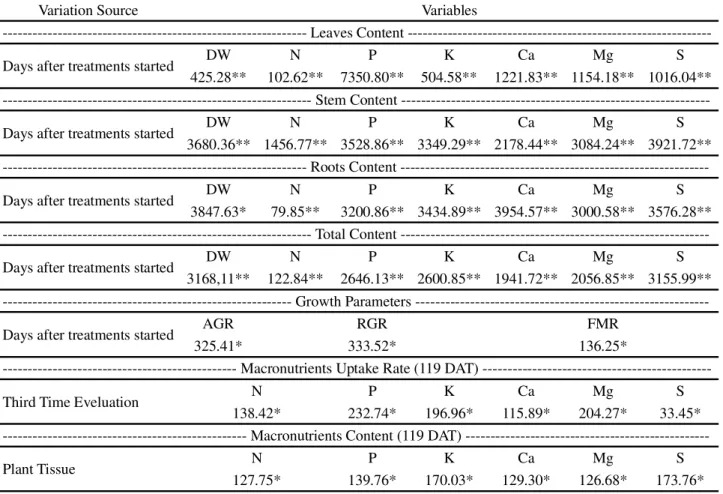
Table - 1F-values and level of statistical significance for: Dryer mass (DW), nitrogen (N), phosphorus (P), potassium (K), magnesium (Mg), calcium (Ca) and sulfur (S) content in leaves, stem, roots and total of the Jatropha plants according with the days after treatments started (DAT); Absolute growth rate (AGR), Relative growth rate (RGR) and Foliar mass ratio (FMR) according the DAT; Macronutrients Uptake Rate (content of period/content %) according the third time evaluation (0-35 DAT; 36-77 DAT; 78-119 DAT); and Macronutrients content taken up by the plant tissue (leaves, stem and roots) according with DAT
*and ** Significant at 5 and 1% probability
Figure 1 - Dry matter (DM) content in leaves, stem, roots and total dry matter of the Jatropha plants according with time course of the experiment (n = 5 ± standard deviation) (* and ** Significant at 5 and 1 % probability by F-test)
Table 2 - Absolute growth rate (AGR) Relative growth rate (RGR) and Foliar mass ratio (FMR) (n = 5 ± standard deviation) of Jatropha plants grown in solution nutrition, according with time course of the experiment (the days after treatments started - DAT)
Different letters within the same column indicate significant differences by Tukey’s test (p≤0.05)
Macronutrient content
During initial growth, Jatropha plants showed a higher rate of macronutrient uptake between 7–35 DAT, except for N (Table 2). This reflects the higher rate of dry-mass increase per day during this period (Figure 1; Table 1), indicated by the RGR, AGR and FMR. In general, the high biomass accumulation of Jatropha plants between 7– 35 DAT demanded a high uptake rate of macronutrients (Table 2). Jatropha plants showed a continuous uptake rate of N, which demonstrates the importance of N for Jatropha plants seedlings throughout the experimental period (Table 3). The descending content order of macronutrients during the initial growth of Jatropha plants at 119 DAT was: N > Ca > K > Mg > S > P according of the macronutrient accumulation (Table 3).
The content of N increased in all plant parts with plant growth (Figure 2A), and the largest relative N content was observed initially in leaves (Figure 2B). At 7 DAT, N content in leaves was 68% of the total absorbed by plants; however, this relative content decreased to 28% at the end of the experiment, due to the lower proportion of leaves in total plant dry mass compared to the stem. In stems, the relative N content increased from 19% (7 DAT) to 56% (119 DAT); however, the relative N content in roots was stable and showed a mean of 14% of the total content of plants at every evaluation point. The variation in the content relative of N in leaves due to plant growth was high in the first few weeks and decreased from 21 DAT onwards (Figure 2B). After 77 DAT, the N content in stems increased sharply (Figure 2A), which is consistent with the high mobility of this nutrient in the phloem.
The content of P increased in all plant parts during plant growth (Figure 2C). However, only P content in the
Evaluation time AGR RGR FMR
g g-1 day g g-1 day g g-1
7 DAT 0.181±0.012 c 0.034±0.001 c 0.473±0.021 a
21 DAT 0.349±0.152 b 0.113±0.003 a 0.472±0.030 a
35 DAT 0.780±0.011 a 0.073±0.004 b 0.253±0.015 bc
49 DAT 0.017±0.031 e 0.011±0.002 d 0.278±0.014 b
63 DAT 0.401±0.021 b 0.023±0.002 c 0.248±0.021 c
77 DAT 0.389±0.011 b 0.017±0.003 c 0.208±0.013 d
91 DAT 0.138±0.021 cd 0.005±0.001 c 0.185±0.024 de
105 DAT 0.335±0.021 b 0.011±0.005 c 0.163±0.031 ef
119 DAT 0.071±0.021 d 0.002±0.001 c 0.147±0.018 f
stem suggested that P uptake might continue to increase in assessment periods longer than those used in this study. The greatest P uptake by plants occurred initially in leaves and P was redistributed to the stem (Figure 2D). Therefore, content of P in the leaves decreased during the growth of Jatropha plants, and increased in the stem. The relative P content in leaves decreased from 51% to 19% from the beginning (7 DAT) to the end of the experiment (119 DAT); conversely, that in the stem increased from 29% to 53%. The relative P content in roots was constant, showing a mean of 16% of the total content at all time-points assessed, similar to that observed for N.
The K content increased with Jatropha plants growth in all plant parts (Figure 2E). Similar to that for P, the K content relative at 21 DAT decreased in leaves due to redistribution to the stem (Figure 2F), which is explained by the high mobility of this element in the nutrient redistribution or by needs of the plant to increase the stem mass production on 21 DAT, as highlighted also for N and P. The relative K content in leaves decreased from 44% at 7 DAT, to 18% at 119 DAT. In contrast, the relative K content in the stem increased from 32%, at 7 DAT, to 56%, at 119 DAT. The relative K content in roots was constant during initial growth of Jatropha plants, accounting for a mean of 17% of the total content in the plants at each assessment time.
Nutrient
Days after treatments started (DAT) Content in leaves Content in stem Content in roots
0 to 35 36 to 77 78 to 119 -- 119 DAT
---Uptake rate of nutrient (%) --- mg/plant
---N 24±0.9 c 41±1.5 a 35±1.4 b 76.0±3.5 b 143.4±3.1 a 56.2±1.2 c
P 56±1.5 a 36±1.5 b 8±0.5 c 5.9±0.8 b 16.2±2.2 a 8.5±0.4 b
K 53±1.6 a 38±1.6 b 10±0.8 c 31.2±1.1 b 94.1±2.3 a 43.7±0.9 b
Ca 51±2.2 a 21±2.2 b 28±1.8 b 102.9±2.1 a 75.6±1.5 b 32.8±1.4 c
Mg 54±1.9 a 36±2.5 b 10±1.1 c 41.1±8.7 a 33.0±2.4 a 13.1±1.2 b
S 41±1.1 a 34±2.1 b 25±2.2 c 10.2±1.3 b 29.3±1.5 a 12.6±0.5 b
Different letters within the same line indicate significant differences by Tukey’s test (p≤0.05)
Table 3 - Uptake rate (content of period/content %) of macronutrient (n = 5 ± standard deviation) during the evaluation period and amounts taken up by the leaves, stem and roots of Jatropha plants grown in solution nutrition, according with time course of the experiment (the days after treatments started - DAT)
The greater accumulation of dry mass in leaves during initial growth than at the end of the experiment (Figure 1) can be explained by a higher carbon allocation for stem growth. This relationship tends to reverse as the stem grows and becomes more lignified. Stem growth promoted the redistribution of photoassimilates, leading to a reduction in dry
mass in the leaves (SANTOS et al., 2013). The C
allocation to the stem in Jatropha plants seedlings represented an inflection point in dry-mass production in leaves, which was estimated to occur at 78 DAT.
According to Nascimento et al. (2012), the inflection
point corresponds to the assessment period in which the daily accumulation within plant organs begins to decrease. Changes in plant tissues responsible for a greater accumulation of dry mass are common, due to the change in the growth period in which the sink ratio of younger tissues increases, mainly in reproductive tissues (BIANCO; CECÍLIO FILHO; CARVALHO, 2015).
The results observed for the AGR, RGR and FMR indicate that 35 DAT is the period of maximum leaves biomass accumulation, and after this period, the leaves are no longer a sink, but become a source of photoassimilates for growth. In the early growth stages raging from 7 to 21 DAT of Jatropha plant growth, the stem develops little, and leaves represent a greater proportion of the total dry mass accumulation of the plant (Figure 4). This relationship tends to reverse as the stem grows and lignifies.
The reduction in AGR and RGR with plant growth observed in the first few weeks occurred because in early growth, the predominance of biomass in young leaves (high FMR) provides a high rate of C fixation and consequently, leads to an increase in dry growth (Figure 3C). The mean of relative Mg content
was 59%, 29% and 12%, for leaves, stem and roots, respectively (Figure 3D).
The content of S by Jatropha plants increased according to the length of cultivation (Figure 3E). Similarly, N, P and K showed the largest relative content initially in leaves and were subsequently redistributed to the stem (Figure 3F). At 7 DAT, the relative S content was 59% and decreased to 20% at the end of the experiment, unlike the relative content increase observed for the stem, which was 23% at 7 DAT and 53% at 119 DAT. The relative S content in roots was continuous during the initial growth, accounting for a mean of 20% of the total content of plants at every sampling point. However, at the end of the experiment, the relative S content in roots increased (Figure 3E). From 21 DAT onwards, the relative S content began to decrease in leaves, and the greatest relative content was observed in the stem (Figure 3F).
Analyzing the results of content, it is clear the redistribution of N, P, K and S for the stem of the leaves with the aim of developing stem. The results indicate that during the early growth of Jatropha plants, the leaves act as a strong sink and as the plant grows, they become highly mobile sources of nutrients (N, P and K) and notably S, in the phloem.
Figure 2 - Nitrogen content [A]; nitrogen relative content [B]; phosphorus content [C]; phosphorus relative content [D]; potassium
content [E] and potassium relative content [F] in leaves, stem and roots of the Jatropha plants according with time course of the experiment (n = 5 ± standard deviation) (* and ** Significant at 5 and 1 % probability by F-test)
mass accumulation (RADFORD, 1967). As the plant grows, the allocation of assimilates to the production of structures other than leaves compromise the AGR and RGR. For Jatropha plants, the allocation of assimilates
Figure 3 -Calcium content [A]; calcium relative content [B]; magnesium content [C]; magnesium relative content [D]; sulfur content [E] and sulfur relative content [F] in leaves, stem and roots of the Jatropha plants according with time course of the experiment (n = 5 ± standard deviation) (* and ** Significant at 5 and 1 % probability by F-test)
the increased contribution to the dry mass by the stem at the experiment, in relation to other plant parts (Figure 1). Similar to C redistribution, Jatropha plants redistributed N, P, K, and S to the stem to ensure plant growth. The concentration of nutrients in stems occurs in three ways: The relative contents of N P, K and S followed the
nutrient content for the formation of structural organs, via element absorption (xylem), and from redistribution of these nutrients from older leaves for stem elongation and
the production of new leaves (WHITE, 2012). Limaet al.
(2011) reported that N, P, K and S are intensely redistributed the older leaves to other tissues of the Jatropha plants, as is little redistribution of Ca and Mg. In this study, the N, P, K and S were redistributed, or more allocated for training the stem. Thus, the stem represented strong drain on the early development of Jatropha plants.
Jatropha plants have a high initial growth rate, and N is essential for C assimilation at the beginning of the growth cycle of this species, which explains the linear absorption pattern of N. A high photosynthetic rate during the early growth of Jatropha plants, reported
by Yong et al. (2010), helps to explain the increase in
late relative content of N in the stem (77 DAT) (Figure 2B) compared to the increase in the relative content of P, K, and S in the stem (DAT 21) (Figures 2D, 2F and 3F) observed in this study. Thus, we support the hypothesis
of N and Ca during the early growth period, followed by subsequent planting in nutrient-deficient soils, can lead to malnourished plants and consequently, would hamper the plant establishment. Jatropha plants have been considered high nutritional N and Ca required specie
(GARRONEet al., 2016).
In this study, the Jatropha showed content of 275, 30, 169, 211, 87 and 52 mg/plant at 119 DAT. These results are greater than the average extract from the vegetative growth period of such nutrients for Ricinus communis (NASCIMENTO et al., 2012),
Glycine max (MAUK; NOODÉN, 1992), Phaseolus
vulgaris (BIDDULPH; CORY; BIDDULPH, 1959) and
Helianthus annuus (LOPES JÚNIOR; MAZZAFERA;
ARRUDA, 2014). Jatropha plants showed a high content of macronutrients during early growth, demonstrating the importance of the nutritional management of these elements for the establishment of Jatropha plants crops in large areas. The establishment of content curves for macronutrients in Jatropha plants indicates the dynamics of nutrient uptake during cultivation, highlighting the need to optimize nutritional management during the early growth of the species.
CONCLUSIONS
1. The highest Ca and Mg accumulation occurred in the leaves, while N, K, S and P were mostly accumulated in the stem;
2. The nutrients more taken up by Jatropha plants were N and Ca, and the order of macronutrients uptake was: N > Ca > K > Mg > S > P;
3. Jatropha plants have shown high macronutrients accumulation rates on their early development, indicating the importance of nutritional management to achieve reliable plant establishment as well as biomass yield.
ACKNOWLEDGEMENTS
This research was supported by FAPESP (Sao Paulo Research Foundation; 2011/15208-0).
REFERENCES
ABDALLAH, M.et al. Effect of mineral sulphur availability on nitrogen and sulphur uptake and remobilization during the vegetative growth of Brassica napus L. Journal of Experimental Botany, v. 61, p. 2635-2646, 2010.
that plant growth during this period is sustained by a high photosynthetic rate, which causes a greater need for N in leaves (the main photosynthetic organ), leading to a greater relative N content in leaves until 77 DAT. Subsequently, N redistribution occurred, to ensure proper plant growth. The relative N content decreased after 21 DAT; however, the relative N content in the stem was higher than in the leaves only at 77 DAT, (Figure 2B). The low mobility of Ca in the phloem explains the greater relative content of this element in the foliar tissue (Figures 3B and 4D). This latter pattern is consistent with the general assumption that Ca shows a low phloem mobility (BIDDULPH; CORY; BIDDULPH, 1959; WHITE, 2012).
Although S is not considered to be mobile in terms of redistribution, Jatropha plants plants showed the relocation of S from the leaves to the stem (Figures 3F and 4F) and even greater amounts of S accumulated in the stem, due to the higher rate of biomass allocated to this plant part. The high capacity for S redistribution from the leaves to the stem might indicate efficient S use by Jatropha plants. However, the species shows no remobilization pattern of S. In addition, intraspecific or genotypic variation in redistribution via the phloem might
exist (ROSE et al., 2015). The relative Mg content was
highest in the leaves (Figures 3D ans 4E). Thus, the Mg content by different Jatropha plants tissues did not follow the same pattern as that observed for N, P, and K – nutrients that are also considered to be highly mobile in the phloem. Under adequate supply conditions, Mg is concentrated most highly in the chloroplasts (LOPES JÚNIOR; MAZZAFERA; ARRUDA, 2014), explaining the higher content of this element in leaves and its importance in photosynthesis.
Nascimento et al. (2012) reported that N, P, K
and S are intensively redistributed from older leaves to other castor bean tissues, whereas Ca and Mg show little redistribution. In this study, N, P, K and S were redistributed, or more allocated to stem formation. Thus, the stem represents a strong sink during the initial
growth of Jatropha plants. Maillard et al. (2015) also
reported phloem mobility of N, P, K and S in Zea mays
andQuercus robur, and low mobility of Ca in phloem for
these species.
The high content of N and Ca in Jatropha plants is highly relevant and these should be supplied appropriately during the growth period, when its concentration in the soil is low, because under natural conditions, Brazilian soils have low availability in both nutrients (GARRONE
et al., 2016). Despite Jatropha plants is considered to be
a plant that is well adaptated to low soil fertility (SILVA
BIANCO, M. S.; CECÍLIO FILHO, A. B.; CARVALHO, L. B. Nutritional status of the cauliflower cultivar ‘Verona’ grown with omission of out added macronutrients. Plos One, v. 10, n. 4, p. 1-17, 2015.
BIDDULPH, O.; CORY, R.; BIDDULPH, S. Translocation of calcium in the bean plant. Plant Physiology, v. 34, p. 512–519,
1959.
CHAUDHARY, D. R.; GHOSH, A. Bioaccumulation of nutrient elements from fly ash-amended soil in Jatropha curcas L.: a biofuel crop. Environmental Monitoring Assessment, v. 185, p. 6705-6712, 2013.
EDRISI, S. A. et al. Jatropha curcas L.: a crucifed plant
waiting for resurgence.Renewable and Sustainable Energy Reviews, v. 41, p. 855-862, 2015.
GARRONE, R. F. et al. Biomass yield, macronutrient diagnosis, and nitrogen and calcium uptake during early growth of Jatropha plants. Revista Ciência Agronômica, v. 47, p. 22-31, 2016.
HOAGLAND, D. R.; ARNON, D. I. The water-culture method for growing plants without soil. Berkeley: California
Agricultural Experiment Station, 1950. 32 p. (Circular 347). LIMA, R. L. S.et al. Redistribuição de nutrientes em folhas de
pinhão-manso entre estádios fenológicos.Revista Brasileira de Engenharia Agrícola e Ambiental, v. 15, p. 1175-1179, 2011.
LOPES-JÚNIOR, C. A.; MAZZAFERA, P.; ARRUDA, M. A. Z. A comparative ionomic approach focusing on cadmium effects in sunflowers (Helianthus annuus L.). Environmental and Experimental Botany,v. 107, p. 180-186, 2014.
MAILLARD, A. et al. Leaf mineral nutrient remobilization
during leaf senescence and modulation by nutrient deficiency.
Frontiers in Plant Science, v. 6, n. 317, p. 1-15, 2015. MALAVOLTA, E.; VITTI, G. C.; OLIVEIRA, S. A.Avaliação do estado nutricional das plantas: princípios e aplicações. 2. ed. Piracicaba: Potafos, 1997.
MAUK. C. S.; NOODÉN, L. N. Regulation of mineral redistribution in pod-bearing soybean explants. Journal of Experimental Botany, v. 43, p. 1429-1440, 1992.
MOREIRA, A.; FAGERIA, N. K. Yield, uptake, and retranslocation of nutrients in banana plants cultivated in upland soil of central Amazonian.Journal of Plant Nutrition, v. 32, p. 443-457, 2009.
NASCIMENTO, M. S. et al. Nutrient extraction and
exportation by castor bean hybrid Lyra. Revista Brasileira de Ciência do Solo, v. 36, p. 113-124, 2012.
RADFORD, P. J. Growth analysis formulae: their use and abuse.Crop Science, v. 18, p. 171-175, 1967.
ROSADO, T. B. et al. Molecular markers reveal limited
genetic diversity in a large germplasm collection of the biofuel cropJatropha curcas L. in Brazil.Crop Science, v.50,
p. 2372-2382, 2010.
ROSE, T. J. et al. Perturbation of nutrient source–sink
relationships by post-anthesis stresses results in differential accumulation of nutrients in wheat grain. Journal of Plant Nutrition and Soil Science, v. 178, p. 89-98, 2015.
SANTOS, E. F. et al. Photosynthesis rate, chlorophyll content and initial development of Jatropha plants without micronutrient fertilization. Revista Brasileira de Ciência do Solo, v. 37, p. 1334-1342, 2013.
SILVA, E. N. et al. Photoprotective function of energy dissipation by thermal processes and photorespiratory mechanisms in Jatropha curcas plants during different
intensities of drought and after recovery. Environmental Experimental Botany, v. 110, p. 36-45, 2015.
SOUZA, P. T. et al. NPK fertilization on initial growth of Jatropha plants seedlings in quartzarenic neossol. Revista Brasileira de Ciência do Solo, v. 35, p. 559-566, 2011. WHITE, P. J. Long-distance transport in the xylem and phloem.In: MARSCHNER, P. (Ed.).Marschner’s mineral nutrition of higher plants. 3rd ed. Berlin: Elsevier, 2012. p. 49-70.
YONG, J. W. et al. Effect of fertilizer application on
photosynthesis and oil yield of Jatropha curcas L.


![Figure 2 - Nitrogen content [A]; nitrogen relative content [B]; phosphorus content [C]; phosphorus relative content [D]; potassium content [E] and potassium relative content [F] in leaves, stem and roots of the Jatropha plants according with time course of](https://thumb-eu.123doks.com/thumbv2/123dok_br/15868676.664401/7.892.99.798.288.1072/nitrogen-nitrogen-phosphorus-phosphorus-potassium-potassium-jatropha-according.webp)
![Figure 3 - Calcium content [A]; calcium relative content [B]; magnesium content [C]; magnesium relative content [D]; sulfur content [E] and sulfur relative content [F] in leaves, stem and roots of the Jatropha plants according with time course of the exp](https://thumb-eu.123doks.com/thumbv2/123dok_br/15868676.664401/8.892.106.789.174.927/calcium-relative-magnesium-magnesium-relative-relative-jatropha-according.webp)
