A PROPOSED METHODOLOGY FOR THE CORRECTION OF THE LEAF AREA
INDEX MEASURED WITH A CEPTOMETER FOR PINUS AND EUCALYPTUS
FORESTS
1Domingos Mendes Lopes2*, Nigel Walford3, Helder Viana4 and Carlos Roberto Sette Junior5
1 Received on 12.04.2013 accepted for publication on 12.08.2016.
2 Centre for the Research and Technology of Agro-Environmental and Biological Sciences, CITAB, Universidade de Trás-os-Montes e Alto Douro, Departamento de Ciências Florestais e Arquitetura Paisagista, Quinta de Prados - Portugal. E-mail: <dlopes@utad.pt>.
3 Kingston University, School of Geography, Geology and the Environment, Penrhyn Road, Kingston upon Thames - United Kingdom. E-mail: Email <nwalford@kingston.ac.uk>.
4 Instituto Politécnico de Viseu, Escola Superior Agrária de Viseu, CI&DETS Research Centre, Quinta da Alagoa, Estrada de Nelas - Portugal. Email: <viana.h@gmail.com>.
5 Universidade Federal de Goiás, Escola de Agronomia, Goiania, GO - Brasil. E-mail: <crsettejr@hotmail.com>. *Corresponding author.
ABSTRACT – Leaf area index (LAI) is an important parameter controlling many biological and physiological processes associated with vegetation on the Earth's surface, such as photosynthesis, respiration, transpiration, carbon and nutrient cycle and rainfall interception. LAI can be measured indirectly by sunfleck ceptometers in an easy and non-destructive way but this practical methodology tends to underestimated when measured by these instruments. Trying to correct this underestimation, some previous studies heave proposed the multiplication of the observed LAI value by a constant correction factor. The assumption of this work is LAI obtained from the allometric equations are not so problematic and can be used as a reference LAI to develop a new methodology to correct the ceptometer one. This new methodology indicates that the bias (the difference between the ceptometer and the reference LAI) is estimated as a function of the basal area per unit ground area and that bias is summed to the measured value. This study has proved that while the measured Pinus LAI needs a correction, there is no need for that correction for the Eucalyptus LAI. However, even for this last specie the proposed methodology gives closer estimations to the real LAI values.
Keywords: LAI; Underestimation; Clumping.
PROPOSTA DE UMA METODOLOGIA PARA A CORREÇÃO DO ÍNDICE DE
ÁREA FOLIAR MEDIDO PELO CEPTÓMETRO EM POVOAMENTOS DE
PINUS E EUCALYPTUS
RESUMO – O índice de área foliar (IAF) é um parâmetro importante que controla muitos processos biológicos e fisiológicos associados à vegetação, entre as quais a fotossíntese, a respiração, a transpiração e o ciclo do carbono. O IAF pode ser medido indiretamente, de uma maneira fácil e não destrutiva, como pelo uso de ceptometros sunfleck. Contudo, esta metodologia, apesar de prática, tende a subestimar o IAF em grande parte devido à forma como as folhas se organizam nas copas, em especial o agrupamento das acículas em coníferas. Na tentativa de corrigir esta deficiência, propõe-se a multiplicação do valor de IAF medido por um fator de correção constante. Em contrapartida, assume-se que o IAF obtido a partir das equações alométricas não é tão problemático e pode ser usado como uma referência para estimar o IAF e desenvolver uma nova metodologia para corrigir as médias obtidas pelo ceptometro. Esta nova metodologia assume que o erro (a diferença entre o IAF do ceptometro e o IAF de referência) é estimado como uma função da área basal por hectare. O erro obtido deve então ser somado ao IAF do ceptometro, para se obter um valor corrigido. Este estudo mostrou ainda que, embora o IAF da Pinus necessite da aplicação desta correção, não há necessidade de aplicar no casa do IAF para a Eucalyptus. No entanto, mesmo para esta última espécie a metodologia proposta dá estimativas mais próximas dos valores reais de IAF.
1. INTRODUCTION
The LAI is defined as the projected leaf area per unit ground area (GOWER; NORMAN, 1991; BEHERAA ET AL., 2015), which means one half of the total leaf area per unit ground surface area (CHEN; CIHLAR, 1995). According to Chen and Black (1992), this definition is clear for flat broad leaves but for coniferous leaves, (which may be cylindrical or close to hemicylindrical), or foliage clumps (which may be spherical, ellipsoidal and other shapes) the meaning one-sided area is not so clear. Because of that, and according to them, there have been numerous studies in which LAI is defined on the basis of projected leaf area.
LAI is a key variable in driving the biological processes of the plants, thus is a necessary input variable in many ecological models studying canopy structure and productivity (BEHERAA et al. 2015). Leaf area index drives both the within- and the below-canopy microclimate, determines and controls below-canopy water interception, radiation extinction, water and carbon gas exchange and is, therefore, a key component of biogeochemical cycles in ecosystems (ESPAÑA et al. 2008). Any change in canopy leaf area index (by frost, storm, defoliation, drought, management practice) is accompanied by modifications in stand productivity (BRÉDA, 2003). Eriksson et al. (2006) reinforces the LAI importance in carbon balance models.
Numerous approaches of destructive and non-destructive LAI measurements have been developed (LOPES; ARANHA, 2000; DEMAREZ ET AL., 2008). Direct or semi-direct methods involve a measurement of leaf area, using either a leaf area meter or a specific relationship of dimension to area via a shape coefficient. In coniferous species, projected leaf area differs from the developed one by a coefficient depending on a needle cross-sectional area (BRÉDA, 2003). Leaf area is measured on a sub-sample of leaves and related to dry mass (e.g. via specific leaf area, SLA, cm2 g-1). Finally, the total dry mass of leaves collected within a known ground-surface area is converted into LAI by multiplying by the SLA.
LAI measurements based on the allometric relations are influenced by environmental factors such as species, age, stand density and other stand parameters and therefore may not be transferable to other forests (DEBLONDE ET AL., 1994; CHEN; CIHLAR, 1995). Indirect measurements involve estimating LAI from the light penetration through canopies (DEBLONDE et al., 1994).
Because direct estimates of LAI in forests are very laborious, the development of instrumentation and theory to rapidly estimate LAI has received a great deal of attention (GOWER; NORMAN, 1991). Optical instruments are very attractive to many investigators because of the speed and non-destructive nature of the measurements (CHEN; CIHLAR, 1995). PIAYDA et al. (2015), have tested a digital cover photography (DCP), with promising results. Gower and Norman (1991) describe the most important instruments currently used to estimate LAI, such as the Plant Canopy Analyser (LAI-2000, Li-Cor), which detects the penetrating diffuse light at five angles simultaneously and the Demon and the Sunfleck Ceptometer, which make use of the transmitted direct light. According to Demarez et al. (2008), these non-destructive methods that generally use optical sensors are fast to apply and allow the sampling of large areas. As reported by Hernández et al. (2012), it is difficult to obtain accurate LAI estimations of high spatial resolution over large areas.
The estimate of LAI provided by the LAI-2000 and similar plant canopy analysers (CA) is obtained by inversion from measured canopy transmittance (gap fraction) under the assumption that leaves are randomly (Poisson) distributed in the canopy (STENBERG et al., 2003). In conifers forests this assumption generally does not hold true. This is the reason for Stenberg (1996) to report that the LAI-2000 plant canopy analyzer tends to underestimate the leaf area index (LAI) of coniferous stands because of the clumped (nonrandom) arrangement of needle area in the crown and that is why it has been proposed that, in stands where the individual shoots constitute the most important clumping elements, the LAI-2000 gives an estimate of shoot silhouette area index rather than LAI. To obtain the true LAI, the instrument reading should then be multiplied by a correction factor accounting for the overlap of needles on shoots.
parameter of plant canopies that influences canopy radiation regimes and controls canopy photosynthesis and other land–atmosphere interactions (PISEK et al., 2015).
Gower and Norman (1991) proposed the multiplication of the observed LAI value by the corresponding total projected needle area to shoot silhouette area and found that this ratio ranged between 1.67 and 1.40, with a medium value of 1.5, for the four studied species (Quercus rubra, Pinus strobus, Pinus resinosa and Larix decidua).
Chen and Cihlar (1995) have developed a new theory for gap size analysis to improve optical measurements of LAI of plant canopies. In this theory, the element clumping index quantifying the effect of non-random spatial distribution of foliage elements is derived from the change in canopy gap fraction after the removal of large gaps appearing at probabilities in excess of predictions for a random canopy. In practice the corrected LAI (LAICOR) is described by equation 1.
where E , represents the ratio of half the total leaf area in a shoot to half the total shoot area and
E, represents the clumpling index for elements (shoots). While, according to PIAYDA et al. (2015), for Quercus suber woodland, in the south of Portugal, the clumping index () ranges for different heights and low view zenith angles around 0.5, reflecting the sparse canopy structure of this stand, Chen and Cihlar (1995) pointed that the E and E should be 2.08 and 0.91, for the red pine, and 1.3 and 0.88, for the jack pine, respectively. Subsequently this paper is proposing a new methodology to correct the ceptometer LAI (easier to obtain), to closer values to the reference LAI. This new methodology should assume that the measured values are not always underestimating the reference values and that the bias is not always a constant fraction of the measured value, as the methodologies proposed by Gower and Norman, (1991) and Chen and Cihlar (1995). A second goal is to understand if the limitations of the ceptometer measurements are only related to the conifer or if a broadleaved tree, even if a peculiar crown, such as the Eucalyptus globulus, present a similar behaviour and if the new above proposed methodology is still suitable for this case.
2. MATERIAL AND METHODS
The study was conducted in two areas in the north of Portugal. The Pinus pinaster stands are located across all North of Portugal, where as 102 sampling plots, each with an area of 500 m2, were established. The Eucalyptus
globulus stand is a much shorter area, located 30 km southeast of Vila Real, in a village called Amarante. In this case, only 25 plots were established. There is a huge discrepancy between the study area and the number of sampling plots for the Pinus pinaster and the Eucalyptus globulus. This way, any conclusion obtained from this study is only preliminary and indicative and, at least for the Eucalyptus the database should be increased. Both stands are unmixed, so pure forests, and both species are ecologically well adapted to both places [the obtained results proved this because while the
Eucalyptus stand presented an average diameter at breast height of 11.1 cm; average height of 12.7m; with a stand density; with 1169 of trees ha-1; and with an age of 7 years old; the Pinus study area had an average diameter at breast height of 19.4 cm, an average height of 13.8 m; with a stand density of 1062of trees ha-1; and with an age of 35 years old].
In the Eucalyptus area LAI was measured during the summer, in the middle of July 2001, and the Pinus
database was obtained from measurements made during summers, between years 2001 and 2009. In this last case, these measurements were not all made specifically for this study and this specific database was obtained from previous studies developed by the authors during that period. In both situations LAI measurements were done using a sunfleck ceptometer, following the procedures indicated by the manual and described with more detail by Lopes (2005). This value was called the ceptometer LAI.
Simultaneously, all within trees diameters at the breast height (dbh) were measured, as sampling plots were always with 500 m2, and later allometric equations were used to estimate the foliar biomass. The specific leaf area for both species was determined and, using this value, the leaf area index was calculated. The LAI value obtained by the allometric equations was used to compare the LAI obtained by the ceptometer and was designated as the reference LAI.
For the Pinus stands the allometric equations were adjusted using biomass data of 30 trees collected across the entire Trás-os-Montes region. Trees were collected (1)
E E OBS COR LAI LAI *
from a range of dbh with a minimum of 7.5 cm and a maximum of 37.5 cm. Lopes and Aranha (2004) described the methodology to collect and adjust those equations, but the best equation for estimating foliar biomass was not yet published. That way, and based on data from Lopes and Aranha (2004), the selected equation to estimate dry leaf biomass, knowing the dbh (m), was equation 2.
Log (leaf biomass)=-7.427+100.639dbh R2 = 0.768 R2
adj =0.759
For the Eucaluptus globulus, Fabião (1986) has already constructed and tested some regression models which allow estimating partial individual biomass, for Portuguese conditions. This research was based in 7 study areas distributed for all Portugal but mainly located on littoral zones where Eucalyptus globulus
stands are more frequent and this specie is well adapted. The equations adjusted by Fabião (1986) are only related with first rotation stands and with a similar age to the study area (10 years old), and with an average dbh of 14.2 ± 4.4 cm and an average height of 18.49 ± 3.95 m.
The available regression model was equation 3. Log (leaves biomass)=-6.989+3.157log(dbh) R2 = 0.976 R2
adj =0.94
To measure the specific leaf area (SLA) three hundred leaves from each one of the species were randomly collected from different parts and levels of the crop of the average tree from one sampling plot randomly selected. Sampled leaves were young and fully expanded, taken randomly from the entire crown and without serious herbivore and pathogen damage.
For measuring the Eucalyptus globulus leaf area, each leaf was drawn in a paper file and its area measured using a digital planimeter. The total leaf area of each leaf was obtained by multiplying the display value by two in order to calculate the total two-sided leaf area. For the Pinus pinaster, a conifer, the methodology proposed by Hallgren (2003) was followed and the radius (r) and length (l) of each needle was measured. Therefore, the area per fascicle (Af) was calculated using the following equation 4.
in which, n represents the number of needles per fascicle. After leaf area calculation of all samples, these materials were dried at 70 ÚC till total dehydration.
This dry mass value was used to calculate specific leaf area using the leaf area values previously measured.
The observed bias, between the reference and the ceptometer LAI, were analysed. As it was found a strong relationship between that bias and the basal area per unit area, a correction methodology, to correct the ceptometer LAI, was adjusted and tested. As the basal area is an easily calculated variable because it is simply a function of the dbh and diameters are always measured during the forest inventories. Additionally there are other practical methodologies for measuring basal area, as the one which uses the Bitterlich relascope for counting the number of trees with a dimension above a specific band of the relascope. Consequently, in this new proposed correction the estimated bias (representing the difference between the ceptometer value and the reference one), will be a function of the basal area per unit hectare.
In the following stages, the LAI corrections indicated in the literature review were tested and the results were compared with the reference LAI, the measured LAI and the corrected LAI using this new methodology.
To validate all these results the Pinus database was dived in 82 sampling plots for the adjustment of the correction model and 20 were used for the model validation. The Eucalyptus one was also dived and 19 sampling plots were used for the correction adjustment and only 6 sampling plots were used for its validation. The statistics selected for validation were the mean error (ME) (equation 5) and the mean absolute error (MAE) (equation 6).
3. RESULTS 3.1. Results from the adjustment phase
The average value for the specific leaf area for the Pinus pinaster was 52.5 (±5.68) cm2 g-1 and for the Eucalyptus globulus was 82.6 (±16.21) cm2 g-1. In terms of Pinus LAI, the average value for the ceptometer LAI was 2.30 (±1.084) and the allometric one was 3.00 (±1.402), while for the Eucalyptus the (2)
(3)
(4) Af= 2rl (n+π)
(5)
(6)
n LAIc LAIr
ME
average LAI values were 1.31 (±0.534) and 1.70 (±1.066), respectively.
The adjusted models for the bias (the difference between the ceptometer and the reference LAI), which means the of the Ceptometer LAI corrections, using basal area (G) as the input variables are presented in equations 7 (coincident with the results obtained by Lopes et al., 2014) and 8 (new results).
Bias for the Pinus pinaster: Bias=-1.35628+0.068146G
R2= 0.672; R2adj.= 0.669; RMSE = 0.649) Bias for the Eucalyptus globulus: Bias=-1.14636+0.128728G
R2= 0.711; R2
adj.= 0.698; RMSE = 0.559) And the corrected LAI will be then obtained by the sum of the bias (equation 9), while in the previous corrections, obtained from the literature review, had a different structure, using a constant correction factor (Corrected LAI= Observed LAI * Correction Factor).
Corrected LAI:
Corrected LAI= Observed LAI + Bias
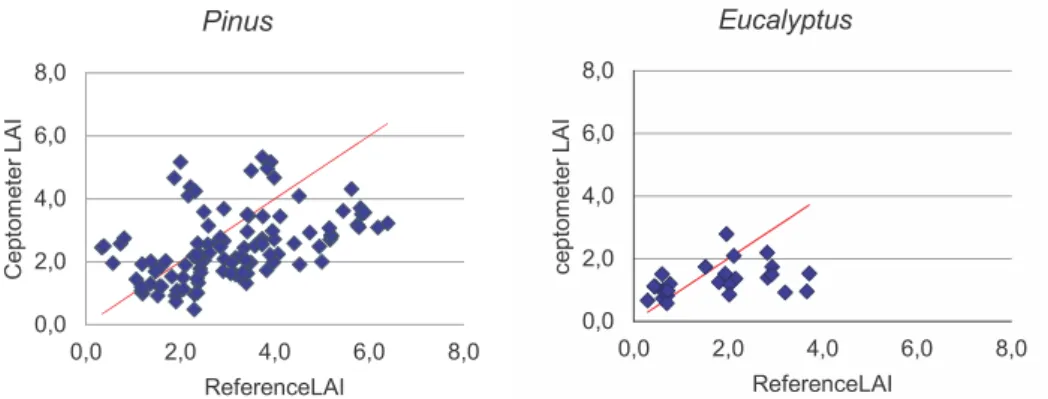
Figure 1A shows that the conifers LAI estimations from CAs tend mainly to underestimate the LAI, compared with the reference values. However, there are still some overestimations, especially for cases with a low LAI value.
Even if this bias is mainly reported for conifers trees on the literature review, there was some interest in studying the behaviour of the Eucalyptus because it is not a typical broadleaved tree. A lot of times its leaves are usually near a vertical position, relative to the main stem, trying to use light in a more efficient way. Gower and Norman (1991) had already studied the Quercus rubra and had concluded that there was no difference with this specie, compared with conifers. By comparing the Eucalyptus ceptometer LAI and the reference LAI, we could observe that also for this specie there were some biases between both (Figure 1B). However, in this case there is no main example of underestimation because there is also around fifty per cent overestimation. In a simplistic analysis we would say that the overestimation is essentially related to the lower LAI values and the underestimation is related to the higher LAI values.
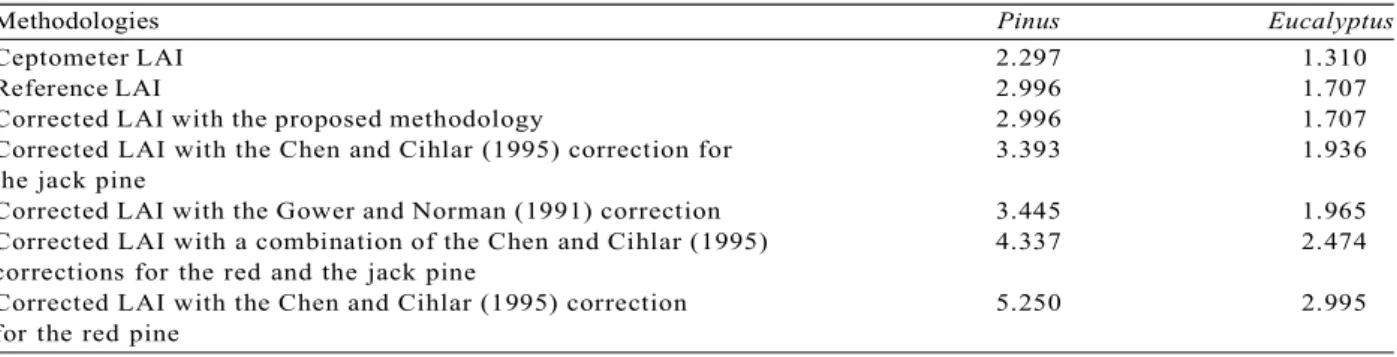
Table 1 summarises the average LAI and the standard deviation values from all the tested corrections. One Anova test and a Duncan new multiple range test were also carried out to understand if the tested methodologies would give us different LAI estimations. The ceptometer tends generally to underestimate the Pinus LAI and assumes it as more homogeneous. The LAI measured with the ceptometer was then corrected using different methodologies, including the proposed one by this study.
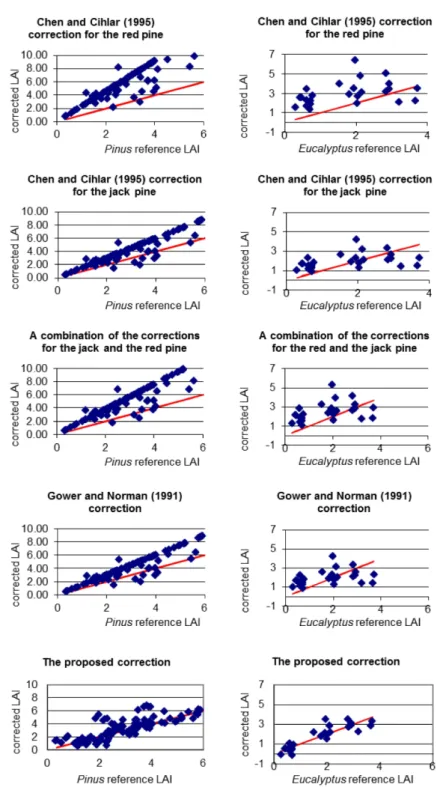
While the red pine correction overestimates the
Pinus LAI values, the jack pine correction and the one proposed by Gower and Norman (1991) are closer (7)
(8)
(9)
Figure 1 – Reference LAI from allometric relations compared to ceptometer LAI for the Pinuspinaster (A) and for the
Eucalyptusglobulus (B).
Figura 1 – Índice de Área Foliar obtido com relações aloméricas (reference LAI) e obtido com medidas de ceptômetro
to the observed values. However, all of them tend to overestimate the Pinus reference LAI. Figure 2.
3.2. Results from the validation phase
Table 2 summarises the validation results, which prove the results from the adjustment process.
Final proposed correction
Equations 5 and 6 where finally adjusted using all data, which means, data from de first adjustment and data from the validation. Afterwards the final equations are:
Bias for the Pinus pinaster: Bias=-0.753340+0.047963G (R= 0.614;R2= 0.377; R2
adj.= 0.357; RMSE = 0.642) Bias for the Eucalyptus globulus:
Bias=-1.1944+0.1325G (R= 0.858;R2= 0.736; R2
adj.= 0.727; RMSE = 0.514)
4. DISCUSSION
The best results for the Pinus LAI have apparently been found with the proposed methodology. Not only the average figures but also the standard deviation are similar (Table 1 and Figure 2). To correct the ceptometer LAI, Gower and Norman (1991) proposed that it should be multiplied by a correction factor of around 1.5, Chen and Cihlar (1995) suggested the value of 1.48 for the jack Pine and 2.29 for the red pine. Accordingly, it is expected that the jack pine correction and the Gower and Norman (1991) correction give similar results. The best results achieved for the jack pine are in agreement
with the studies of Gower and Norman (1991). In fact, the observed results showed that the medium correction factor for the Pinus pinaster was in reality only 1.38 (with maximum and minimum values of 2.56 and 0.62, respectively).
According to Snedecor and Cochran (1995) the quantity F should be a good criterion for testing the null hypothesis that the population means are the same in all methodologies. From this analysis it can be proved that the differences between the LAI average values from the tested methodologies are highly significant. The Duncan test (Table 1) indicates which of the methodologies, are statistically different.
Results obtained from this research allowed to conclude that there is no statistically significant difference between the average Pinus LAI values from the reference LAI, the LAI from the proposed correction methodology, from the jack pine correction, and from the Gower and Norman (1991) correction. This means that the previous methodologies could be applied in this situation. However, with this new methodology the average LAI value is closer to the reference one. The balance between the simplification of the methodology and the accuracy of the final results should always be considered in each case.
The same previous methodologies, used to correct the Pinus measured LAI, were tested on the Eucalyptus
data. Comparing the reference and the ceptometer LAI, the average bias is even higher than the one from the
Pinus. Once again, the ceptometer tends to underestimate the reference LAI. In general, the results were similar to the ones from the Pinus, with an overestimation from the red pine correction, proposed by Chen and Cihlar (1995), and a more accurate correction with the
Table 1 – The Duncan new multiple range test and the ANOVA for the tested Pinus LAI and the Eucalyptus LAI corrections
Tabela 1 – Resultados do teste de Duncan para correções do Índice de Área Foliar (LAI), em Pinus e Eucalyptus, no norte
de Portugal.
Methodologies Pinus Eucalyptus
Ceptometer LAI 2.297 1.310
Reference LAI 2.996 1.707
Corrected LAI with the proposed methodology 2.996 1.707
Corrected LAI with the Chen and Cihlar (1995) correction for 3.393 1.936
the jack pine
Corrected LAI with the Gower and Norman (1991) correction 3.445 1.965
Corrected LAI with a combination of the Chen and Cihlar (1995) 4.337 2.474
corrections for the red and the jack pine
Corrected LAI with the Chen and Cihlar (1995) correction 5.250 2.995
for the red pine
(10)
Figure 2 –Pinus and Eucalyptus reference LAI, compared to corrected LAI using the corrections proposed by Gower and Norman, (1991) and Chen and Cihlar (1995) and using the methodology proposed by this research
Figura 2 – Índice de Área Foliar obtido com relações aloméricas (reference LAI) e obtido com medidas de ceptômetro
values indicated by Gower and Norman (1991) and with the jack pine corrections.
To apply the Gower and Norman (1995) methodology to the Eucalyptus the constant factor would be 1.33 (with a maximum correction factor of 3.82 and a minimum of 0.38).
From Table 1 we can observe that there are no differences between the Eucalyptus ceptometer LAI and the reference one. This means the proposed correction does not improve the Eucalyptus LAI estimations in any significant way. At the same time there is no significant difference between the proposed methodology and the ones for the jack pine, from Gower and Norman (1991), with 95% of probability. However, the average LAI from the proposed methodology is equal to the reference one and only slightly different from the ceptometer one.
Analysing the validation results, the correction proposed by Chen and Cihlar (1995) for the red pine is to high and the one proposed by Gower and Norman (1991) is closer to the real value. However, the best results were achieved by the new proposed methodology. For both species the new methodology improves the LAI estimation. Anyway, the number of sampling plots used to validate the methodologies was small and in future studies should be made a nd effort to increase this intensity of the sampling, not only for the validation phase but also for the adjument.
5. CONCLUSIONS
This new correction of the ceptometer LAI measured, uses the basal area per unit area as a key variable, because the basal area is well known in most cases and, if not, it can be easily obtained. The proposed
methodology does not assume that the bias between the ceptometer always tends to underestimate the reference LAI.
The second conclusion is that the problem with the inaccurate ceptometer estimation is higher with conifers, but not wholly restricted to this variety. The proposed methodology also allowed better LAI estimations for the Eucalyptus globulus.
The observed Pinus stand was very heterogeneous in terms of stand characteristics, which affected the adjusted equations to estimate the bias from the basal area. Even so, the final results were very promising. For the Eucalyptus case the gap between the two groups of LAI, the lower and the higher LAI, caution an intensification of the sampling.
As a general conclusion, there is a difference between the Pinus and the Eucalyptus measured LAI from the ceptometer, because while the measurement from the Pinus needs a correction to get closer values to the reference LAI, there is no need for that correction for the Eucalyptus. For both species, there is no difference between the Gower and Norman (1991) correction, the jack pine correction proposed by Chen and Cihlar (1995) and this new methodology. Unlike previous correction methods (GOWER; NORMAN 1991; CHEN; CIHLAR 1995), the methodology proposed here does not assume that bias from measurements with the ceptometer is constant (LOPES et al., 2014). Nevertheless the better results were always achieved with the proposed methodology.
Although, if the traditional methodologies are still the final choice, the applied correction factor should then be changed to 1.38, for the Pinus pinaster, and to 1.33, for the Eucalyptus globulus.
Table 2 – The ME and the MAE in the validation process, obtained with the application of the correction to the LAI measurements obtained with the ceptometer, for both species, in the North of Portugal.
Tabela 2 – Erro médio (ME) e erro absoluto médio (MAE) do Índice de Área Foliar (LAI) na fase de validação, obtidos
com a aplicação da correção dos valores do LAI estimados pelo ceptômetro, em povoamentos de pinheiro e eucalipto, no norte de Portugal.
Pinus Eucalyptus
ME MAE ME MAE
Corrected LAI with the proposed methodology 0.086 0.679 0.014 0.253
Corrected LAI with the Chen and Cihlar (1995) correction for the red pine -1.823 1.979 1.410 1.410
Corrected LAI with the Chen and Cihlar (1995) correction for the jack pine -0.123 1.065 0.363 0.860
Corrected LAI with a combination of the Chen and Cihlar (1995) -0.987 1.317 0.896 1.033
corrections for the red and the jack pine
6. REFERENCES
BEHERAA, S.K.; BEHERA, M.D.; TULI, R. An indirect method of estimating leaf area index in a tropical deciduous forest of India. Ecological Indicators, v.58, p.356–364, 2015.
BRÉDA, N.J.J. Ground based measurements of leaf area index: a review of methods, instruments and current controversies. Journal of
Experimental Botany, v.54, n.392, p.2403-2417, 2003.
CHEN, J.M.; BLACK, T.A. Defining leaf area index of non-flat leaves. Plant, Cell and
Environment, v.15, p.421-429, 1992.
CHEN, J.M.; CIHLAR, J. Plant canopy gap-size analysis theory for improving optical
measurements of leaf-area index. Applied Optics, v.34, n.27, p. 6211-6222, 1995.
DEBLONDE, G.; PENNER, M.; ROYER, A. Measuring leaf area index with the Li-Cor LAAI-200 in pine stands. Ecology, v.75, n.5, p.1507-1511, 1994.
DEMAREZ, V.; DUTHOIT, S.; BARET, F.; WEISS, M.; DEDIEU G. Estimation of leaf area and clumping indexes of crops with hemispherical photographs. Agricultural and Forest Meteorology, v148, p.644-655, 2008.
DUFRÊNE, E.; BRÉDA, N. Estimation of
deciduous forest leaf area index using direct and indirect methods. Oecologia, v.104, p.156-162, 1995.
ERIKSSON, H.M.; EKLUNDH, L; KUUSK, A; NILSON, T. Impact of understory vegetation on forest canopy reflectance and remotely sensed LAI estimates. Remote Sensing of Environment, v.103, p.408-418, 2006.
ESPAÑA, M.L.; BARET, F.; WEISS, M. Slope correction for LAI estimation from gap fraction measurements. Agricultural and Forest Meteorology, v.148, p.1553-1562, 2008.
FABIÃO, A.M. Contribuição para o estudo da dinâmica da biomassa e da produtividade primária líquida em eucaliptais – região litoral do centro
de Portugal. 1986. Tese (Doutorado em Engenharia Florestal) - Universidade Técnica de Lisboa, Lisboa, 1986.
GOWER, S.T.; NORMAN, J. Rapid estimation of leaf area index in conifer and broad-leaf
plantations. Ecology, v.72, n.5, p.1896-1900, 1991.
HALLGREN, S.W. Variation in leaf morphology in response to light intensity – specific leaf area. Forest Ecology – Organization notes, policies and procedures, [acessado em: 24 Jul. 2003]. Disponível em: http://www.okstate.edu/ag/asnr/ fore/hallgrn/FOR%203213/,
HERNÁNDEZ, C.; NUNES, L.; LOPES, D.; GRAÑA, M. Data fusion for high spatial resolution LAI estimation. Information Fusion. In Press, Corrected Proof. Available online 26 April 2012, 2012.
LOPES, D.M.; ARANHA J.T. A preliminary study for estimating leaf area index in a Pinus pinaster
Ait. Forest, in North-Central Portugal, using Landsat Thematic Mapper data. In Forest ecosystem modelling, upscaling and remote sensing. The Hague: SPB Academic Publishing, 2000. p213-219.
LOPES, D.; ARANHA, J.T. A proposed methodology to estimate the carbon
sequestration in a Pinus pinaster stand. In: ABSTRACTS IGBP SEMINAR 2004: Global Change and Sustainability, 15-17 of April. Évora: 2004.
LOPES, D.; NUNES, L.; WALFORD, N.; ARANHA, J.; SETTE JR., C.; VIANA, H.; HERNANDEZ, C. A simplified methodology for the correction of Leaf Area Index (LAI)
measurements obtained by ceptometer with reference to Pinus Portuguese forests. Forest Biogeosciences and Forestry, v.7, p.186-192, 2014.
LOPES. D. Estimating Net primary production in Eucalyptus globulus and Pinus pinaster ecosystems in Portugal. Thesis (PhD) - Kingston University, 2005.
M. Influence of woody tissue and leaf clumping on vertically resolved leaf area index and angular gap probability estimates. Forest Ecology and Management, v.340, p.103–113, 2015.
PISEK, J.; GOVIND, A.; ARNDT, S.K.; HOCKING, D.; WARDLAW, T.J.; FANG, H.; MATTEUCCI, G.; LONGDOZ, B. Intercomparison of clumping index estimates from POLDER, MODIS, and MISR satellite data over reference sites. ISPRS Journal of Photogrammetry and Remote Sensing, v.101, p.47-56, 2015.
RYU, Y.; NILSON, T.; KOBAYASHI, H.;
SONNENTAG, O.; LAW, B.E.; BALDOCCHI, D.D. On the correct estimation of effective leaf area index: Does it reveal information on clumping
effects?, Agricultural and Forest Meteorology, v.150, p.463-472, 2010.
SNEDECOR, G.W.; COCHRAN, W. Statistical methods. 6.ed. Ames: Iowa State University Press, 1995. 503p.
STENBERG, P. Correcting LAI-2005 estimates for the clumping of needles in shoots of conifers.
Agricultural and Forest Meteorology,
v.79, p.1-8, 1996.