MONITORING LEAF AREA INDEX AT WATERSHED LEVEL
THROUGH NDVI FROM LANDSAT-7/ETM+ DATA
Alexandre Cândido Xavier1; Carlos Alberto Vettorazzi2*
1
Instituto Nacional de Pesquisas Espaciais Divisão de Sensoriamento Remoto, Av. dos Astronautas, 1758 12227-010 - São José dos Campos, SP - Brasil.
2
USP/ESALQ - Depto. de Engenharia Rural, C.P. 09 - 13418-900 - Piracicaba, SP - Brasil. *Corresponding author <cavettor@esalq.usp.br>
ABSTRACT: Leaf area index (LAI) is an important parameter of the vegetation canopy, and is used, for instance, to estimate evapotranspiration, an important component of the hydrological cycle. This work analyzed the relationship between LAI, measured in field, and NDVI from four dates (derived from Landsat-7/ETM+ data), and with such vegetation index, to generate and analyze LAI maps of the study area for the diverse dates. LAI data were collected monthly in the field with LAI-2000 equipment in stands of sugar cane, pasture, corn, eucalypt, and riparian forest. The relationships between LAI and NDVI were adjusted by a potential model; 57% to 72% of the NDVI variance were explained by the LAI. LAI maps generated by empirical relationships between LAI and NDVI showed reasonable precision (standard error of LAI estimate ranged from 0.42 to 0.87 m2 m-2). The mean LAI value of each monthly LAI map was shown to be related to the total
precipitation in the three previous months.
Key words: biophysical variable, remote sensing, spectral vegetation indices
MONITORAMENTO DO ÍNDICE DE ÁREA FOLIAR EM NÍVEL
DE BACIA HIDROGRÁFICA POR MEIO DO NDVI DERIVADO
DE IMAGENS LANDSAT-7/ETM+
RESUMO: O Índice de Área Foliar (IAF) é um importante parâmetro do dossel da vegetação, sendo utilizado, por exemplo, para estimar a evapotranspiração, um importante componente do ciclo hidrológico. Analisou-se a relação entre o IAF, medido em campo, e o índice de vegetação NDVI, de quatro datas (a partir de dados Landsat-7/ETM+) e, com este índice, foram gerados e analisados mapas de IAF da área de estudo para as diferentes datas. O IAF foi coletado mensalmente em campo, com o equipamento LAI-2000, em áreas de cana-de-açúcar, pastagem, milho, eucalipto e floresta ripária. A relação entre o IAF e o NDVI foi melhor ajustada por um modelo potencial, sendo que de 57% a 72% da variação do NDVI puderam ser explicados pelo IAF. Os mapas de IAF gerados por modelos empíricos da relação entre o IAF e NDVI mostraram razoável precisão (o erro padrão da estimativa de IAF variou de 0,42 a 0,87 m2 m-2). O valor médio de IAF
para cada mapa mensal mostrou-se relacionado com a precipitação total dos três meses anteriores. Palavras-chave: variável biofísica, sensoriamento remoto, índices espectrais de vegetação
INTRODUCTION
Early studies have drawn the attention of the world community to the lack of clean water in some re-gions and its increasing demand for the next years. Vörösmarty et al. (2000) concluded that global-scale changes in population and economic development in the next years will dictate the future water supply and demand to a much greater degree than will changes in mean cli-mate. Currently, one billion people lack access to clean water and almost three billion people are devoid of sani-tation services (Jackson et al., 2001). Therefore, studies concerning the hydrological cycle on a basin scale may help a better understanding of the relation that human changes can cause to water circulation and distribution, assisting managers to take better decisions to minimize
damages to the environment and improving the use of water.
One important component of the hydrological cycle is evapotranspiration. For instance, approximately 70% of the total water precipitation on continental United States, is believed to return to the atmosphere by evapo-transpiration (Rosenberg et al., 1983). The Leaf Area In-dex (LAI) is one of the most important biophysical vari-ables for estimating evapotranspiration (Sellers et al., 1997). At regional scales, LAI can only be estimated by remote sensing data. Running et al. (1989), for example, mapped regional forest evapotranspiration, where LAI, which was used in the model as one canopy parameter, was estimated through remote sensing data.
sensing data. The most common SVI is the Normalized Difference Vegetation Index (NDVI), computed as NDVI= (NIR-RED) / (NIR+RED), where: RED is the reflectance in the red wavelength; and NIR is the reflec-tance in the near-infrared wavelength. Several studies have related NDVI to: LAI (Green et al., 1997; Turner et al., 1999); biomass (Tucker, 1979); fraction of ab-sorbed photosynthetically active radiation (Asrar et al., 1984); and fraction of green vegetation (Purevdorj et al., 1998). However, NDVI is affected by a combination of canopy structure and source-sensor geometry (Goetz, 1997). For example, usually NDVI increases as Solar Zenith Angle (SZA) increases (Middleton, 1991; Deering et al., 1999). Dependence of NDVI on canopy structure can be observed in the study of Spanner et al. (1990), and dependence on soil brightness, in Huete (1988). For these reasons, accurate estimating LAI con-tinually in time is a hard task, since remote sensing data are generally acquired under diverse sun-sensor geom-etry and soil brightness.
This work analyzed the relationship between LAI, measured in the field, and NDVI from four dates (derived from Landsat-7/ETM+ data), and with such SVI, gener-ated and analyzed LAI maps of the study area for the di-verse dates.
MATERIAL AND METHODS
Study area
The study area was the Ribeirão dos Marins
wa-tershed, an area of 5,973 ha (47o42’ S, 22o47 W), in
Piracicaba, State of São Paulo, Brazil. According to the Köppen classification system, the climate is Cwa, humid subtropical, with rainy summer and dry winter. The erage annual precipitation is 1,278 mm, with monthly
av-erage temperatures varying from 24.9oC in the summer
to 17.1o
C in the winter, with annual average of 21.4o
C (Sentelhas et al., 1998). The main soil types in the study area are Rhodic Eutrudox, Rhodic Hapludox, Xanthoc, Lithic Udorthents, and Kandiudalfic Eutrudox (Oliveira, 1999). The study area is covered mainly by sugar cane and pasture, and presents remnants of riparian forests, eu-calypt plantations, and small areas of annual crops and vegetables.
Field measurements
Between the 15th and the 20th days of each month
of 2001, 41 stands were visited in the watershed. When the stand presented some vegetation, LAI was measured with a LAI-2000 Plant Canopy Analyzer (LI-COR Inc., 1992). The number of replications for each land cover type was defined by LI-COR Inc. (1992) methodology, being established 10 replications for each stand of forest types (eucalypt and riparian forest), and 16 replications for each stand of non-forest types (sugar cane, corn, and
pasture). Replications within each stand were separated at least 5 m. For accurate location of each stand, a hand-held GPS receiver was used.
Remote sensing data
Four Landsat/ETM+ images (path 220 / row 76) were acquired to analyze the relationship LAI-NDVI and to generate LAI maps of the study area. They were sepa-rated in time by two to five months (01/18/2001, 03/23/ 2001, 08/14/2001, and 11/02/2001). The images were reg-istered to an existing geo-rectified image (UTM/SAD69 datum) using the nearest-neighbor method. The root mean square error for all images was approximately 0.5 pixel. The RED and NIR surface reflectance were calculated us-ing the 6S model (Vermote et al., 1997). The input pa-rameters of the 6S model used were its standard atmo-spheric model (tropical atmoatmo-spheric model) and its aero-sol model (continental model). For each of the stands where LAI was measured in the field, the average value
for a 2 × 2 or 3 × 3 pixel window of RED and NIR was
collected to calculate its respective NDVI, according to the shape and size of the stand.
Relationship between RED, NIR, and NDVI
In this work, NDVI was used because in a pre-vious analysis with data from the month of January only, Xavier & Vettorazzi (2004) found that NDVI was bet-ter correlated with LAI, when it was compared with the SVIs Simple Ratio (SR=NIR/RED; Jordan, 1969) and Soil Adjusted Vegetation Index (SAVI= 1.5(NIR-RED) / (NIR+RED+0.5); Huete, 1988). Linear (Chen & Cihlar, 1996; Fassnacht et al., 1997) and potential (Peterson et al., 1987) models, with LAI as independent variable, were used to analyze the relationships between LAI and NDVI, as well as the relationship between LAI and the individual ETM+ bands. Quadratic and cubic models were not used, since such behavior between LAI and dependent data (RED, NIR and NDVI) was not observed in the previous analysis. A residual analysis was used to identify model violations. The coefficient of
deter-mination (R2), the standard error (
se), and the observed
significance level (P) were considered in the models
analysis.
Predicting LAI and its mapping
The models LAI-NDVI for each date to predict LAI were evaluated according to Gong et al. (1995) meth-odology. LAI and NDVI were the dependent and the in-dependent variables, respectively. For each date, the samples were split into two groups, predicting and test-ing. The predicting group was used in the coefficient es-timation to establish the prediction equations, while the
test group was used to calculate se. Separation between
RESULTS AND DISCUSSION
During 2001 field campaign, the average
tem-perature was 22.5oC with a mean maximum of 26.0oC and
a mean minimum of 18.5oC, in February and June,
respec-tively. The total precipitation was 1,372 mm (Figure 1; DAEE, 2002), the accumulated precipitation from April to September was only 18% of total precipitation for the year. The correlation between mean temperature and pre-cipitation during 2001 was high (0.84).
In the field campaign, LAI was collected in stands of sugar cane, pasture, corn, eucalypt, and riparian for-est. LAI ranged from 0.16 to 4.90 (sugar cane and ri-parian forest, respectively). However, the maximum LAI observed in the months in which images were acquired was 4.51 (remnant of riparian forest, November). Table 1 summarizes the results of LAI field campaign for the months in which images were acquired. A complete analysis of LAI data can be seen in Xavier & Vettorazzi (2003).
Figure 2 shows box-plots of LAI data for the months in which images were acquired. Except for Au-gust, LAI ranges were similar. The lower LAI values col-lected in August were a result of the meteorological con-ditions, with lower precipitation and temperature, as well as the great amount of sugar cane data, being that in such period, most of these stands were in the initial stage of development.
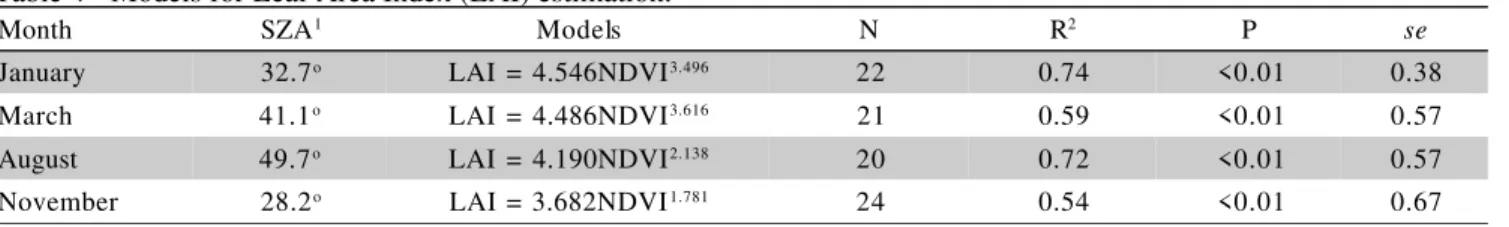
Summarized results of field campaign when images were acquired
Land cover January March August November
Sugar cane 22 (0.47; 2.37) 23 (0.58; 2.39) 24 (0.16; 2.53) 23 (0.48; 2.60)
Corn 2 (1.26; 1.86) - - 2 (1.61; 2.16)
Pasture 3 (1.09; 2.03) 3 (2.06; 2.45) 1 (0.85) 4 (0.72; 1.64) Eucalypt 3 (1.99; 3.11) 3 (2.07; 3.13) 3 (2.00; 2.52) 3 (1.66; 2.45) Riparian forest 2 (3.21; 4.48) 2 (2.89; 3.90) 2 (1.96; 2.59) 2 (2.93; 4.51) Total 32 (0.47; 4.48) 31 (0.58; 3.90) 30 (0.16; 2.59) 34 (0.48; 4.51) Table 1 - Number of stands in the months in which images were acquired, per land cover type. In parentheses, minimum and
maximum Leaf Area Index (LAI) values.
Figure 2 - Box-plots of Leaf Area Index (LAI) field campaign data for January, March, August, and November.
Max. Min. 75 % 25 %
Median
Jan. Mar. Aug. Nov.
LAI
Month
Max. Min. 75 % 25 %
Median
Jan. Mar. Aug. Nov.
LAI
Month Figure 1 - Precipitation and mean monthly temperature during 2001
of Ribeirão dos Marins watershed.
Relationship between LAI and individual bands (RED and NIR)
The relationship between LAI and RED is char-acterized by radiation absorption in the red wavelength by pigments in leaves, while the relationship between LAI and NIR is characterized by multiple scattering of radiation in near-infrared wavelength by the leaves (Gates et al., 1965). Consequently, a negative relation-ship between LAI and RED is expected. As LAI in-creases, a larger leaf area will absorb more red radia-tion, therefore reflecting less this wavelength. The LAI-NIR relationship would be positive due to an increase of the multiple scattering of the radiation in this wave-length as leaf area increases. The variations of RED and NIR depend, besides LAI, on other factors, like: i) canopy structure (e.g. closure, leaf angle distribution, plant height etc.) (Asrar et al., 1985; Myneni et al., 1997); ii) target and source-sensor geometry (Middleton, 1991; Walter-Shea et al., 1997; Deering et al., 1999); iii) background brightness (Huete, 1988).
The relationships between LAI and RED, evalu-ated separately in each of the four months, were
signifi-cant (P < 0.01). The empirical models that best fit these
relationships for all months were linear negative
(Fig-ure 3). The coefficient of determination (R2) ranged from
0.50 to 0.68 (Table 2). The magnitudes of R2 found in
this work were consistent with those found in other
stud-ies: Holben et al. (1980), R2=0.57 for soybean; Peterson
0 50 100 150 200 250
Jan. Feb. Mar. Apr. May Jun. Jul. Aug. Sep. Oct. Nov. Dec. Month
Precipitation
(mm)
0 5 10 15 20 25 30
Temperature (°C)
et al. (1987), R2=0.89 for forest; Spanner et al. (1990),
R2=0.80 for forest; and Gong et al. (1995), R2=0.72 for
forest.
Eucalypt data generally presented lower RED val-ues than other land cover types for the same LAI range. This behavior might be associated with the amount of shadow of this land cover resulting from its canopy struc-ture. Eucalypt plantations in the study area were in the adult stage, planted in rows spaced 3 m, showing several gaps in the canopy, thus increasing the shadow amount and, consequently, decreasing RED values. Riparian for-est did not present such behavior. In the field, differently of eucalypt, riparian forest did not present so many gaps in its canopy. Certainly the color of the leaves and the pigments, for instance, had influenced the RED response. Future radiometric studies may help to better understand and analyze this result.
LAI-RED regressions for January and March and for August and November presented equal intercepts and
slopes (P = 0.05). Two of the possible sources that may
justify RED variation in similar levels of LAI in the dis-tinct dates are the respective SZA and the background conditions for each date, since it was considered in this work that atmospheric effects were adequately corrected for all dates. Some examples of observed SZA-RED be-havior can be cited: i) RED reduction as SZA increased, in wheat (Jackson et al., 1979); ii) Middleton (1991)
ob-Date SZA1 Models N R2 P se
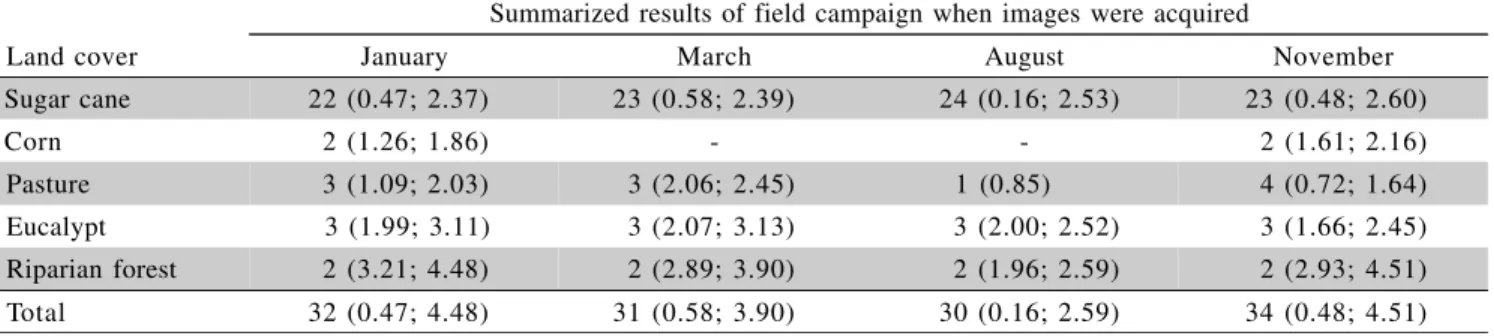
January 32.7o RED = -0.017LAI + 0.080 32 0.64 <0.01 0.01
March 41.1o RED = -0.015LAI + 0.067 31 0.53 <0.01 0.01
August 49.7o RED = -0.038LAI + 0.137 30 0.68 <0.01 0.02
November 28.2o RED = -0.031LAI + 0.140 34 0.50 <0.01 0.03
Table 2 - Models for the relationships between Leaf Area Index (LAI) and Red Reflectance (RED).
1Solar Zenith Angle
served diverse behaviors in this relationship in tallgrass prairie, but the most frequent behavior was also RED re-duction as SZA increased; iii) nearly linear RED decrease as SZA increased for black spruce and jack pine, as a re-sult of darker shadows for greater SZA; and for aspen, the relationship between SZA and RED was nearly con-stant due to the lack of strong differences in reflectance between sunlit and shadowed understory hazelnut canopy (Deering et al., 1999).
For a given LAI value, RED frequently decreased as SZA increased or, at least, RED values were constant for SZA variations, as seen regarding November’s RED response in this work, which presented the lower SZA
(28.2o) and higher or equivalent RED values for the same
LAI range compared with the other months (Figure 3).
However, RED values for August (SZA=49.7o) had an
opposite SZA-RED behavior, since for this date RED val-ues were greater than those observed in January and
March, with lower SZA, 32.7o and 41.1o, respectively.
This result might be associated with higher background brightness as a result of the lack of rainfall in August, which caused greater RED values than those observed for January and August.
RED values for eucalypt seem to be less affected by SZA and background. A pattern of low values for all dates, possibly due to the high amount of shadows for di-verse SZAs, may have constrained the influence that background brightness could have on the spectral re-sponse of this land cover.
General correlation between LAI and NIR for
the distinct dates was not observed (P > 0.05). For this
relationship, no correlations were also observed in for-est areas (Peterson et al., 1987; Spanner et al., 1990). Peterson et al. (1987) found that no significant relation-ship between LAI and NIR occurred as a result of varia-tion in canopy closure, understory vegetavaria-tion, and back-ground reflectance. In this work, when only non-forest stands were considered, the relationship LAI-NIR
be-came significant (P < 0.05) for January and March,
al-though with low R2 (0.36 and 0.26, respectively), and
that means that the canopy structure influenced NIR re-sponse for the studied land covers, as observed in other studies.
The average values of NIR in the stands where LAI were collected, for January, March, August, and
No-vember, were 0.34a, 0.29b, 0.25c, 0.32ab (values followed
Figure 3 - Scatter diagram between Leaf Area Index (LAI), Solar Zenith Angle (SZA), and Red Reflectance (RED) for January, March, August, and November.
0.20
LAI
SZA (o)
? ?
? ?
red reflectance
November
January M arch August
0.20
LAI
SZA (o)
? ?
? ?
red reflectance
November
January M arch August
by same letters do not differ at 5%), respectively. The NIR response was only dependent on SZA, which could ex-plain only 35% of the NIR variance; NIR decreased at the rate of 0.0036 per degree of SZA increase (Figure 4). Distinct behaviors in the relationship SZA-NIR were ob-served in other studies. Studying tallgrass prairie, Middleton (1991) observed that generally NIR decreased with increasing SZA, when green biomass was high, and canopies with low green biomass presented constant low NIR values for diverse SZA. Deering et al. (1999) ob-served: i) for black spruce, NIR decreased as SZA in-creased, as a result of dense upper canopy architecture; ii) for jack pine, constant NIR for diverse SZA; and iii) for aspen, NIR tended to increase as SZA increased. For a better understanding of the results, it would be
neces-sary running an in situ radiometric field campaign where
reflectance data would be collected under diverse SZA and soil brightness for the studied land cover types.
Apparently, eucalypt NIR values as well as RED values, for distinct dates, were lower than NIR values of other land-cover types for similar LAI. Again, this fact can be the result of higher amount of shadow in the eu-calypt plantation.
Relationship LAI-NDVI
The relationship between LAI and NDVI revealed similar patterns for the four dates (Figure 5). Potential model gave the best fit for LAI-NDVI relationships,
where R2 were not different (
P < 0.05), ranging from 0.57
(November data) to 0.72 (January data), equivalent to the
magnitude of R2 observed in other studies under varied
land-cover types (Peterson et al., 1987; Spanner et al., 1990; Fassnacht et al., 1997; Green et al., 1997; Turner
et al., 1999). The se ranged from 0.06 to 0.12 (Table 3).
The NDVI is dependent on RED and NIR
re-sponse of the target, since NDVI= f (RED, NIR), and
re-flectance in these individual bands are the result of the interaction between target and sensor-source geometry. For instance, changes on SZA for the same target can cause variations in NDVI values because, at first, single bands are affected in distinct manners (Middleton, 1991; Deering et al., 1999). Epiphanio & Huete (1995) have al-ready determined the dependence of NDVI on the indi-vidual bands. In this work, this relationship was evalu-ated for the RED and NIR range of values found for the diverse land cover types in the studied area. Figure 6 shows the gradient vector field of NDVI, where vectors
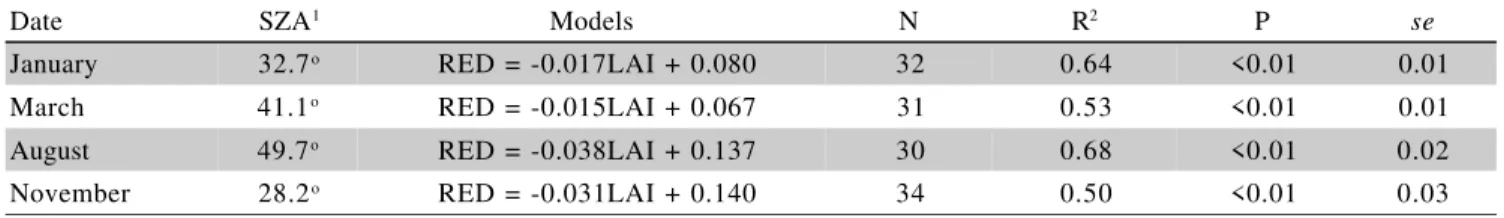
Table 3 - Leaf Area Index (LAI)-Normalized Difference Vegetation Index (NDVI) models for the four dates.
Date SZA1 Models N R2 P se
January 32.7o NDVI = 0.687LAI0.181 32 0.72 <0.01 0.06
March 41.1o NDVI = 0.685LAI0.200 31 0.62 <0.01 0.06
August 49.7o NDVI = 0.486LAI0.343 30 0.71 <0.01 0.12
November 28.2o NDVI = 0.496LAI0.347 34 0.57 <0.01 0.09
1Solar Zenith Angle
Figure 4 - Scatter diagram between Leaf Area Index (LAI), Solar Zenith Angle (SZA), and Near-infrared Reflectance (NIR) for January, March, August, and November (NIR = 0.4381-0.0036SZA; R2=0.35; se=0.04; P < 0.01).
LAI
SZA (o)
near
-infrared reflectance
November
March August
January
? ?
?
LAI
SZA (o)
near
-infrared reflectance
November
March August
January
? ?
?
Sugar cane Pasture Corn Eucalypt Riparian forest
Figure 5 - Scatter diagram between Leaf Area Index (LAI), Solar Zenith Angle (SZA), and Normalized Difference Vegetation Index (NDVI) for January, March, August, and November.
Sugar cane Pasture Corn
give the direction of the fastest increase of NDVI. The dominant variable in the rate change of NDVI is RED, ex-cept when RED presents high values (RED>0.15). There-fore, the NDVI increases or decreases faster when RED values are small, generally independently of NIR values.
The NDVI behavior shown in Figure 6 explains why January and March NDVI values were greater than those values of August and November (Figure 5). This occurred mainly because of the lower RED values ob-served for these months (Figure 3), resulting in greater NDVI values. It also explains the generally greater eu-calypt NDVI values compared with other land cover types’ NDVI values, as is clearly observed for August eucalypt NDVI values. Generally, eucalypt RED values were lower than other land covers’ RED (Figure 3), re-sulting in greater NDVI values for eucalypt when com-pared to the NDVI values of the other land covers.
NDVI saturation was not observed for LAI val-ues measured in this work. This result is consistent with other works. Gong et al. (1995), Spanner et al. (1990), and Turner et al. (1999) observed that saturation would occur for LAI values approximately greater than 5.00.
LAI mapping and analyses
Generation of LAI maps by the relationships be-tween LAI and SVIs have been done with some success. Recently, Chen et al. (2002) used relationships between LAI of distinct land cover types and the SVI Simple Ra-tio (NIR/RED) from NOAA/AVHRR data to generate a
Canada-wide LAI map. In this work, the models used to generate LAI maps, for the respective months, were evaluated according to the methodology presented by Gong et al. (1995). The predicted group consisted of 22, 21, 20, and 24 samples for January, March, August, and November, respectively, while the test groups were rep-resented by other 10 samples for each date.
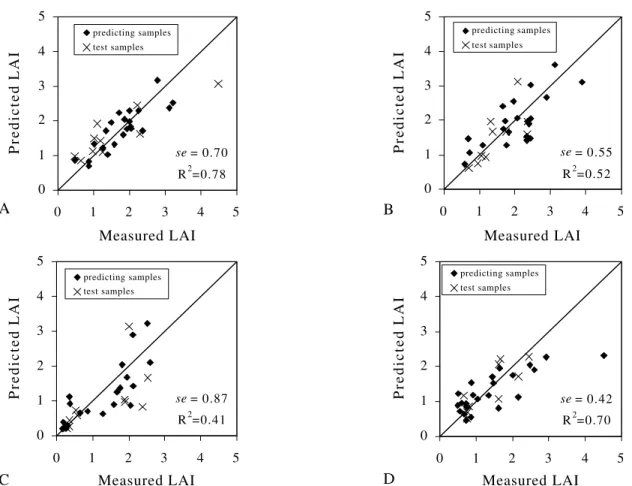
The NDVI explained 54% to 74% (November and January, respectively) of the variance in LAI by
means of the potential models (Table 4). The se of LAI
in the test groups ranged from 0.42 to 0.87 (August and November, respectively) showing reasonable precision in
the LAI estimate (Figure 7). For August, the highest se
test group value was related to eucalypt data, which pre-sented greater NDVI value, biasing the model. In future studies, data stratification could improve the result. Data stratification was not used in this work since the euca-lypt area was small in the watershed, and a greater num-ber of eucalypt data would be needed to generate an ex-clusive model for eucalypt.
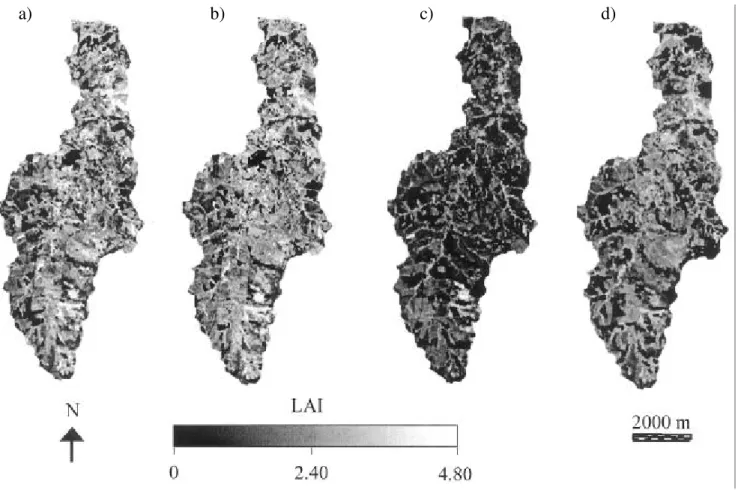
Models in Table 4 were applied to their respective NDVI images to generated LAI maps (Figure 8). Light tones in Figure 8 correspond to areas of eucalypt and ri-parian forests; medium gray tones generally correspond to sugar cane or pasture areas; the dark tones are equivalent to bare soils or areas with minimal green vegetation.
Table 5 provides the descriptive statistics of pre-dicted LAI in the watershed for each month. Variations of the mean LAI observed among the months were driven by precipitation, which increases LAI values. The mean LAI values for August were lower than those values for the other months, because sugar cane plantations, which covered most of the area, were in the initial stage of de-velopment; in the other months, sugar cane LAI were higher as a result of its advanced stage of development.
August presented the larger area with lower LAI values due to, as already observed, low precipitation in the previous months, and extensive area of sugar cane in the initial phases of development (Figure 9). August pre-sented approximately 88% of the area with LAI lower than 1.80, while for the remaining months, the area with LAI values below 1.80 was always smaller (up to 63%). In January and March the areas of LAI classes were simi-lar, also presenting equal means (LAI=1.59). This result might be associated with the high and similar precipita-tions and temperatures in these months, as well as, for
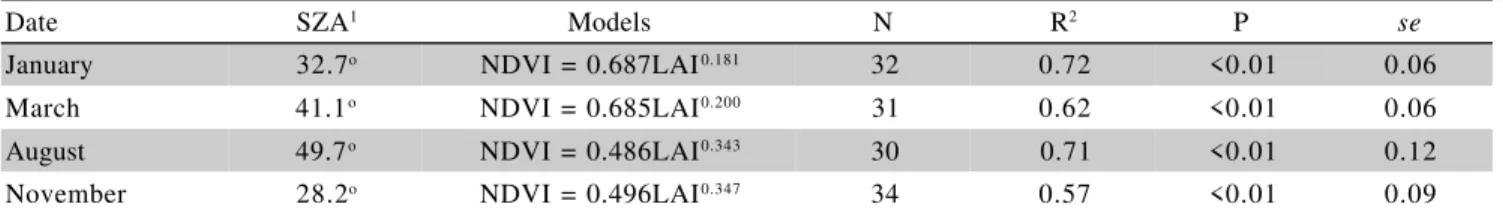
Table 4 - Models for Leaf Area Index (LAI) estimation.
1Solar Zenith Angle
Month SZA1 Models N R2 P se
January 32.7o LAI = 4.546NDVI3.496 22 0.74 <0.01 0.38
March 41.1o LAI = 4.486NDVI3.616 21 0.59 <0.01 0.57
August 49.7o LAI = 4.190NDVI2.138 20 0.72 <0.01 0.57
November 28.2o LAI = 3.682NDVI1.781 24 0.54 <0.01 0.67
Figure 6 - Gradient vector field of NDVI, that is, i j
nIR NDVI red NDVI NDVI
∂ ∂ + ∂ ∂ =
Figure 7 - Measured Leaf Area Indices compared to predicted Leaf Area Indices using potential models (Table 4) for January (a); March (b); August (c); and November (d).
se= 0.70 R2=0.78 0
1 2 3 4 5
0 1 2 3 4 5
Measured LAI
Predicted LAI
predicting samples test samples
A
se= 0.87
R2=0.41 0
1 2 3 4 5
0 1 2 3 4 5
Measured LAI
Predicted LAI
predicting samples test samples
C
se= 0.55 R2=0.52 0
1 2 3 4 5
0 1 2 3 4 5
Measured LAI
Predicted LAI
predicting samples test samples
B
se= 0.42 R2=0.70 0
1 2 3 4 5
0 1 2 3 4 5
Measured LAI
Predicted LAI
predicting samples test samples
D
January March August November
Figure 8 a 8 b 8 c 8 d
Mean 1.59 1.59 0.97 1.28
Median 1.65 1.65 0.85 1.30
Standard deviation 0.89 0.83 0.70 0.66
Maximum value 4.20 4.20 4.60 3.00
Table 5 - Descriptive statistics of predicted Leaf Area Indices in the watershed, obtained by Leaf Area Index-Normalized Difference Vegetation Index relationship.
both months, the sugar cane area presented similar LAI values due to advanced development of this crop (Xavier & Vettorazzi, 2003).
LAI estimated in the watershed by LAI-NDVI models presented some areas with either higher or lower LAI values than those measured in the field campaign. For March and August, the maximum predicted LAI were 4.20 and 4.60, respectively, while maximum measured LAI were 3.90 and 2.59. However, the area with greater predicted LAI values than those measured in the field campaign was small (<3% of the total area). Those areas with greater LAI values corresponded to riparian forest. On the other hand, maximum predicted LAI values for January and November were lower than those measured in the field, probably because of few high LAI values measured in the field were used in the coefficient
esti-mation to establish the prediction equations. It could cause bias on the respective prediction models. Areas with pre-dicted LAI values lower than those measured in field cam-paign were higher, respectively 14%, 15%, 10%, and 13% of the total area for January, March, August, and Novem-ber. Those areas often corresponded to bare soil, sugar cane and pasture with low phytomass. In future studies, those areas should be evaluated, as well as a larger num-ber of data with high and low LAI values should be mea-sured to lessen models bias.
Monthly LAI estimation
pas-ture, both with high seasonal dynamics. The generation of monthly LAI maps becomes a hard task without im-ages showing the respective land covers for the consid-ered period. Measurements of LAI in the field are also necessary to fit a regression, since NDVI values for
simi-Figure 8 - Leaf Area Index maps for the studied area, generated by relationships between Leaf Area Index (LAI) and Normalized Difference Vegetation Index (NDVI) for: January (a); March (b); August (c); and November (d).
Figure 9 - Histogram of the area occupied (%) per Leaf Area Index values in the studied watershed for January, March, August, and November.
0.0
1 . 5
3.0
4.5
Jan. M a r . A u g. N o v .
0 5 1 0 1 5 2 0
Area (%)
LAI
M o n th
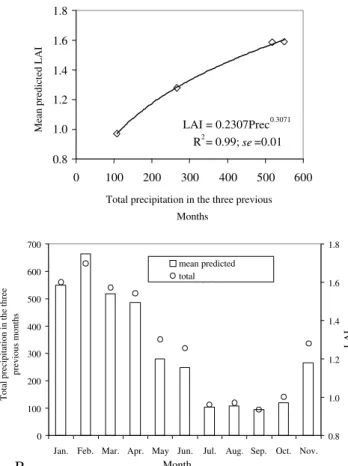
lar LAI from different dates are also influenced by back-ground brightness and SZA. As observed in the preced-ing section, the mean LAI value estimated in the water-shed by the relationship LAI-NDVI seems to be related to precipitation. Other studies have shown that vegeta-tion increases with increasing precipitavegeta-tion (Running et al., 1989). Schmidt & Karnieli (2002) observed, for an-nual vegetation, that NDVI, based in spectral ground mea-surements, was highly correlated (0.93) with cumulative precipitation of the previous three months.
Figure 10a shows the relationship between mean predicted LAI in the watershed for each of the four dates and total precipitation in the three previous months
(R2
=0.99; se=0.01; P < 0.01). The relationships between
mean predicted LAI and precipitation of one and two
previous months were not significant (P > 0.05).
Fig-ure 10b shows the monthly LAI estimate, using the model of mean predicted LAI by the total precipitation
in the three previous months (LAI=0.2307Prec0.3071
). The mean monthly LAI estimated by this relationship in 2001 was 1.28, with maximum and minimum LAI val-ues of 1.70 and 0.94, for January and September, respec-tively. This is a rough estimate only since LAI-NDVI models are not 100% accurate. Moreover, it neglects the LAI dynamics of the crops and the other land covers in
the watershed, as for example the period of sugar cane planting and the pasture dynamics due to animal graz-ing. However, it seems to be a reasonable reference for the monthly LAI value in the area.
CONCLUSIONS
The NDVI, RED, and NIR responses are shown to be influenced, not only by LAI, but also by background brightness and SZA, under which each image was ac-quired. Eucalypt showed lower RED and NIR values, probably because of its canopy structure, with more shad-ows than the other land covers. As the variations in the NDVI are more sensitive to RED variations, NDVI val-ues for eucalypt plantations often were greater than those for other land-cover types. For the range of land-cover types in this study, NDVI could be used to estimate LAI with a reasonable precision (standard error of predicted LAI estimated by means of empirical relationship with
NDVI ranged from 0.42 to 0.87 m2m-2). LAI variations
were influenced by the total precipitation in the previous three months. The generation of LAI maps also makes possible the development of models to estimate regional evapotranspiration and crops yield.
ACKNOWLEDGEMENTS
To the State of São Paulo Research Foundation (FAPESP) for the financial support to this study (process 2000/09325-0) and for the fellowship for the first author (process 98/14499-5). Authors also thank Prof. Mauro A. H. Antunes, from Rio de Janeiro Federal Rural Univer-sity, Brazil, for helping in the atmospheric correction with the 6S model.
REFERENCES
ASRAR, G.; FUCHS, M.; KANEMASU, E.T.; HATFELD, J.L. Estimating absorbed photosynthetic radiation and leaf area index from spectral reflectance in wheat. Agronomy Journal, v.76, p.300-306, 1984. ASRAR, G.; KANEMASU, E.T.; YOSHIDA, M. Estimates of leaf area
index from spectral reflectance of wheat under different cultural practices and solar angle. Remote Sensing of Environment, v.17, p.1-11, 1985. CHEN, J.M.; CIHLAR, J. Retrieving leaf area index of boreal conifer forests using Landsat-TM images. Remote Sensing of Environment, v.55, p.153-162, 1996.
CHEN, J.M.; PAVLIC, G.; BROWN, L.; CIHLAR, J.; LEBLANE, S.G.; WHITE, H.P.; HALL, R.J.; PEDDLE, D.R.; KING, D.J.; TROFYMOW, J.A.; SWIFT, E.; VAN DER SANDER, J.; PELLIKKA, P.K.E. Derivation and validation of Canada-wide coarse-resolution leaf area index using high-resolution satellite imagery and ground measurements.
Remote Sensing of Environment, v.80, p.165-184, 2002.
DEERING, D.W.; ECK, T.F.; BANERJEE, B. Characterization of the reflectance anisotropy of boreal forest canopy in spring-summer. Remote Sensing of Environment, v.67, p.205-229, 1999.
DEPARTAMENTO DE ÁGUAS E ENERGIA ELÉTRICA – DAEE. http:/ /www.daee.sp.gov.br/servicos/tabbmt.htm. (10 jan. 2002).
EPIPHANIO, J.C.N.; HUETE, A.R. Dependence of NDVI and SAVI on sun/sensor geometry and its effect on fapar relationships in alfalfa.
Remote Sensing of Environment, v.51, p.351-360, 1995.
FASSNACHT, K.S.; GOWER, S.T.; MACKENZIE, M.D.; NORDHEIN, E.V.; LILLESAND, T.M. Estimating the leaf area index of north central Wisconsin forests using the Landsat Thematic Mapper. Remote Sensing of Environment, v.61, p.229-245, 1997.
GATES, D.M.; KEEGAN, J.H.; SCHLETER, J.C.; WEIDNER, V.R. Spectral properties of plants. Applied Optics, v.4, p.11–20, 1965. GOETZ, S.J. Multi-sensor analysis of NDVI, surface temperature and
biophysical variables at a mixed grassland site. International Journal of Remote Sensing, v.18, p.71-94, 1997.
GONG, P.; PU, R.; MILLER, J.R. Coniferous forest leaf area index estimation along the Oregon transect using compact airborne spectrographic imager data. Photogrammetric Engineering & Remote Sensing, v.61, p.1107-1117, 1995.
GREEN, E.P.; MUMBY, P.J.; EDWARDS, A.J.; CLARK, C.D.; ELLIS, A.C. Estimating leaf area index of mangroves from satellite data.
Aquatic Botany, v.58, p.11-19, 1997.
HOLBEN, B.N.; TUCKER, C.J.; FAN, C.J. Spectral assessment of soybean leaf area and leaf biomass. Photogrammetric Engineering & Remote Sensing,v.46, p.651-656, 1980.
HUETE, A.R. A soil-adjusted vegetation index (SAVI). Remote Sensing of Environment, v.25, p.295-309, 1988.
JACKSON, R.B.; CARPENTER, S.R.; DAHM, C.N.; McKNIGHT, D.M.; NAIMAN, R.J.; POSTEL, S.L.; RUNNING, S.W. Water in a changing world. Ecological Applications, v.11, p.1027-1045, 2001.
JACKSON, R.D.; PINTER, P.J.; IDSO, S.B.; REGINATO, R.J. Wheat spectral reflectance: interactions between crop configuration, sun elevation, and azimuth angle. Applied Optics, v.18, p.3730-3732, 1979. JORDAN, C.F. Derivation of leaf-area index from quality of light on the
forest floor. Ecology,v.50, p.663–666, 1969.
LI-COR. LAI-2000 plant canopy analyzer: Instruction manual. Nebraska: Li-Cor Inc., 1992.
MIDDLETON, E.M. Solar zenith angle effects on vegetation indices in tallgrass prairie. Remote Sensing of Environment, v.38, p.45-62, 1991.
Figure 10 - Relationship between mean Leaf Area Index in the watershed (estimated by Leaf Area Index-Normalized Difference Vegetation Index relationship) and three months of accumulated precipitation (a), and monthly Leaf Area Index estimation (b).
0 100 200 300 400 500 600 700
Jan. Feb. Mar. Apr. May Jun. Jul. Aug. Sep. Oct. Nov.
Total precipitation in the three
previous months
0.8 1.0 1.2 1.4 1.6 1.8
Month
LAI
mean predicted LAI total precipitation
B
LAI = 0.2307Prec0.3071 R2= 0.99;se=0.01 0.8
1.0 1.2 1.4 1.6 1.8
0 100 200 300 400 500 600
Total precipitation in the three previous Months
MYNENI, B.; NEMANI, R.R.; RUNNING, S. Estimation of global leaf area index and absorbed PAR using radiative transfer models. IEEE Transactions on Geoscience and Remote Sensing, v.35, p.1380-1393, 1997.
OLIVEIRA, J.B. Solos da folha de Piracicaba. Campinas: Instituto Agronômico, 1999. 173p. (Boletim Científico, 48).
PETERSON, D.L.; SPANNER, M.A.; RUNNING, S.W.; TEUBER, K.B. Relationship of Thematic Mapper simulator data to leaf area index of temperate coniferous forests. Remote Sensing of Environment, v.22, p.323-341, 1987.
PUREVDORJ, Ts.; TATEISHI, R.; ISHIYAMA, T.; HONDA, Y. Relationships between percent vegetation cover and vegetation indices.
International Journal of Remote Sensing, v.19, p.3519-3535, 1998.
ROSENBERG, N.J.; BLAD, B.L.; VERMA, S.B. Microclimate: The biological environment. New York: John Wiley & Sons, 1983. 459p. RUNNING, S.W.; NEMANI, R.R.; PETERSON, D.L.; BAND, L.E.;
POTTS, D.F.; PIERCE, L.L.; SPANNER, M.A. Mapping regional forest evapotranspiration and photosynthesis by coupling satellite data with ecosystem simulation. Ecology, v.70, p.1090-1101, 1989.
SCHMIDT, H.; KARNIELI, A. Analysis of the temporal and spatial vegetation patterns in a semi-arid environment observed by NOAA-AVHRR imagery and spectral ground measurements. International Journal of Remote Sensing, v.23, p.3971-3990, 2002.
SELLERS, P.J.; DICKINSON, R.E.; RANDALL, D.A.; BETTS, A.K.; HALL, F.G.; BERRY, J.A.; COLLATZ, G.J.; DENNING, A.S.; MOONEY, H.A.; NOBRE, C.A.; SATO, N.; FIELD, C.B.; HENDERSON-SELLERS, A. Modeling the exchanges of energy, water, and carbon between continents and the atmosphere. Science, v.275, p.502-509, 1997.
SENTELHAS, P.C.; MARIN, F.R.; PEREIRA, A.R.; ANGELOCCI, L.R.; VILLA NOVA, N.A.; BARBIERI, V. Análise dos dados climáticos e do balanço hídrico climatológico de Piracicaba. Piracicaba: DFM,
ESALQ, USP, 1998. 81p. Received August 28, 2003Accepted March 15, 2004
SPANNER, M.A.; PIERCE, L.L.; PETERSON, D.L.; RUNNING, S.W. Remote sensing of temperate coniferous forest leaf area index: the influence of canopy closure, understory vegetation, and background reflectance. Remote Sensing of Environment, v.33, p.97-112, 1990. TUCKER, C.J. Red and photographic infrared linear combinations for
monitoring vegetation. Remote Sensing of Environment, v.8, p.127-150, 1979.
TURNER, D.P.; COHEN, W.B.; KENNEDY, R.E.; FASSNACHT, K.S.; BRIGGS, J.M. Relationships between leaf area index and Landsat TM Spectral Vegetation Indices across three temperate zone sites. Remote Sensing of Environment, v.70, p.52-68, 1999.
VERMOTE, E.F.; TANRÉ, D.; DEUZÉ, J.L.; HERMAN, M.; MORCRETTE, J.J. Second simulation of the satellite signal in the solar spectrum, 6S: An overview. IEEE Transactions on Geoscience and Remote Sensing, v.35, p.675-686, 1997.
VÖRÖSMARTY, C.J.; GREEN, P.; SALISBURY, J.; LAMMERS, R.B. Global water resources: vulnerability from climate change and population growth. Science, v.289, p.284-288, 2000.
WALTER-SHEA, E.A.; PRIVETTE, J.; CORNELL, D.; MESARCH, M.A.; HAYS, C.J. Relations between directional spectral vegetation indices and leaf area and absorbed radiation in alfalfa. Remote Sensing of Environment, v.61, p.162-177, 1997.
XAVIER, A.C.; VETTORAZZI, C.A. Mapping leaf area index through spectral vegetation indices in a subtropical watershed. International Journal of Remote Sensing, v.25, p. 1661-1672, 2004.