Received December 3, 2007 and accepted September 24, 2009. Corresponding author: adrianorosadojr@gmail.com
www.sbz.org.br
Implementation of a performance indicators system in a beef cattle
company
Adriano Garcia Rosado Júnior1, José Fernando Piva Lobato2 1Programa de Pós-graduação em Zootecnia/UFRGS.
2Faculdade de Agronomia/Departamento de Zootecnia/UFRGS.
ABSTRACT - It was aimed to propose a methodology for implementing a performance indicator system in a beef cattle company. Strategic goals and prioritization of process previously performed in the company was used as a support to the implementation. Possible indicators were listed and confronted with occasional restraints to its implementation and further analyzed by the Balanced Score Card (BSC) point of view. Subsequently, indicators were individually analyzed and their relationship with the company’s strategic goals was determined. Seventeen indicators were selected, two under financial perspective, nine under process perspective, four under customer perspective, and two under development and learning perspective. The relationship analysis showed that the indicators support appropriate monitoring of the critical processes to achieve the strategic goals, thereby consolidating the management system.
Key Words: environment analysis, management system
Implantação de um sistema de indicadores de desempenho em empresa
de pecuária de corte
Introduction
The survival of beef cattle companies in the current competitive environment is increasingly challenging. Nowadays, these companies seek to continuously improve their results, and performance measurement is the best tool to support this action, driving the company to success if these measurements are taken. Also, their focus have changed in the last few years evolving from a mere accounting-financial control to the monitoring of non-financial items. These items are critical for the business if we consider that decisions should be made during the process, and not only at the end of it, when results – good or poor – have been already established.
Martins (1999) states that many companies, trying to survive, privilege changes in production technology rather
than in the management system, which usually evolve at different paces. In the best scenario, this results in sub-optimization of investments made in production.
Bond (2002) believes that performance measurement is key in management, because performance is partially a result of the taken decisions, in whichquality is affected both by the quantity and the quality of the information generated by indicators.
According to Müller (2003), performance indicators depend on the strategy as a starting point and require processes as a substrate for establishing the indicators. That author emphasizes this interdependence: if there is no strategy, how can processes be prioritized or indicators defined? If there are no indicators, how can the strategic plan be followed and process improvements be maintained? And, if there are no processes, how can organizational
RESUMO - Objetivou-se neste trabalho propor uma metodologia para implantação de um sistema de indicadores de desempenho para empresas de pecuária de corte. Foram utilizados como suporte à implementação os objetivos estratégicos e a priorização de processos previamente realizados na empresa. Os possíveis indicadores foram listados e confrontados com as eventuais restrições à implantação e posteriormente analisados pela óptica do Balanced Score Card (BSC). Na sequência, procedeu-se à análise individual dos indicadores escolhidos e de seu relacionamento com os objetivos estratégicos da empresa. Foram selecionados 17 indicadores, dois financeiros, nove de processos, quatro dos clientes e dois de aprendizado e crescimento. Evidenciou-se, pela análise de relacionamento, que os indicadores permitem adequado monitoramento dos processos críticos para atingir os objetivos estratégicos consolidando o sistema de gestão.
efficiency effectively be achieved as each strategic goal can hardly be met by a function? This proposed model is called MEIO – Strategy, Indicators, and Operation Model, after the acronym Modelo de Estratégia, Indicadores e Operações in Portuguese.
This study aimed at applying a methodology for indicator in a beef cattle company as a complement of a previous determination of strategic objectives and critical processes to aid the management system of this kind of company in the search for higher market competitiveness.
Material and Methods
A study of case was carried out in April, 2007, on Estância Guatambu, located in Dom Pedrito, RS, Brazil, at BR 293 highway, km 263. Guatambu is a family-owned company that works with intensive beef cattle and crop production, employing cutting-edge technology in both businesses. It has an area of 10.000 ha (around 25,000 acres), distributed in five production units. Polled Hereford and Braford cattle are produced under a complete production cycle system, including breeding, calf rearing, finishing, and production of sires.
The company had previously determined its strategic goals and the critical processes required to achieve them. The applied methodology and the results of this process are described in Rosado Jr. & Lobato (2009). The authors used as tools to facilitate and to guide the process, the analysis of “Five Competitive Forces” by Porter (1989) to analyze the external environment, and the SWOT matrix (Bicho & Batista, 2006) simultaneously for external and internal analyses. Processes were prioritized relative to the proposed strategic goals by comparing the main company processes with their estimated impact on each of the proposed goals.
Based on the findings by Rosado Jr. & Lobato (2009), and working with the company management team, possible indicators, capable of monitoring the processes previously defined as critical, were listed. The following relevant characteristics of an indicator, as mentioned by GIL (1992), were considered:
a) To reproduce the vision of the customer, allowing quality checking as perceived by the consumer. These indicators must show how the product is being used at its final destination, and how it fits in the value chain of the customer;
b) To indicate the level of input utilization, making it possible to determine the occupation of the productive capacity of organization and the definition of the best product mix, that is, how much and when to produce some
products to make the best use of production inputs. These indicators are calculated as the ratio between production capacity and its level of use;
c) To be sensitive to process changes in order to indicate if products are being manufactured within the planned specifications or if the production process was improved, requiring the tolerance range to be narrowed; d) To be objective and easily measurable. An indicator is objective when it shows to those following its deviation losses or gain, quality or defect levels;
e) To provide timely answers. This means the capacity of an indicator to provide answers before the process which it measures generates losses to the organization; f) To be close to where the problem may occur, that is, to be readily available to those that need to take decisions on the process.
During the next step, restrictions and requirements for the establishment of indicators were listed to be weighted in a critical analysis that would appoint the most adequate indicators. Restrictions are the main difficulties and hindrances for the adoption of an indicator under evaluation that need to be weighted against their possible contribution for the achievement of the strategic goals of the organization (Kiyan, 2001).
The approved indicators were grouped according to the BSC - balanced score card (Kaplan & Norton, 1993). This model tries to balance indicators in order to make them a whole, showing the different sides of the business that need to be managed by combining financial and non-financial measurements. It recommends indicators according to the following perspectives: financial, customer, internal processes, and learning and development. The financial perspective represents the long-term goals of the company, i.e., to generate higher returns regarded to the invested capital. From the customer perspective, the company performance in the market segment that it intends to compete in is monitored. Regarded to the internal processes, measurements are chosen to leverage excellence in processes that are critical to put forward the established strategy. Under the perspective of learning and growth, the aim is to establish the necessary structure to support the objectives defined by the internal processes, such as employee training, information technology systems, etc.
as “audience”, that is, those interested in the results. Goals were determined taking into account the current level of process performance to make them realistic and achievable. The target challenge was determined by considering the possibilities of improvement in the short/ long term, encouraging the team to exceed the expected results. In addition, generation frequency, which defines the verification interval, and review frequency, which indicates maximal time limit to review the indicator parameter, were determined.
A complementary and extremely important action to validate the implementation work was the graphic representation of the analysis of relation among indicators, and their alignment with the organization goals to check the level of adhesion in order to ensure that the system is focused in showing that the critical requirements are being met.
Results and Discussion
Based on the analysis of the internal and external environment, the company defined strategic goals for macroprocesses and processes considered as critical (Rosado Jr. & Lobato, 2009). The goal of the macroprocess sire production was to increase traded volume, maintaining sales price. The goals of the macroprocess production of
finishers was to increase the participation of the company in higher-value niche markets by producing cattle that meet the requirements of these markets as to age, carcass weight, and finishing, as well as to increase productivity (kg beef/ha). The goals of the human resources process were to improve the skills of operational personnel, and to reduce lesions caused by repeated strain.
The crossing between processes and strategic goals revealed (Table 1), using subjective evaluation, the impact of the performance of each process on the established goals, which allowed priority to monitor processes.
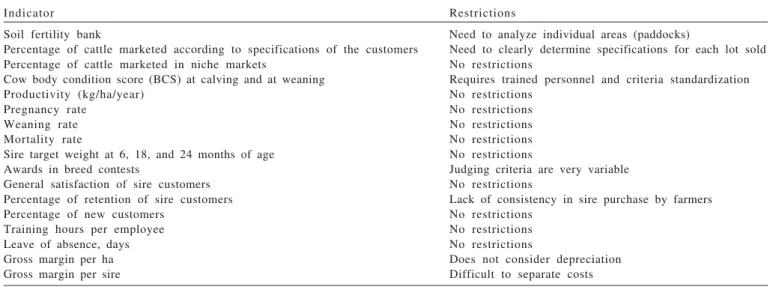
The indicators considered as essential by the management team were then confronted with the possible restrictions to their use (Table 2), particularly by taking into account the difficulty of obtaining data for the generation of the indicator, and its contribution for the management system. The indicator is “approved” when this relation is positive.
The analysis of possible restrictions showed that none of them made the adoption of the selected indicators unfeasible, as the required data are easy or moderately easily to obtain, with no need of major organizational and/ or structural changes in the company.
Indicator analysis according to balanced scored card determined that the principles of the methodology
Macroprocess
Production of sires Production of finishers Human resources
Strategic goals
Processes Increasing marketed Increasing the Increasing Increasing level Reducing volume maintaining participation productivity of skills repetition
sales prices in higher-value (kg/ha) of operational strain lesions niche markets personnel
Natural pasture supply high low high low
Cultivated pasture supply high high high low Supplementation interm. interm. interm. interm.
Feedlot low high high interm.
Manufacturing of concentrated feed low interm. interm. interm.
Silage production low interm. high interm.
Breeding interm. interm. high high
Gestation interm. interm. high high
Calving interm. interm. high high
Lactation interm. interm. high high
Weaning interm. interm. high high
Rearing high high high interm.
Selection high interm. interm. low
Sire preparation and sales high interm.
Finishing high high interm.
Marketing high high low
Health control high high high interm.
Field operations high high high high high
Production control high high high high
Table 1 - Impact of processes on the strategic goals of the organization
of Kaplan & Norton (1993) are complied, that is, that all perspectives proposed by the method are considered, generating a broad view of the organization, capable to support decisions and to leverage the process of continuous improvement (Table 3). Process indicators were predominant, suggesting a significant concern with ensuring results at the operational level of the company.
When the chosen indicators were individually analyzed, the operational details and the main parameters required to their implementation and system update were specified (Tables 4 to 12).
Soil fertility is considered as strategical by the management team because it is the main production factor and because its preservation/evolution is directly related to the sustainability of the production system over time. It
Indicator Restrictions
Soil fertility bank Need to analyze individual areas (paddocks)
Percentage of cattle marketed according to specifications of the customers Need to clearly determine specifications for each lot sold Percentage of cattle marketed in niche markets No restrictions
Cow body condition score (BCS) at calving and at weaning Requires trained personnel and criteria standardization Productivity (kg/ha/year) No restrictions
Pregnancy rate No restrictions
Weaning rate No restrictions
Mortality rate No restrictions
Sire target weight at 6, 18, and 24 months of age No restrictions
Awards in breed contests Judging criteria are very variable General satisfaction of sire customers No restrictions
Percentage of retention of sire customers Lack of consistency in sire purchase by farmers Percentage of new customers No restrictions
Training hours per employee No restrictions Leave of absence, days No restrictions
Gross margin per ha Does not consider depreciation Gross margin per sire Difficult to separate costs
Table 2 - Analysis of the restrictions of proposed indicators
Perspective Indicator
Financial Gross margin per ha Gross margin per sire Processes Soil fertility bank
Percentage of cattle marketed in niche markets
Productivity (kg/ha/year) Cow body condition score at calving and weaning Pregnancy rate Weaning rate
General herd mortality rate Sire target weight at 6, 18, and 24 months of age
Awards in breed contests Customer Percentage of cattle marketed
according to the customer’s specifications
General satisfaction of sire customers
Percentage of retention of sire customers
Percentage of new sire customers
Learning and development Training hours per employee Leave of absence, days
Table 3 - Distribution of indicators of Estância Guatambu
according to balanced scored card perspectives is based on the correction of soil nutrient deficiencies in
each farm subdivision, as well as the replacement of elements exported in the marketed products, thereby maintaining adequate substrate (no severe restrictions) for plant production.
Complying to specifications of the customer for the product “finishers” primarily requires the clear identification of the needs and requirements of each customer – which are usually considerably different – to guide workers in selecting animals to be marketed. Another important factor is the skill of these workers in identifying animals that comply to those requirements, as this is a visual task, with no aid of equipment such as ultrasound, which makes finishing determination easy and objective. Finishing, determined as subcutaneous fat depth (mm), is considered by the company one of the most important factors of satisfaction of the customers.
Title Productivity Cow body condition (kg/ha/year) at calving and
weaning Formula (kg sold finishers + Average of the
kg sold sires) / assessments number used ha
Measurement unit kilograms per Body condition hectare score – 1 to 5 Goal > 200 > 3.5 Challenge target 2 2 0 4
Person/people Veterinarian Veterinarian in charge
What does He/she shows the He/she indicates he/she do? productivity per breeding herd
utilized area nutritional status at strategic times of the cycle Benefits It monitors the It predicts
macroprocess reproductive “production performance, of finishers” allowing timely
nutritional corrections
Related process Production of Production of calves finishers;
production of sires
Information Annual Twice a year: at generation calving and at
frequency weaning
Review frequency Annual Annual
Table 5 - Analysis of the indicators “productivity (kg/ha/year)” and “cow body condition at calving and weaning”
Title Pregnancy rate Weaning rate Formula (sum of pregnant (sum of weaned
cows / sum of cows calves / sum of exposed to breeding) cows exposed to * 100 breeding) * 100 Measurement unit Percentage Percentage Goal > 90 > 80 Challenge target 9 5 8 5
Person/people Veterinarian Veterinarian in charge
What does he He/she shows the He/she shows the /she do? efficacy of natural efficiency of
breeding and the process artificial “production insemination of calves” processes
Benefits It correlates It encompasses nutritional and the performance health status of several with reproduction processes techniques
Related process Production of calves Production of calves Information Annual Annual
generation frequency
Review frequency Annual Annual
Table 6 - Analysis of the indicators “pregnancy rate” and “weaning rate”
Table 4 - Analysis of the indicators “soil fertility bank” and “percentage of animals marketed according to specifications of the customer”
Title Soil fertility bank Percentage of cattle marketed according to the customer’s specifications Formula (number paddocks (number approved
classified as animals / “intermediate” total number sold for P, K, animals) * 100 and OM, according
to ROLAS / total number paddocks) * 100
Measurement unit Percentage Percentage
Goal 6 0 % > 90%
Challenge target 8 0 % 9 5 % Person/people in Agronomist Veterinarian charge
What does He/she shows the He/she monitors he/she do?? evolution of the the macroprocess
assumed production of soil fertility finishers and the
precision of the selection of animals to be sold Benefits It monitors the It is directly
basic substrate for related to feed production satisfaction of the customer Related process Feed production Production of
finishers Information Biannual Monthly generation
frequency
Review frequency Biannual Annual
one of the best cost/benefit ratios in beef cattle production because it is easy to be used, and markedly contributes for the success of this activity. It is directly linked to the indicators “pregnancy rate” and “weaning rate.”
The indicator “Sire target weight at 6, 18, and 24 months of age” was chosen because it is highly correlated with the presentation of the sires at auctions being significantly valued by the customers of the company and it is considered by them as an indicator of the maximum genetic potential of the sires. The goals were determined because the current predominant biotype in the herd achieves good finishing at these body weights, despite of the small individual variations that are common in large herds due to genetic variability.
Title General herd Sire target weight mortality rate at 6, 18, and
24 months of age Formula (Sum of dead Average weight
animals / total at each class herd) * 100
Measurement unit Percentage Kilograms Goal < 2% 200, 400, 600 Challenge target < 1.5% 220, 450, 650 Person/people Veterinarian Veterinarian in charge
What does He/she shows He/she shows the he/she do? herd health growth rate and
status and the preparation of the stockmanship sires for sale quality
Benefits It monitors the It is highly correlated health program with the final
presentation of the product sire Related process Health Control Production of sires,
and Field production of calves Operations
Information Monthly Three measurements generation per harvest (6, 18, frequency and 24 months) Review frequency Annual Annual
Table 7 - Analysis of the indicators “general herd mortality rate” and “sire target weight at 6, 18, and 24 months of age”
Title Awards in Percentage of breed contests cattle marketed in
niche markets Formula (number of 1st and (number animals
2nd places complying
obtained / number with the criteria / animals total number of participating)* 100 animals sold)
* 100
Measurement unit Percentage of Percentage of sold awarded animals animals
Goal > 70% > 70% Challenge target 8 0 % 8 0 % Person/people Veterinarian Veterinarian in charge
What does He/she shows the He/she shows he/she do? performance of value added to
genetics and the product management
in the rings
Benefits It is correlated with It is correlated to brand marketing higher business profitability
Related process Production of sires Production of finishers Information Annual Annual generation
frequency
Review frequency Annual Annual
Table 8 - Analysis of the indicators “awards in breed contests” and “percentage of cattle marketed in niche markets”
Title General satisfaction Percentage of of sire customers retention of
sire customers Formula Results of a Number of
customer customers making satisfaction survey two consecutive
purchases / total n. of customers Measurement unit Percentage of Percentage of
satisfactory answers customers Goal > 90% > 50% Challenge target 9 5 % 6 0 % Person/people Veterinarian Board in charge
What does He/she shows the He/she shows he/she do? level of customer customer loyalty
satisfaction with level the field
performance and quality of the generated products
Benefits It indicates the It is correlated with alignment of the brand consolidation sire selection in the market program with the
requirements of the customers. It also assesses the health program.
Related process Production of sires, Production of sires Health program
Information Annual Annual generation
frequency
Review frequency Annual Annual
Table 9 - Analysis of the indicators “general satisfaction of sire customers” and “percentage of retention of sire customers”
The participation of the company products in niche markets is considered effective when some value is added to the products when sold in a specific customer niche. This indicator focuses on finisher cattle (meat production) due to company potential as its herd consists of British cattle (renowned for its high meat quality) and also due to its intensive production system, which allows marketing of finishers at a young age (1 to 2 years). Together, these factors contribute for the production of distinctive meat that can potentially be sold in high value-added markets.
usually because of the size of the herd, which influences the number of sire replacement.
The indicator “leave of absence” was devised because of the concern of the managers with health problems of the employee caused by repetitive strain due to mounting horses for field work. This causes the loss of talents because of their physical impossibility to perform tasks that are inherent to the business. Some actions, such as improving harnesses and the selection of horse lines with a lighter trot, are being studied.
Although it is not a precise indicator of profitability, “gross margin per hectare” was adopted because it is easy to be obtained and a significant volume of information on competitors can be provided by consulting companies that provide management services to the company.
The indicator “gross margin per sire” is an example of the application of process-oriented management accounting. Despite of using the method of Cost Centers to obtain economic indicators, the company implemented specific controls to try to identify more precisely the costs related to the production of sires.
The relationship analysis aims at verifying if the indicators are aligned with the strategic goals of the company, and if it is one of the premises of the balance score card (Figure 1). It shows that all goals are being supported by at least one performance indicator of the processes that are critical for their achievement, as well as that efforts and resources are not being wasted with non-essential monitoring. Title Gross margin per sire
Formula (Total revenues with sires – operational expenses of the sire account) / number of sires sold Measurement unit Brazilian real / sire
Goal R$ 600
Challenge target R$ 800 Person/people in charge Board
What does he/she do? He/she monitors process profitability
Benefits It supports the decision of developing or not the sire production business Related process Accounting/management;
Production of sires Information generation Annual
frequency
Review frequency Annual
Table 12 - Analysis of the indicator “gross margin per sire”
1 US$= R$ 2.15
Title Percentage of Training hours per new sire customers employee
Formula Number of first-purchase T o t a l training hours
customers / total n. / total n. of of customers employees Measurement unit Percentage Hours/
of customers employee/months Goal > 20% 2 h/h
Challenge target 2 5 % 4 h/h Person/people Board Veterinarian in charge
What does He/she shows He/she monitors the he/she do? brand expansion personnel training
trend program
Benefits It is correlated with It shows the effort brand consolidation of the company in in the market personnel training Related process Production of sires Human resources Information Annual Monthly generation
frequency
Review frequency Annual Annual
Table 10 - Analysis of the indicators “percentage of new sire customers” and “training hours per employee”
Title Leave of absence Gross margin per ha Formula Total days of (total revenues –
leave of absence / expenses) / n. of total n. of esoperational ha employe available
Measurement unit Days/employee Brazilian real / hectare Goal None – there is R$ 60
not measurement record
Challenge target None – there is R$ 80 not measurement
record
Person/people Human resources Board in charge manager
What does He/she identifies He/she monitors he/she do? the level of health the financial
problems suffered performance by employees of the business
Benefits It monitors It provides a broad occupational and single view of health problems the business
Related process Human resources Accounting/ management
Information Monthly Annual generation
frequency
Review frequency Annual Annual
Table 11 - Analysis of the indicators “leave of absence” and “gross margin per ha”
Figure 1 - Relationship between performance indicators and strategic goals.
The macroprocess “production of sires” shows high specialization since it requires a large number of indicators to monitor. The customer perspective indicators are highlighted, because this business involves a large number of purchasers, contrasting with the sales of finishers, which are usually concentrated on the hands of the oligopoly of beef packing industry.
Conclusions
Previous determinations of strategic goals of the company are crucial to guide the establishment of an
indicator system focused on achieving these goals. The use of the balanced scored method demonstrates that the indicators are comprehensive, and they include aspects beyond the traditionally prioritized ones, and often exclusive, financial items. Moreover, the individual analysis of the indicators provides the details required to implement and to operate them, defining feasibility, responsibilities, and targets. It must be noted that indicators only diagnose the current business situation; processes evolve only by effectively implemented correctives and improved actions derived from management decisions supported by performance indicators.
Pregnancy rate Cow body
condition Fertility bank Training
hours/employee
Leave of absence
Weaning rate
Mortality rate
Productivity (kg/ha)
% animals according to specifications
General satisfaction sire customers Sire target weight
Awards
% retention sire customers
% new sire customers % cattle to niche
markets
Gross margin/ha Gross margin/sire
"Reduction of problems with repetitive strain
lesions"
"Improving skills of operational personnel"
"Increase the participation of higher-value niche markets by producing cattle that comply the requirements of these markets as to age, carcass
weight, and finishing" "Increase productivity (kg/ha)"
References
BICHO, L.; BAPTISTA, S. Modelo de porter e Análise SWOT:
Estratégias de negócio. 2006.Instituto Superior de Engenharia de Coimbra.Departamento de Engenharia Civil. Disponível em: <http://prof.santana_e_silva.pt/gestaodeempreendimentos/ trabalhosalunos/word/modelo%20de20Porter%20%e%20An% C3%A1lise%20SWOTdoc.pdf>. Acesso em: 10/5/2007. BOND, E. Medição de desempenho para gestão da produção
em um cenário da cadeia de suprimentos. 2002. 125f. Dissertação (Mestrado em Engenharia de Produção) - Escola de Engenharia de São Carlos/Universidade de São Paulo, São Carlos. GIL, A.L. Qualidade total nas organizações.São Paulo: Atlas,
1992. 110p.
KAPLAN, R.S.; NORTON, D.P. Putting the balanced scorecard to work. Boston: Harvard Business Review, 1993. p.133-147. KYIAN, F.M. Proposta para desenvolvimento de indicadores de desempenho como suporte estratégico. 2001. 108f. Dissertação (Mestrado em Engenharia de Produção) - Escola de Engenharia de São Carlos/Universidade de São Paulo, São Carlos.
MARTINS, R.A. Sistemas de medição de desempenho – um modelo de estruturação de uso. 1999. 122f. Tese (Doutorado em Engenharia de Produção) - Escola Politécnica/Universidade de São Paulo, São Paulo.
MÜLLER, C.J. Modelo de gestão integrando planejamento estratégico, sistemas de avaliação de desempenho e gerenciamento de processos (meio – modelo de estratégia, indicadores e operações). 2003. 243f. Tese (Doutorado em Engenharia de Produção) - Escola de Engenharia/Universidade Federal do Rio Grande do Sul, Porto Alegre.
PORTER, M.E. Vantagem competitiva: criando e sustentando um desempenho superior. Rio de Janeiro: Campus, 1989. 364p. PÖTTER, B.A.A.; LOBATO, J.F.P. Efeitos de carga animal, pastagem melhorada e da idade de desmame no comportamento reprodutivo de vacas primíparas. Revista Brasileira de Zootecnia, v.33, n.1, p.192-202, 2004.