E-mail: ambi.agua@gmail.com
Rev. Ambient. Água vol. 10 n. 4 Taubaté – Oct. / Dec. 2015
Deoxygenation rate, reaeration and potential for self-purification of a
small tropical urban stream
doi:10.4136/ambi-agua.1599
Received: 02 Feb. 2015; Accepted: 01 Jul. 2015
Joao Paulo Cunha de Menezes*; Ricardo Parreira Bittencourt; Matheus De Sá Farias; Italoema Pinheiro Bello;
Luiz Fernando Coutinho de Oliveira; Ronaldo Fia
Universidade Federal Lavras (UFLA), Lavras, MG, Brasil Departamento de Engenharia
*Corresponding author: e-mail:jpaulo_bio@hotmail.com,
ricardoparreira.rp@gmail.com, matheus_desafs@hotmail.com, italoemapb@hotmail.com, coutinho@deg.ufla.br, ronaldofia@prg.ufla.br
ABSTRACT
Mathematical models used to simulate the water quality and the processes of self-purification of water bodies are important tools to support effective water resource management. The objective of this study was to evaluate the impact of organic pollution on water quality and the assimilative capacity of organic matter in the Ribeirão Vermelho stream situated in the city of Lavras in Minas Gerais. The deoxygenation rate (K1) and reaeration (K2) were determined and tested in three segments of the Ribeirão Vermelho over two seasons (summer and winter). The purification process simulation was performed using the Streeter-Phelps model. The highest K1 and K2 values occurred during the winter period which was characterized by lower flows. Simulation of the dissolved oxygen profile and biological oxygen demand fitted the model well, indicating the prevalence of carbonaceous deoxygenation due to nitrification and also demonstrating the importance of natural reaeration as part of the purification process. Different response was observed during the winter, in which the high primary productivity values stood in the reaeration process stream. Biological oxygen demand values did not meet the limits recommended by the Resolution of the Ministry of the Environment 357/2005 throughout the river system and the entire study period. In conclusion, the Ribeirão Vermelho is unable to self-purify along its entire length, and water quality is influenced by effluent discharge which intensifies degradation.
Keywords: effluent release, Streeter Phelps models, water quality.
Coeficiente de desoxigenação, reaeração e potencial de auto
purificação de um ribeirão urbano
RESUMO
Rev. Ambient. Água vol. 10 n. 4 Taubaté – Oct. / Dec. 2015
Para essa finalidade, foi desenvolvido e testados os coeficientes de desoxigenação (K1) e reaeração (K2), em três trechos e em dois períodos distintos (verão e inverno). Os maiores valores de K1 e K2 foram obtidos durante o inverno, onde foram registrados as menores vazões. A simulação do processo de autodepuração foi realizada com o uso do modelo de Streeter-Phelps. A simulação do perfil de OD e DBO no verão apresentou calibração aceitável, tendo em vista a otimização dos coeficientes, evidenciando a prevalência da desoxigenação por demanda carbonácea sobre a nitrificação e a importância da reaeração natural no processo de autodepuração. Comportamento diferente foi observado no inverno, no qual os altos valores de produtividades sobressaíram no processo de reaeração no ribeirão. Apenas o parâmetro demanda bioquímica de oxigênio não respeitou os limites preconizados pela Resolução do Ministério do Meio Ambiente 357/2005, tendo ficado em toda a extensão do rio e, em ambos períodos, fora da regulamentação. Desta forma, conclui-se que o Ribeirão Vermelho não consegue se auto depurar ao longo de sua extensão até a foz, tendo a qualidade de suas águas influenciadas por lançamentos de efluentes que intensifica o processo de degradação do rio.
Palavras-chave: lançamento de efluentes, modelo qualidade de água, Streeter Phelps.
1. INTRODUCTION
Rivers play an important role in the uptake and transport of industrial, municipal effluents and organic loading caused by runoff from agricultural fields, roads, and streets. Leaching and direct effluent discharge are primary sources of water pollution (Shrestha and Kazama, 2007). This problem is exacerbated when the purifying capacity of river systems is low in relation to the received contaminants.
Water self-purification is a complex process involving physical, chemical and biological processes that occur simultaneously, allowing a river can recover its natural state over a certain distance (Vagnetti et al., 2003; Demars and Manson, 2013). Depuration comprises different mechanisms such as dilution, sedimentation, reaeration, adsorption, absorption, and chemical and biological reactions, and can be evaluated by the same mathematical model (Bahadur et al., 2013, González et al., 2014). Water quality models are essential tools for the development of planning and management measures for water resources in river basins (Panagopoulos et al., 2012).
The precursor of more contemporary water quality models was proposed by Streeter and Phelps (1925), and was applied in a study on the Ohio River to increase the efficiency of actions to control pollution. The Streeter-Phelps model has resulted in the subsequent development of numerous numerical models used in computer applications, such as: QUAL-I, II and E (Fischer, 1995), QUAL-2K (Chapra et al., 2006), among others (Bahadur et al., 2013). These models, derived from classical Streeter-Phelps equations, have been widely used not only in to assess water quality, but also to predict damage resulting from the implementation of water resources management measures.
The Streeter-Phelps model describes “as oxygen demand decreases in a river or stream
along a certain distance by degradation of biochemical oxigen demand. Changes in the oxygen content of polluted waters over time can be studied by using the dissolved oxygen sag
curve” (Von-Sperling, 2014). “This differential equation states that the total change in oxygen
deficit is equal to the difference between the two rates of deoxygenation (K1) and reaeration (K2) at any time” (Streeter and Phelps; 1925, Von-Sperling, 2014).
Rev. Ambient. Água vol. 10 n. 4 Taubaté – Oct. / Dec. 2015
to their dependence on air-water interface turbulence making them complex and difficult to accurately measure. Several studies give methods to estimate K1 and K2 that provide reasonable approximations within predefined limits. However, due to the non-linearity nature of these coefficients, there is no formula for generic cases (Raymond et al., 2012; Cox, 2003; Haider et al., 2013 Benson et al., 2014).
Nowadays there is a strong interest in integrated approaches to the management of urban basins, since these systems are subject to a wide range of environmental problems. The primary objective of this study was to assess the impact of organic pollution on river water quality and the water self-purification capacity in the Ribeirão Vermelho Basin.
2. MATERIAL AND METHODS
Located in the Greater Region South of Minas Gerais, the river basin of the Ribeirão Vermelho, a tributary of the Rio Grande, includes the city of Lavras (Figure 1). Both the source and main tributaries of the Ribeirão Vermelho are situated in the urban area of the city of Lavras which has a population of approximately 90,000 inhabitants (IBGE, 2010). After flowing for approximately 15 km, the Ribeirão Vermelho flows into the Rio Grande, one of the main tributaries in the Paraná River Basin. Although most of the area of the Ribeirão Vermelho Basin has sewerage, some areas have septic tank systems and also illegal sewerage that discharges directly into the watercourse.
According to the Köppen classification, the climate where the city of Lavras is situated is classified as Cwb, which describes a rainy temperate (mesothermal) climate with a dry winter and a rainy summer. The region is subtropical with an annual temperature of approx. 19.3ºC (maximum of 21.3ºC 15.1ºC). The normal annual rainfall is approximately 1,530 mm (Alvares et al., 2013).
Figure 1. Location of the Ribeirão Vermelho River Basin, with detail of land use and the sampling points for the Streeter-Phelps model input parameters and effluent discharges.
Rev. Ambient. Água vol. 10 n. 4 Taubaté – Oct. / Dec. 2015
III, from 7.19 to 8.65 km (Figure 1). The criterion for defining and creating each section was based on the hydraulic characteristics of the river, the location of polluting sources and confluence to the stream.
Four field campaigns (April-October, 2014), in two periods (summer and winter) were carried out to determine the input variables of the self-purification model at 11 sampling stations with different degrees of anthropogenic impact and potential sources of pollution (Figure 1). Dissolved oxygen (DO) levels and biochemical oxygen demand (BOD) were measured at eight sampling stations and the remaining three sampling stations after each mixture of affluent). Water samples were collected at 3 points after mixing with the main river affluent (Figure 1) to determine the deoxygenation coefficient (K1). Sampling was carried out in manually by collecting near the water surface, due to the shallow water depth in the study area. Analyses were carried out in Water Analysis Laboratory of the Environmental Engineering and Sanitary Engineering at Department of the Federal University of Lavras.
Water temperature was measured in situ using a mercury thermometer, and the altitude of
each point was obtained using a handheld GPS (Global Positioning System). Both DO and BOD were determined using the iodometric method (APHA et al., 2005).The BOD was determined on 20 consecutive days in order to estimate the rate of deoxygenation and calculate K1 values as described by von Sperling (2014). After evaluating the BOD, a theoretical curve was constructed using the non-linear regression method to set multiple values of sampling time points and BOD. Therefore, estimated K1 values were obtained from the deoxygenation rate. The reaeration coefficient (K2) was obtained using the Microsoft Excel Solver® tool in replacing Equation 4, the input data (temperature, altitude location, the mixing point DO, BOD, speed, K1, and the distance DO concentration at the end of excerpt).
Water flow was estimated using the hydrometric method. Depth and average flow velocity was measured with the aid of a flow meter at cross sections situated at the upstream and downstream end of each designated stretch; flow was assessed using a continuity equation. The input data was used to model the dissolved oxygen using the classic version proposed by Streeter and Phelps (1925).
𝐶(𝑡) = 𝑆𝐶− [𝐾𝐾2.𝑘11.𝐿0. (𝑒
−𝐾1
𝑣 .𝑡 − 𝑒−𝐾2𝑣 .𝑡) + (𝑆𝐶− 𝐶0). 𝑒−𝐾2𝑣 .𝑡] (1)
where:
L0 = final BOD (mg L-1);
C0 = initial concentration of the river DO (mg L-1);
v = mean velocity of water flow (m s-1);
t = time (days);
K1 and K2 = coefficients of reaeration and deoxygenation, respectively (day-1);
C (t) = concentration of dissolved oxygen (DO) in time (mg L-1); SC = DO saturation concentration (mg L-1).
Water quality standards were drawn from CONAMA, Resolution No. 357/2005 (CONAMA, 2005) to assess compliance with environmental legislation for the Ribeirão Vermelho (class 2).
3. RESULTS AND DISCUSSION
Rev. Ambient. Água vol. 10 n. 4 Taubaté – Oct. / Dec. 2015
during the winter. DO levels increased along with the values of biological oxygen demand (BOD) (Figure 2).
Figure 2. Spatiotemporal variation of Dissolved Oxygen (DO) and Biological Oxygen Demand (BOD) along the Ribeirão Vermelho.
The higher winter DO levels reflect higher primary productivity levels and eutrophication of the river. Although Figure 2 shows a purification trend, BOD concentrations did not fall along the river, possibly due to agro-industrial waste discharge senescence of algae in the water column of the river. Other sources of organic matter also influenced the process due to the water quality of the Ribeirão Vermelho during the winter period (Figure 2). According to the River Continuum Theory, various processes and patterns of the river ecosystem are changing along the river as conditions change (Vannote et al., 1980; Bowes et al., 2003). Biogeochemical processes that occur throughout the river basin and hydrological pulses affect water quality along the river continuously (Magnuszewski et al., 2007;
Kiedrzyńska et al., 2008). Although sewerage infrastructures serve a large percentage of the
rural enterprises, some areas have septic tank systems and illegal piping connections discharging untreated sewage directly into the stream, changing the river purifications patterns.
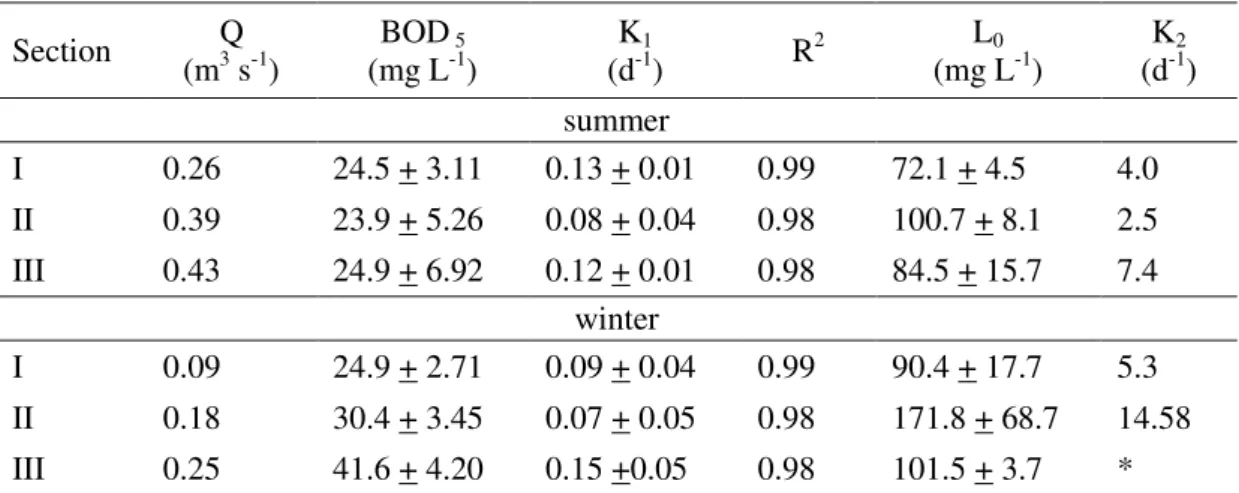
The deoxygenation rate constant (K1) was calculated from BOD data and adjusted in accordance with the corresponding curves using the method proposed by Thomas (1950), as well as temperature adjustment proposed by Tebbut (1998). The R2 coefficients were very close to unity, indicating a close association of estimated and observed data (Table 1). Sections I and III of the study area showed a higher K1 values in summer and winter period (Table 1).
Rev. Ambient. Água vol. 10 n. 4 Taubaté – Oct. / Dec. 2015
clean water or secondary effluent (Fair et al., 1973; Arceivala, 1981; Thomann and Mueler, 1987; Tebbut, 1988; Chapra, 1997; Almeida, 2006; Von-Sperling, 2007; Formentini, 2010; Santos et al., 2011; Von-Sperling, 2014).
Table 1. Mean and standard deviation values of the deoxygenation coefficient (K1) and
coefficient of reaeration (K2) at each sampling section, with its BOD5 and the last oxygen
demand (L0).
Section (mQ 3 s-1) (mg LBOD 5 -1) (dK-11 ) R2 (mg LL0 -1) (dK-12 )
summer
I 0.26 24.5 + 3.11 0.13 + 0.01 0.99 72.1 + 4.5 4.0 II 0.39 23.9 + 5.26 0.08 + 0.04 0.98 100.7 + 8.1 2.5 III 0.43 24.9 + 6.92 0.12 + 0.01 0.98 84.5 + 15.7 7.4
winter
I 0.09 24.9 + 2.71 0.09 + 0.04 0.99 90.4 + 17.7 5.3 II 0.18 30.4 + 3.45 0.07 + 0.05 0.98 171.8 + 68.7 14.58 III 0.25 41.6 + 4.20 0.15 +0.05 0.98 101.5 + 3.7 * *in Section III during the winter period, it was not possible to determine the methodology used by K
2
due to excess oxygen present in the liquid mass due to the high primary productivity of the river.
The last oxygen demand was higher in periods of low flow, when the concentration of pollutants was higher. Barros et al. (2011) evaluating the oxygen balance in the river Turvo Sujo in different seasons. In their study, the also observed this pattern, noting that the water samples had lower K1 values and a slower stabilization rate of organic matter, resulting in a high L0. In contrast, samples with higher values of deoxygenation degraded organic matter more rapidly.
According to von-Sperling (2014), the importance of the coefficient K1 and BOD a relativity concept may be considered when two different samples have the same value as BOD5, which apparently could lead to the conclusion that the impact in terms of dissolved oxygen uptake is the same in both situations. However, BOD values varied daily over the sampling periods in the Ribeirão Vermelho (Figure 3) with the exception of the fifth day. This is due to different deoxygenation rates in the two samples, emphasizing that the interpretation of BOD data must always be linked to the concept of deoxygenation ratio and therefore the oxidation rate of the organic matter (Von-Sperling, 2014).
Rev. Ambient. Água vol. 10 n. 4 Taubaté – Oct. / Dec. 2015
Estimated values of the reaeration coefficient for the three segments of the Ribeirão Vermelho, with different hydrodynamic conditions in both periods evaluated are shown in Table 1. K2 values are normally obtained using empirical models. However, this study used an inverse method using Equation 1 to obtain K2 values by inserting the input data and the oxygen concentration at a certain time in order to minimize the sum of squares of deviation.
The highest K2 values were recorded during the low flow winter period when the shallower depth was possibly an influential factor. According to Von-Sperling (2014) bodies of shallower water tend to have higher coefficient of reaeration, due to ease of mixing across the depth profile and greater surface turbulence. Haider et al. (2013) evaluated predictive
models of reaeration coefficients in a river in Pakistan and observed that K2 may vary significantly based on the hydrodynamic conditions of the river and the applied model.
The Ribeirão Vermelho purification capacity, considering the real contribution of its tributaries and seasonal patterns, was analyzed using the Streeter and Phelps Model (1925) and quantitative and qualitative data measured on site (Figure 2 and Table 1). The results show a good fit of the data to the model in both periods (Figure 4).
With the exception of the summer, the evolution of the DO concentration as a function of distance along the study site shows a tendency for the Ribeirão Vermelho to meet the proposed level for bodies of water in Class 2 condition, as determined by CONAMA Resolution No. 357/2005 (CONAMA, 2005). However, in the winter, the majority of sampling sites had high dissolved oxygen levels due to excess oxygen produced by the high productivity of algae present rather than the river’s capacity to assimilate organic matter.
Pollution from agropastoral activities resulted in BOD5,20°C exceeding the regulatory maximum value of 5.0 mg L-1. This trend is due to frequent interruptions in the river purification process as a result of direct discharge which makes the prediction of system recovery a difficult task.
Figure 4. Spatial variation of average concentrations of dissolved oxygen (DO) and biological oxygen demand (BOD) observed and modeled by the equation proposed by Streeter and Phelps (1925) in Ribeirão Vermelho.
4. CONCLUSION
Rev. Ambient. Água vol. 10 n. 4 Taubaté – Oct. / Dec. 2015
The estimation of K2 by means of the inverse solution equation, proposed by Streeter-Phelps, fits well to the data obtained in this study of the Ribeirao Vermelho sections.
The use of the Streeter-Phelps purification model was consistent with the experimental samples taken from stream. The observed concordance between the model and the experimental data is due to the fact that the point source and the kinetic coefficients of deoxygenation (K1) and reoxygenation (K2) were obtained in the field and used as calibration parameters.
Analysis of timeline concentrations of DO and BOD revealed a significant negative environmental impact in Ribeirão Vermelho, caused by the release of organic matter from agro-industrial effluents and municipal wastewater.
This study contributes towards a better understanding of pollution dynamics in the Ribeirão Vermelho and draws attention to potential environmental problems that may occur. Also it warns about the problems caused by effluent discharges into the Ribeirão Vermelho, since from this study it was possible to support reliable models and improve the management of water resources.
5. ACKNOWLEDGEMENTS
We thank colleagues from the Environmental and Sanitary Engineering Laboratory (UFLA) that contributed to this paper. We also thank FAPEMIG (Case No. CAG-APQ- 02060-13) and CAPES (Case No. 6421-14-8) and CITAB-UTAD for the support and housing the first author for seven months.
6. REFERENCES
ALMEIDA, T. V. D. Índice de qualidade da água e coeficientes de autodepuração de
trechos do rio Pomba. 2006. 68f. Dissertação (Mestrado em Engenharia Agrícola)
-Universidade Federal de Viçosa, Viçosa, 2006.
ALVARES, C. A.; STAPE, J. L.; SENTELHAS, P. C.; GONÇALVES, J. L. M.;
SPAROVEK, G. Köppen’s climate classification map for Brazil. Meteorologische Zeitschrift, v. 22, n. 6, p. 711-728, 2013.
http://dx.doi.org/10.1127/0941-2948/2013/0507
AMERICAN PUBLIC HEALTH ASSOCIATION – APHA; AMERICAN WATER WORKS ASSOCIATION – AWWA; WATER ENVIRONMENT FEDERATION – WEF. Standard methods for the examination of water and wastewater. 21th. ed. Washington, 2005.
ARCEIVALA, S. J. Wastewater treatment and disposal: engineering and ecology in pollution control. New York: Marcel Dekker, 1981. 892 p.
BAHADUR, R.; AMSTUTZ, D. E.; SAMUELS, W. B. Water contamination modeling: a review of the state of the science. Journal of Water Resource and Protection, v. 5, p. 142-155, 2013. http://dx.doi.org/10.4236/jwarp.2013.52016
BARROS, F. M. et al. Balanço de oxigênio no rio Turvo Tujo-MG em diferentes épocas do ano. Revista Engenharia Agrícola, v. 19, n. 1, p. 72-80, 2011.
Rev. Ambient. Água vol. 10 n. 4 Taubaté – Oct. / Dec. 2015
BOWES, M. J.; HOUSE, W. A.; HODGKINSON, R. A. Phosphorus dynamics along a river continuum. Science of the Total Environment, v. 313, p. 199–212, 2003. http://dx.doi.org/10.1016/S0048-9697(03)00260-2
CHAPRA, S. C. et al. A modeling framework for simulating river and stream water quality. QUAL-2K, version 2.04: documentation and user’s manual. Washington:
Environmental Protection Agency; Tufts University; Washington Dept. of Ecology, 2006.
CHAPRA, S. C. Surface water quality modeling. New York: McGraw-Hill, 1997. 844 p. CONSELHO NACIONAL DO MEIO AMBIENTE – CONAMA. Resolução nº 357, de 17 de
março de 2005. Dispõe sobre a classificação dos corpos de água e diretrizes ambientais para o seu enquadramento, bem como estabelece as condições e padrões de lançamento de efluentes, e dá outras providências. Diário Oficial [da] República Federativa do Brasil, Brasília, DF, 2005.
COX, B. A. A review of dissolved oxygen modelling techniques for lowland rivers. Science of Total Environment, v. 314, p. 303–334, 2003. http://dx.doi.org/10.1016/S0048-9697(03)00062-7
DEMARS, B. O. L.; MANSON, J. R. Temperature dependence of stream aeration coefficients and the effect of water turbulence: a critical review. Water Research, v. 47, p. 1–15, 2013. http://dx.doi.org/10.1016/j.watres.2012.09.054
FAIR, G. M.; GEYER, J. C.; OKUN, D. A. Purificación de aguas y tratamiento y remoción de aguas residuals (Water and wastewater engineering). México: Editorial Limusa, 1973. v. 2. 764 p.
FISCHER, E. G. Determinação de contaminação do ribeirão do Feijó através de levantamento de dados e modelo matemático de qualidade da água. São Carlos: Escola de Engenharia de São Carlos, 1995.
FORMENTINI, T. A. Coeficientes de desoxigenação e de reaeração superficial em trechos do rio Vacacaí Mirim. 2010. 91f. Disseratação (Mestrado em Engenharia Civil) - Universidade Federal de Santa Maria, Rio Grande do Sul, 2010.
GONZÁLEZ, S. O.; ALMEIDA, C. A.; CALDERÓN, M.; MALLEA, M. A.; GONZÁLEZ, P. Assessment of the water self-purification capacity on a river affected by organic pollution: application of chemometrics in spatial and temporal variations. Environmental Processess, v. 21, p. 10583-10593, 2014.
HAIDER, H.; ALI, W.; HAYDAR, S. Evaluation of various relationships of reaeration rate coefficient for modeling dissolved oxygen in a river with extreme flow variations in Pakistan. Hydrological Processes, v. 27, p. 3949–3963, 2013.
http://dx.doi.org/10.1002/hyp.9528
INSTITUTO BRASILEIRO DE GEOGRAFIA E ESTATÍSTICA. Censo demográfico 2010. Diário Oficial [da] União, Brasíliam nº 211, Seção 1, p.110, 2010.
KIEDRZYŃSKA, E.; KIEDRZYŃSKI, M.; ZALEWSKI, M. Flood sediment deposition and
Rev. Ambient. Água vol. 10 n. 4 Taubaté – Oct. / Dec. 2015
MAGNUSZEWSKI, A.; KIEDRZYŃSKA, E.; WAGNER-ŁOTKOWSKA, I.; ZALEWSKI,
M. Numerical modelling of material fluxes on the floodplain wetland of the Pilica River, Poland. In: OKRUSZKO, T.; SZATYLOWICZ, J.; MIROSLAW-SWIATEK, D.; KOTOWSKI, W.; MALTBY E. (Eds.). Wetlands: monitoring, modelling and management. Leiden: A. A. Balkema Publishers; Taylor and Francis Group, 2007. p. 205–210.
PANAGOPOULOS, Y.; MAKROPOULOS, C.; MIMIKOU, M. Decision support for diffuse pollution management. Environmental Modelling Software, v. 30, p. 57–70, 2012. http://dx.doi.org/10.1016/j.envsoft.2011.11.006
RAYMOND, P. A.; ZAPPA, C. J.; BUTMAN, D.; BOTT, T. L.; POTTER, J.; MULHOLLAND, P. et al.Scaling the gas transfer velocity and hydraulic geometry in streams and small rivers. Limnology and Oceanography. Fluids and Environments, v. 2, p. 41–53, 2012. http://dx.doi.org/10.1215/21573689-1597669
SANTOS, A. R.; EUGENIO, F. C.; SAITO, N. S.; PELUZIO, T. M. O.; SEDIYANA, G. C.
Caracterização química, física e bioquímica dos três principais cursos d’água da bacia
hidrográfica do rio Turvo Sujo-MG. Engenharia Ambiental - Espírito Santo do Pinhal, v. 8, n. 3, p. 071-084, 2011.
SHRESTHA, S.; KAZAMA, F. Assessment of surface water quality using multivariate statistical techniques: a case study of the Fuji river basin, Japan. Environmental Modelling & Software, v. 22, p. 464–475, 2007.
http://dx.doi.org/10.1016/j.envsoft.2006.02.001
STREETER, H. W.; PHELPS, E. B. A study of the natural purification of the Ohio River. Washington: U. S. Public Health Service, 1925. 75 p. (Public Health Bulletin, v. 146) TEBBUT, T. H. Y. Principles of water quality control. London: Butterworth – Heinemann,
1988. 289p.
THOMANN, R. V.; MÜELLER, J. A. Principles of surface water quality modeling and control. New York: Harper & Row, 1987. 644p.
THOMAS, H. A. Graphical determination of BOD rate constants. Water Sewage Works, v. 97, p. 123-124, 1950.
VAGNETTI, R.; MIANA, P.; FABRIS, M.; PAVONI, B. Self-purification ability of a resurgence stream. Chemosphere, v. 52, p. 1781–1795, 2003.
http://dx.doi.org/10.1016/S0045-6535(03)00445-4
VANNOTE, R. L.; MINSHALL, G. W.; CUMMINGS, K. W.; SEDELL, J. R.; CUSHING, C. E. The River continuum concept. Canadian Journal of Fisheries and Aquatic Sciences, v. 37, p. 130–137, 1980.
VON SPERLING, M. Estudos e modelagem da qualidade da água de rios. Belo Horizonte: Departamento de Engenharia Sanitária e Ambiental; Universidade Federal de Minas Gerais, 2007. v. 7. 588 p.