www.ambi-agua.net E-mail: ambi.agua@gmail.com
This is an Open Access article distributed under the terms of the Creative Commons Attribution License, which permits unrestricted use, distribution, and reproduction in any medium, provided the original work is properly cited.
Using the pollutant load concept to assess water quality in an urban
river: the case of Carahá River (Lages, Brazil)
ARTICLES doi:10.4136/ambi-agua.2252
Received: 09 Mar. 2018; Accepted: 18 Oct. 2018
Jessica Quinatto ;Natan Liz De Nale Zambelli ; Diego Hoefling Souza ;
Sílvio Luís Rafaeli Neto ; Josiane Teresinha Cardoso ;Everton Skoronski*
Universidade do Estado de Santa Catarina (UDESC), Lages, SC, Brasil Departamento de Engenharia Ambiental e Sanitária. E-mail: je.quinatto@gmail.com,
natanzambelli@hotmail.com, diego.hoefling@gmail.com, silvio.rafaeli@udesc.br, josiane.cardoso@udesc.br, skoronski@cav.udesc.br
*Corresponding author
ABSTRACT
The objective of this study was to evaluate the water quality of Carahá River in Lages (Brazil), using the concept of pollutant load and comparing the results with the water quality index. Thirteen points along the river were selected and eight collections were carried out over a period of 16 months. The parameters analysed were those required for the calculation of the water quality index (WQI). Flow measurements were also carried out, which enabled the calculation of the polluting load. The results showed that the WQI score ranges between 24.95 at the source and peaks at 40 at the outlet. The water classification, therefore, ranges from “very bad” to “bad”. The calculation of the pollutant load showed a constant disposal of contaminants into the river, which demonstrates that the quality of the water is continuously degraded. This information could not be obtained by analysing only the WQI, which presented a nearly constant quality at point 4 and beyond. The use of the calculation of pollutant load for Carahá River is, therefore, a tool for assessment of pollution that can provide more appropriate information for the water resources management.
Keywords: flow, pollutant load, urban river, water quality index.
Avaliação da qualidade da água de um rio urbano utilizando o
conceito de carga de poluentes: o caso do Rio Carahá (Lages, Brazil)
RESUMO
Rev. Ambient. Água vol. 14 n. 1, e2252 - Taubaté 2019
2 Jessica Quinatto et al.
não foi possível de ser obtida analisando-se somente o IQA, o qual apresentou uma qualidade praticamente constante a partir do ponto 4. Desta forma, para o rio Carahá, a utilização do cálculo da carga constitui-se em uma ferramenta de avaliação da poluição que pode trazer informações mais adequadas para a gestão de deste recurso hídrico.
Palavras-chave: carga poluidora, índice de qualidade da água, rio urbano, vazão.
1. INTRODUCTION
One of the most widely used tools for the assessment of water quality in rivers is the water quality index (WQI). This index was developed from a mathematical relationship that transforms the result of various analyses of physical, chemical and microbiological parameters into a single number. This simplifies the quality evaluation of the fresh waters (Maane-Messai et al., 2010). This index is widely accepted, as it plays an important role in the process of translation, as a tool used to communicate water quality (Bhatti and Latif, 2011). The use of the WQI in studies of water quality has been widely addressed over a long period. As an example of preliminary work, Egborge and Benka-Coker (1986) carried out their studies in the Warri River, Nigeria. More recent studies, such as the Hou et al. (2016) study of the Yellow River and Sun et al. (2016) of the Courtyard River, both in China, and Abdel-Satar et al. (2017) study of the Nile River in Egypt, highlight that WQI is still a useful tool for water quality assessment.
Although the use of the WQI has been widely accepted in investigations that involve the assessment of the water quality of rivers, one issue that needs to be raised is, to what extent will flow measurement affect the water quality evaluation? In this respect, an alternative way to evaluate the effects of pollution in rivers is the use of the concept of pollutants load. However, the concept of the load has traditionally been used for the design of effluent treatment systems and is not commonly used in studies on water quality in rivers. The volumetric organic load, for example, is a fundamental parameter for the design of biological reactors for treating sewage and industrial effluents (Metcalf and Eddy, 2013). For the monitoring of water resources, the use of more widespread pollutant load is related to the calculation of the mass of suspended solids transported by water. This measure is an important indicator of soil loss and also the basis for the design and control of dams (Richards, 1998). According to this author, the knowledge of a load of suspended solids has a greater significance when compared to the concentration of these species.
Many researchers have addressed this issue in a similar manner. The following studies are some examples of investigations that were carried out: Ntengwe (2006) studied the Kitwe Stream in Zambia. The author investigated the levels of pollution, physical chemistry, biochemistry and the load of BOD5, phosphorus, nitrate, sulphate and suspended solids. Zhang
et al. (2012) studied the pollution of Lake Taihu in China. Parameters such as chemical oxygen demand (COD), ammonia, total nitrogen and total phosphorus were evaluated in terms of the pollutant load. Wang et al. (2013) used the concept of load to evaluate the runoff of pollutants due to various land uses and occupation in Chongqing in China. The application of the concept of the load was used to check which activity has more intensely influenced the pollution of waters in that locality. Recently, Brodie et al. (2017) studied strategies to prioritize investments in pollution control on the Great Barrier Reef in Australia. The authors used the concept of load to evaluate which watersheds had the greatest influence on the pollution of reefs and used it to improve the effectiveness of programs for environmental protection. Finally, Li et al. (2019) applied the pollutant load concept to study benzene series in an urban environment.
Rev. Ambient. Água vol. 14 n. 1, e2252 - Taubaté 2019
River in the municipality of Lages (Brazil) has not been studied, despite the investigations carried out by Antunes et al. (2014). A gap therefore exists in the literature which must be filled by additional research on the Carahá River, so as to obtain useful data for public policy and environmental management. In this context, the objective of this study was to compare the water quality index to the concept of the load in a specific river and evaluate which methodology provides more substantial information.
2. MATERIALS AND METHODS
2.1. Sample collection location
The study was conducted along the Carahá River, in the municipality of Lages, located in the south of Brazil. The watershed of the Carahá River is at an average altitude of 988.32 m. It has a surface area of 30.17 km², about 58% of which is an urban area. In the basin, there are approximately forty thousand buildings, with an estimated population of 120,000 inhabitants. The watershed is roughly circular in shape, although its Shape Factor equals 0.59 and its Circularity of 1.89 indicates otherwise. This explains why the main channel of the basin is quite extensive in relation to its area, from where these coefficients derive. Although the average slope of the basin equals 7%, indicating a smoothly undulating relief, the Carahá River basin
has mountainous relief at its headwaters (the total altimetric range of the basin is 240.00 m in a total length of 6.8 km). The longest flow path of the watershed is 9.7 km, with
the average sinuosity of 1.66 km km-1, which makes this channel a little winding, especially in
the reach where it is channelled. The watershed of the Carahá River, therefore, is prone to generate large volumes of surface runoff from intense rainfall, which commonly cause flood disasters. The urban predominance also explains the possibility of finding high rates of pollution in the drainage channels.
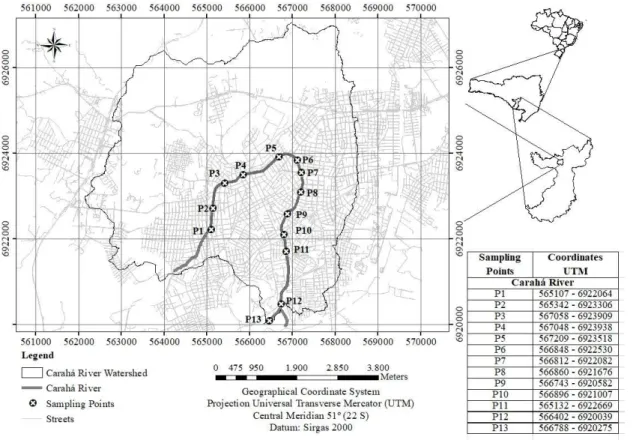
The samples were taken every two months over a period of 16 months. Thirteen sampling points were selected, distributed to represent the various sub-watersheds according to Otto Pfafstetter, resulting in an approximate distance of 500 meters from one point to another as shown in Figure 1.
2.2. Analytical methods
Rev. Ambient. Água vol. 14 n. 1, e2252 - Taubaté 2019
4 Jessica Quinatto et al.
Figure 1. Map of Carahá River basin with the sampling points.
2.3. Water quality index (WQI)
The WQI was calculated by the weighted product of the scores attributed to each parameter of water quality mentioned above. The scores are assigned according to pre-established curves (Equation 1) (Ott, 1978).
𝐼𝑄𝐴𝑁𝑆𝐹 = ∏𝑛𝑖=1𝑞𝑖𝑤𝑖 (1)
Where:
IQA is the water quality index (ranging from 0 to 100);
qi is the score of parameter i, obtained by the specific curve;
wi: weight assigned to the parameter in function of its importance in quality (ranging
from 0 to 1).
The weights assigned to each parameter are the following (Ott, 1978): dissolved oxygen (0.17), thermotolerant coliforms (0.15), pH (0.12), biochemical oxygen demand (0.10), phosphorus (0.10), temperature (0.10), total nitrogen (0.10), turbidity (0.08) and total solids (0.08). Ott (1978) suggests that the quality of water is expressed according to the following ranges of scores: very bad (0 to 25), bad (26 to 50), medium (51 to 70), good (71 to 90) and excellent (91 to 100).
2.4. Flow measurement and calculation of Load
Rev. Ambient. Água vol. 14 n. 1, e2252 - Taubaté 2019
performed approximately 32 hours after the end of runoff from rain effective. The measurements were carried out on three different days.
For this activity, a water flow meter (OTT Hydromet) was used at sampling points 1 to 12. First, the water velocity and depth was measured at many points along the margins. Then, the water flow was determined by multiplying the average velocity of the channel by the cross-sectional area of flow. The measurement of the average velocity was performed at 60% below the water surface, according to guidelines suggested by Azevedo Netto et al. (1998).
The flow rate at point 13 was measured using an ADCP sensor (RiverRay), which communicates with WinRiver II software (Teledyne RD Instruments, 2016). The Q-boat 1800P (The Oceanscience Group, 2011) was used as a platform to drive the ADCP sensor in channel cross-section profiling.
Finally, after the determination of the concentration and flow data, it was possible to perform the calculation of pollutant load F according to Equation 2.
𝐹 = 𝑄 ∗ 𝐶 (2)
Where:
F is the load (g h-1 or Kg h-1) Q is the flow rate (L h-1)
C is the concentration (g L-1 or Kg L-1)
3. RESULTS AND DISCUSSION
3.1. Water quality index
The results of the WQI showed that water quality at point 1 is classified as “very bad” and at points 2 to 13 as “bad” (Table 1). Overall, the scores were below 40, which shows that the land use and occupation on this watershed likely affect the water quality. Curiously, even the point at the source (Point 1) is strongly impacted mainly by domestic sewage disposal. As this point presents the lowest water flow, there is a minimal effect of dilution, and consequently the WQI was on average 24.89, classifying the water at this point as “very bad”. The municipality of Lages treats approximately 20% of all sewage, which may explain the predominance of water of “very poor” and “poor” quality. Among various types of environments and terrestrial landscapes, the urban rivers are the most used, occupied, modified, degraded, subjugated, and lastly, denied. In fact, there is a broad lack of environmental awareness from the society that inhabits its area. This is a problem which affects almost all developing countries.
Other authors studied several urban rivers and the obtained scores for the WQI are frequently similar. Souza et al. (2007), studied the Sal River in Sergipe, Brazil and classified its water as “very bad”. Pontes et al. (2012) obtained a classification of “bad” to “good” for the Banguelo River, in the region of Contagem in Belo Horizonte, Brazil. In the study conducted by Sharma et al. (2014), the authors found that the Ganges River in Allahabad, India, was classified as “bad”. Fia et al. (2015) studied the water body named“Ribeirão Vermelho” in Lavras, Brazil, and they obtained scores which classified it as “bad” to “medium”.
Jessica Quinatto et al.
6
Rev. Ambient. Água vol. 14 n. 1, e2252 - Taubaté 2019
Table 1. Average measurement results for parameters.
Parameter
Points
1 2 3 4 5 6 7 8 9 10 11 12 13
DO
(mg L-1) 3.08 2.80 3.61 3.59 4.09 3.86 4.04 3.92 4.14 4.46 4.39 3.37 3.35
TC
(CFU/100 mL) 3.97.105 3.71.105 1.54.104 1.24.104 3.61.104 2.78.104 8.55.104 3.51.104 4.01.104 3.44.104 2.09.104 1.28.104 7.61.103 pH 7.57 7.37 7.49 7.48 7.48 7.00 7.21 7.10 7.19 7.03 7.44 7.02 7.15 BOD5
(mg L-1) 35.56 19.50 11.38 13.31 14.88 10.13 14.19 11.06 12.06 12.69 11.06 8.94 14.31
TP
(mgP L-1) 1.03 0.68 0.53 0.55 0.67 0.32 0.37 0.28 0.35 0.35 0.33 0.40 0.36
T
(°C) 19.7 18.6 18.2 18.4 18.8 18.4 18.6 18.8 18.9 19.0 19.3 19.3 19.3 TN
(mgN L-1) 47.26 33.55 31.17 30.59 33.31 27.44 31.74 32.05 32.20 29.67 29.68 26.35 24.69
Nitrate
(mg L-1) 4.55 2.93 4.15 4.10 4.58 3.43 3.98 6.16 5.21 3.73 3.78 4.11 4.29
Nitrite
(mg L-1) 0.11 0.14 0.19 0.18 0.18 0.18 0.20 0.16 0.16 0.16 0.16 0.17 0.11
Turbidity (NTU) 33 16 11 11 14 15 17 17 15 14 14 13 17 TS
(mg L-1) 319.16 216.60 178.67 185.29 192.79 164.62 162.17 162.68 160.67 169.12 239.92 139.27 164.83
WQI 25 29 38 39 36 39 36 37 38 38 41 40 40
Flow rate
Rev. Ambient. Água vol. 14 n. 1, e2252 - Taubaté 2019 3.2. Pollutant load
Additionally, the pollutant load values were calculated with respect to some parameters such as BOD, phosphorus, TDS, TN, nitrite and nitrate. The concept of pollutant load involves the mass of a pollutant that is discharged into the water for a period of time (Metcalf and Eddy, 2013). The measurements of concentrations previously considered for WQI scores computing and the flow measurements were used to obtain the pollutant load values. The results are presented in Figure 2.
As can be seen in Figure 2A, the water flow increased gradually from nearly 24 L s-1 at the
source and reached an average value of 743 L s-1 at the mouth, where it flowed towards Caveiras
River.. Although the flows were measured on days which were not preceded by precipitation, a confidence interval that may reach 51.6% of average flow rate (point 11) was obtained, which demonstrates that the flow in the river is influenced by the discharge of raw sewage or even its disposal in urban drainage systems. The water flow showed insignificant variations from point 10 as this area has the lowest number of constructions in the watershed. These measurements of water flow allowed us to compute the pollutant load transported by the river. We observe from Figures 2B to F that all the pollutant load values increase in the downstream direction, which certainly resulted from various contributions of sewage or wastewater along the river.
With regard to the BOD5 (Figure 2B), the average pollutant load ranged between 3 to
39 Kg h-1 within the measurements. The municipality of Lages has a sewage treatment plant
which partially receives all the sewage flow generated in the city (around 20%). As a consequence, a large amount of the raw sewage is released into the Carahá River. Along with its extension, no recovery tendency was observed in the water quality due to the biological digestion (i.e. the BOD5 continuously increased to the mouth). This could be explained by the
time of concentration in the River and the constant addition of organic pollutant load to the water.
Similarly, analysing the pollutant load of phosphorus and total nitrogen (Figures 2C and 2D), the values reached 1 and 80 Kg h-1, respectively. The control of the release of these
nutrients into water bodies is of great concern to the basin management. The Caveiras River transports these nutrients to locations where there are dams built. In these places, the lentic ecosystem shows potential for eutrophication (Siziba, 2017). Therefore, knowledge of the phosphorus and nitrogen load permits the calculation of the mass of nutrients that will reach dams and thus assists in developing actions to control these releases. In this way, the measurement of pollutant load which is transported to the Caveiras River is more useful than the data based on concentration for Carahá River.
In addition, loads of nitrate and nitrite presented values equal to 11.48 and 0.30 Kg h-1 (Figures 2E and 2F), respectively, indicating that the sewage contamination is recent
Rev. Ambient. Água vol. 14 n. 1, e2252 - Taubaté 2019
8 Jessica Quinatto et al.
3.0 mg L-1, which was compatible with the values obtained in our study (Table 1). The authors
used techniques based on nitrate isotopic signatures and were able to describe the nitrate transformations in the river. The results showed that 12% of the nitrate is removed by denitrification process in the river. Based on this result, the denitrification could be an effect which could explain the variation in the nitrate concentration in the sampling points close to the mouth of Carahá River. This observation corroborates with the load values for nitrate shown in Figure 2F. As the load is a parameter which is not influenced by the dilution effects, the decrease in nitrate load shown in Figure 2F must be due to denitrification.
Figure 2. Flow measurements (A) and pollutant load for BOD (B), Phosphorous (C) and Total Kjeldahl Nitrogen (D).
Rev. Ambient. Água vol. 14 n. 1, e2252 - Taubaté 2019
presented in the form of WQI showed a constant behaviour of concentration from point 4 (Table 1), which creates the false impression that all points in the river have the same level of contamination. However, observing the data in Figure 2, it is possible to see an increase of up to 33 times, for instance, for the parameter nitrite. That is to say, the load transported 9.1 g h-1
of nitrite and the value reached 300 g h-1 at the mouth. From Figure 2, we can see more clearly
the continuous increase in water contamination along the basin, in contrast to the results expressed by the water quality index. In other words, the use of concentration values and the consequent computing of WQI provided results that did not show the tendency of pollution increasing along the basin, which may generate misinformation about the impact on the water body.
4. CONCLUSIONS
The results obtained in this study showed that the monitoring of Carahá River by pollutant load concept is more representative of the environmental impacts once it is independent of the dilution effects. The river is increasingly impacted from the source to the outlet, which could be detected by the pollutant load values. On the other hand, the water quality index showed similar values and was not effective to express the progressive contamination in the watershed. The use of the calculation of load for Carahá River is, therefore, a tool for assessment of pollution that can provide more appropriate information for the management of this water resource.
5. ACKNOWLEDGMENTS
The authors would like to thank the Municipal Department for Environment from Lages/SC for the financial support for this project.
6. REFERENCES
ABDEL-SATAR, A. M.; ALI, M. H.; GOHER, M. E. Indices of water quality and metal pollution of Nile River, Egypt. The Egyptian Journal of Aquatic Research, v. 43, n. 1, p. 21-29, 2017. https://doi.org/10.1016/j.ejar.2016.12.006
AMERICAN PUBLIC HEALTH ASSOCIATION. Standard methods for the examination of water and wastewater. Washington, DC, 2005.
ANTUNES, C. M. M.; BITTENCOURT, S. C.; RECH, T. D. Qualidade das águas e percepção de moradores sobre um rio urbano. Revista Brasileira de Ciências Ambientais, v. 32, p. 76-87, 2014.
AZEVEDO NETTO, J. M. DE A.; FERNANDEZ, M. F. E.; ARAUJO, R. DE; ITO, A. E.
Manual de Hidráulica. 8. ed. São Paulo: Blucher, 1998.
BHATTI, M. T.; LATIF, M. Assessment of water quality of a river using an indexing approach during the low flow season. Irrigation and Drainage, v. 60, n. 1, p. 103-114, 2011. https://doi.org/10.1002/ird.549
Rev. Ambient. Água vol. 14 n. 1, e2252 - Taubaté 2019
10 Jessica Quinatto et al.
DEUTSCHES INSTITUT FÜR NORMUNG. DIN. 38405-9: German Standard Methods for Examination of Water, Waste Water And Sludge; Anions (group D), Determination of Nitrate Ion (d 9). Berlim, 1979.
EGBORGE, A. B. M.; BENKA-COKER, J. Water quality index: application in the Warri River, Nigeria. Environmental Pollution Series B, Chemical and Physical, v. 12, n. 1, p. 27-40, 1986. https://doi.org/10.1016/0143-148X(86)90004-2
FIA, R.; TADEU, H. C.; MENEZES, J. P. C. de; FIA, F. R. L.; OLIVEIRA, L. F. C. de. Qualidade da água de um ecossistema lótico urbano. Revista Brasileira de Recursos Hídricos, v. 20, n. 2, p. 267-275, 2015.
HOSEINZADEH, E.; KHORSANDI, H.; WEI, C.; ALIPOUR, M. Evaluation of Aydughmush river water quality using the national sanitation foundation water quality index (NSFWQI), river pollution index (RPI), and forestry water quality index (FWQI). Desalination and Water Treatment, v. 54, n. 11, p. 2994-3002, 2015. https://doi.org/10.1080/19443994.2014.913206
HOU, W.; SUN, S.; WANG, M.; LI, X.; ZHANG, N.; XIN, X. et al. Assessing water quality of five typical reservoirs in lower reaches of Yellow River, China: Using a water quality index method. Ecological indicators, v. 61, p. 309-316, 2016. https://doi.org/10.1016/j.ecolind.2015.09.030
JANI, J.; TOOR, G. S. Composition, sources, and bioavailability of nitrogen in a longitudinal gradient from freshwater to estuarine waters. Water Research, v. 137, p. 344-354, 2018. https://doi.org/10.1016/j.watres.2018.02.042
LI, C.; LI, S.; YUE, F.; LIU, J.; ZHONG, J.; YAN, Z. et al. Identification of sources and transformations of nitrate in the Xijiang River using nitrate isotopes and Bayesian model.
Science of the Total Environment, v. 646, p. 801-810, 2019. https://doi.org/10.1016/j.scitotenv.2018.07.345
MAANE-MESSAI, S.; LAIGNEL, B.; MOTELAY-MASSEI, A.; MADANI, K.; CHIBANE, M. Spatial and temporal variability of water quality of an urbanized river in Algeria: The case of Soummam Wadi. Water Environment Research, v. 82, n. 8, p. 742-749, 2010. https://doi.org/10.2175/106143009X12465435982854
METCALF, L.; EDDY, H. P. Wastewater Engineering: Treatment and Resource Recovery. 5th ed. New York: McGraw-Hill Education, 2013.
NTENGWE, F. W. Pollutant loads and water quality in streams of heavily populated and industrialised towns. Physics and Chemistry of the Earth, Parts A/B/C, v. 31, n. 15-16, p. 832-839, 2006. https://doi.org/10.1016/j.pce.2006.08.025
OTT, W. R. Environmental indices: theory and practice. Ann Arbor: Ann Arbor Science Publishers, 1978.
PADILHA, V. L. Modelagem hidrológica orientada por eventos de inundação em Lages/SC. 2017. 174 p. Dissertação (Mestrado em Engenharia Ambiental) – Universidade Federal de Santa Catarina, Santa Catarina, 2017.
Rev. Ambient. Água vol. 14 n. 1, e2252 - Taubaté 2019
RICHARDS, R. P. Estimation of pollutant loads in rivers and streams: A guidance document for NPS programs. Denver: USEPA, 1998. p. 108.
SHARMA, P.; MEHER, P. K.; KUMAR, A.; GAUTUM, Y. P.; MISHRA, K. P. Changes in water quality index of Ganges river at different locations in Allahabad. Sustainability of Water Quality and Ecology, v. 3, p. 67-76, 2014. https://doi.org/10.1016/j.swaqe.2014.10.002
SIZIBA, N. Effects of damming on the ecological condition of urban wastewater polluted rivers. Ecological Engineering, v. 102, p. 234-239, 2017. https://doi.org/10.1016/j.ecoleng.2017.02.019
SOUZA, R. R. de.; COSTA, J. J.; SOUZA, R. M. e. Construção de modelo empírico para o monitoramento de recursos hídricos do Rio do Sal/Sergipe. Revista Brasileira de Ciências Ambientais, n. 8, p. 16-28, 2007.
SUN, W.; XIA, C.; XU, M.; GUO, J.; SUN, G. Application of modified water quality indices as indicators to assess the spatial and temporal trends of water quality in the Dongjiang River. Ecological Indicators, v. 66, p. 306-312, 2016. https://doi.org/10.1016/j.ecolind.2016.01.054
THE OCEANSCIENCE GROUP. Q-BOAT 1800 User Guide. Cypress, 2011.
VON SPERLING, M. Introdução à qualidade das águas e ao tratamento de esgotos. Belo Horizonte: Editora UFMG, 1996.
WANG, S.; HE, Q.; AI, H.; WANG, Z.; ZHANG, Q. Pollutant concentrations and pollution loads in stormwater runoff from different land uses in Chongqing. Journal of Environmental Sciences, v. 25, n. 3, p. 502-510, 2013. http://dx.doi.org/10.1016/S1001-0742(11)61032-2
TELEDYNE RD INSTRUMENTS. Winriver II User Guide.Cypress, 2016.