R E S E A R C H
Open Access
Psychometric properties of the complete
version of the World Health Organization
Quality of Life Assessment (WHOQOL-OLD):
reduced response scale
Rômulo Lustosa Pimenteira de Melo
1*, Edivan Gonçalves da Silva Júnior
2, Rafaella Queiroga Souto
3,
Ísis Simões Leão
4and Maria do Carmo Eulálio
2Abstract
This study sought to compare evidence of the factorial validity of the adapted version of the World Health Organization Quality of Life (WHOQOL-OLD) scale (three response options) with the original version of the scale. We included two populations of individuals age 60 years or older from northeast Brazil. The majority of participants were women who had an elementary-level education. The first population comprised 335 elderly persons who completed the original version of the scale, and the second was composed by 265 elderly persons who completed the shortened scale. Results indicated better adjusting on the reduced scale and showed items with lower error probability in assessment of elderly persons with lower quality of life.
Keywords:Health of the elderly, Quality of life, Validation studies
Background
The term quality of life (QL) entails a complex, multidi-mensional, and multidetermined construct that is usually compared with well-being and happiness, but QL can present a variety of definitions and forms to be mea-sured (Gordia, Quadros, Oliveira, & Campos, 2011). One of the most-used definitions was created by the World Health Organization (WHO), which defines QL as “individuals’perception of their position in life in the context of the culture and value systems in which they live and in relation to their goals, expectations, standards and concerns”(WHOQOL Group, 1995).
The rise in the life expectancy of the world population and the need to provide good life conditions for older individuals pose a challenge to the scientific community to study quality of life in older people and identify what factors may influence their life (Leão, 2012; Liu et al., 2013; Lucas-Carrasco, Laidlaw, & Power, 2011). Quality of life measurement has been gaining attention, and
although such measures are widely used, most instru-ments are not easy to understand and validate for older populations, which presents specific challenges and higher prevalence of cognitive and health problems and low education (Chachamovich, Fleck, Clarissa, & Power, 2008). For this reason, improvement of instruments with which we can measure elderly persons’ QL in terms of validity and in a consistent, easily understandable form is needed (Caballero et al., 2013).
To evaluate QL and its related difficulties, the WHO created the WHOQOL-100 and, subsequently, the WHOQOL-BREF, which are used around the world. However, these instruments do not include elements specific to older populations. Therefore, a study using the WHO instruments was carried out to investigate QL among Brazilian old people. Results indicated that in the studied group, QL is especially related to well-being, positive thoughts, and health (Fleck, Chachamovich, & Trentini, 2003).
Results showed features of the older population that should be included in instruments for appropriate meas-urement of QL. To address these features, the WHOQOL group created a specific questionnaire for elderly persons, * Correspondence:romulo.psiq@gmail.com
1Cidade Universitária (UFPB), s/n - Castelo Branco III, João Pessoa-PB
58051-900, Brazil
Full list of author information is available at the end of the article
known as WHOQOL-OLD. This questionnaire follows the same method of other instruments of QL created by the WHO (Fleck, Chachamovich, & Trentini, 2006).
The WHOQOL instrument has been used in different countries and has presented good psychometric formance. A study carried out among 286 elderly
per-sons concluded that both WHOQOL-OLD and
WHOQOL-BREF have good internal consistency and construct validity (Lucas-Carrasco et al., 2011). The Chinese version of WHOQOL-OLD also had good in-ternal construct and discriminating validity (Liu et al., 2013). Conrad, Matschinger, Riedel-Heller, von Gottberg, and Kilian (2014) conducted a validation study among a representative sample of German old people and also concluded that the instrument had adequate psychomet-ric proprieties. The result of the factorial analysis of a study conducted with older adults living in Finland and Poland showed the exclusion of some items of the instrument and its division into two factors, the first fac-tor with autonomy and sensory functioning; and the sec-ond factor with satisfaction in past, present and future activities, death, and dying. Both factors showed good internal, convergent, and discriminant validity (Caballero et al., 2013).
In Brazil, the validation study of WHOQOL-OLD was developed with a sample of 424 old people from Porto Alegre–RS, and analyses enabled the researchers to consider the scale as having good psychometric general performance with satisfactory internal consistency, dis-criminant validity, concurrent validity, and reliability in test-retest validity but with fragility in the facets“sensory abilities” (SA) and intimacy (Fleck et al., 2006). Poster-iorly, we performed analysis with Rash models in the same population and few adequacies were confirmed for items’curves for SA and“death and dying.”To solve the problem, categories of responses for items 4, 5, 9, and 20 were reduced from five to four options, and items 3 and 18 were excluded. After exclusion, results presented better indicators (Chachamovich et al., 2008).
Because previous studies had varied results and used spe-cific samples from particular regions, studies performed among old people from northeast Brazil sought to evaluate psychometric properties of the WHOQOL-OLD scale (Leão, 2012). One study suggested that scale could have better psychometric performance if the five answer cat-egories of the instrument were condensed into three: the first would be the union of responses 01 and 2, the second the response category would be response 3, and the third would be responses 4 and 5. Although the extracted model with a factorial exploratory analysis of the three-response option would be a better adjustment when compared with the five-response model, the criterion of root-mean-square error of approximation (RMSEA) was still not ideal and suggested that new improvements should be tested.
The efficacy of reducing the WHOQOL instrument from five to three categories was also proved in a low-education population (Chachamovich et al., 2008) and one with intellectual deficiencies (Fang et al., 2011). These findings suggest that this instrument could be successful in populations that may have difficulty under-standing the scale with five response points. This can occur with old people because those with a low educa-tional level tend to have greater difficulty discriminating their responses when presented with a high number of options; that, in turn, could compromise response valid-ity and consistency (Chachamovich et al., 2008). These findings indicate that having five response categories available can expose individuals to a prejudicial effort given that the scale tends to present better psychometric performance with three response categories. These results were indicated through Confirmatory Factor Analysis and Item Response Theory, model of Samejima (Fang et al., 2011). Based on these considerations, it is possible that the higher the number of response options, the more difficulty old people will have in choosing the category that clearly expresses their option. Therefore, WHOQOL-OLD applied to older people in northeast Brazil or other less educated populations should use a Likert-type three-point scale.
We highlight, however, that an important limitation in the studies by Chachamovich et al. (2008) and Leão (2012), which verified better adjustment to three response options, is that the scale was applied in its original version (five response options) and then reduced only during psy-chometric analysis. This procedure does not prevent older people from finding it difficult to answer items because re-duction was made posteriorly. In this sense, further stud-ies are needed to apply the reduced response scale to old people in order to compare the two versions and analyze behavior of responses in terms of QL in old people.
This need motivated us to perform our study. Our objective was to compare evidence of validity of the three-response WHOQOL-OLD scale with the original, five-response version and to verify behavior of items from the adapted version by the use of item response theory.
Methods
partner, the mean age was 73.9 years (SD, 7.34); and 84.2% had an elementary education. The second applica-tion included 265 elderly persons: 68.7% women, 51.0% married or living with a partner, mean age of 75 years (SD, 6.14), and 85.5% with an elementary education.
To select participants, we adopted the following criteria: minimal age of 60 years and agreement to participate in the study. We excluded old people who had suggestive cognitive deficit according to the Mini-Mental Status Examination (MMSE), and severe hearing deficit (observed by self-report and/or the own researcher).
Instruments
To characterize participants, we applied a sociodemo-graphic questionnaire with items that verified age, sex, formal education, and marital status.
The MMSE was used for tracking participants’ cogni-tion. This instrument is commonly used in research among this population and can be easily and rapidly applied. The exam includes 30 questions (maximal score of 30) (Folstein, Folstein, & McHugh, 1975). We used the adapted version for the Brazilian population, evalu-ated according to formal education criteria (Brucki, Nitrini, Caramelli, Bertolucci, & Okamoto, 2003).
The WHOQOL-OLD scale evaluates QL in old people. The instrument was translated and validated for the Brazilian population (Chachamovich et al., 2008; Fleck et al., 2006). It has 24 items with responses formulated on a Likert-type scale: “nothing” (1), “rarely” (2),“medium” (3),“very”(4), and“completely”(5). Six domains are rep-resented: sensory function (SF); intimacy (Int); autonomy (Aut); social participation (SP); past, present, and future activities (PPF); and death and diet (D&D). In the re-duced version (second sample), we adopted the sugges-tion by Leão (2012) to use three response opsugges-tions: “nothing”(0),“medium”(1), and“completely”(02).
Procedures
In the two samples, data were collected with the collab-oration of undergraduate students appropriately trained to apply instruments for the study. The data collection was done at the homes of the elderly participants. Ini-tially, participants were informed of the study objective and the confidentiality of their identification and data provided; they state their willingness to participate in the study and signed a consent form and agreed to posterior instrument application.
The studies followed procedures observed by the 466/ 2012 resolution of national health council and were approved by the Ethical and Research Committee of the Universidade Estadual da Paraíba, number 0505.0.133.000– 10 (study that applied original scale version) and number 20599513.9.0000.5187 (study that applied reduced version).
The WHOQOL-OLD instrument is freely available for research use. The modified version proposed in this article will also be available with no copyrights.
Data analysis
The dimensionality hypothesis was verified by the con-firmatory factorial analysis (CFA) with the Lavaan package (Rosseel, 2012) in software R. Considering the following adjustment index:χ2/df index, Tucker-Lewis index (TLI), comparative adjustment index, and approximate mean square error (RMSEA). For this, Marôco (2014) suggests the following criteria:χ2/df between 2 and 5 poor adjust-ment and between 1 and 2 good adjustadjust-ment; TLI and CFI between 0.8–0.9 poor adjustment, and between 0.9–0.95 good fit; for the RMSEA between 0.05–0.10 acceptable and < 0.05 very good adjustment.
We adopted as the estimation method diagonally weighted least squares (DWLS) with polychoric matrices with Satorra-Bentler scaled chi square (S-Bχ2) robust (Satorra & Bentler, 1994). This technique is appropriate for test models with ordinal categorical variables in small and medium size samples (n< 500) (Jöreskog & Sörbom, 1999). The internal consistency of the WHOQOL-OLD factors was checked by composite reliability (CR).
After AFCs were done, to estimate parameters of items of scale by item response package theory (IRT), ltm (Rizopoulos, 2006) and Mokken (Van der Ark, 2007) were adopted. The Mokken package showed monoticity of items and scale. This hypothesis considered the prob-ability of one subject responding correctly to an item difficult to get right and having less difficulty or greater ease compared with a subject who had made an error on the difficult item. This propriety indicates that response to items is a theta function (Van der Ark, 2007), specific-ally for the WHOQOL-OLD instrument, which is not about getting an answer right or wrong but how satisfied with the expression of the item. The literature suggests that a Löevinger H (H for total scale and HS for each item) above 0.30 is a good indicator of monotonicity scale and items. In addition, the rho of de Mokken was used to evaluate whether data of the sample supported the IRT mathematical model. Values higher than 0.80 are indicators that data are reliable (Mokken & Lewis, 1982; Van der Ark, 2007).
Next, we compared the IRT model of constant dis-crimination (ac) [Rating Scale Model (Andrich, 1978)]
participants of GRM model, we investigated the use of the χ2test, the differences between frequencies of stan-dards of response observed, and predicted frequencies by the model. We adopted values lower than 3 as an in-dication of good adjustment because of the small differ-ence between what was observed and predicted (Drasgow, Levine, Tsien, Williams, & Mead, 1995).
The hypothesis of local independence of the items was verified according to the recommendation of Jr Finch and French (2015), using the Yen’s Q3 statistic (Yen, 1993). Values greater than 0.2 suggest a violation of the local independence assumption.
Finally, the ltm package was used to estimate difficulty parameters [Response thresholds (j)] and discrimination (a) of items. Response thresholds (j) represents the be-havior of items concerning probability of respondents choice of answers because of the theta level (in this study, theta represents QL score standardized inzscore) and discrimination (a), the property that item has to achieve difference to respondents in function to theta level (Embretson & Reise, 2000). This means that indi-viduals with different QL, in case of the item present good discrimination, they have a tendency to register different responses in this item. The IRT model adopted was the graded response model (GRM).
Results
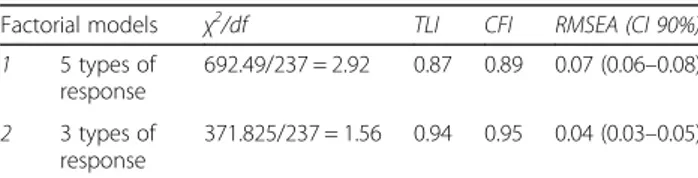
Table 1 presents adjustment indicators for two version of the WHOQOL-OLD scale. The first model is formed by the WHOQOL-OLD scale with Likert-type response (five response options, traditional version) and the second represents the WHOQOL-OLD scale with three options of response (reduced version). Both scales were tested for hexafactorial oblique structure, i.e., with six factors that are correlated among themselves.
Considering that they are two independent samples, with different styles of answers, it was avoided to com-pare the adjustments of the two models. Therefore, the objective was to verify if the hypothesis of unidimension-ality could be assumed. In this sense, it was verified that the adjustment indicators with three response options (second model) presented a good fit (χ2/df = 1.56, TLI = 0.94, CFI = 0.95, RMSEA = 0.04) and the model with five response options (first model) showed acceptable but
poor fit (χ2/df = 2.92, TLI = 0.87, CFI = 0.89, RMSEA = 0.07) (Table 1) (Marôco, 2014).
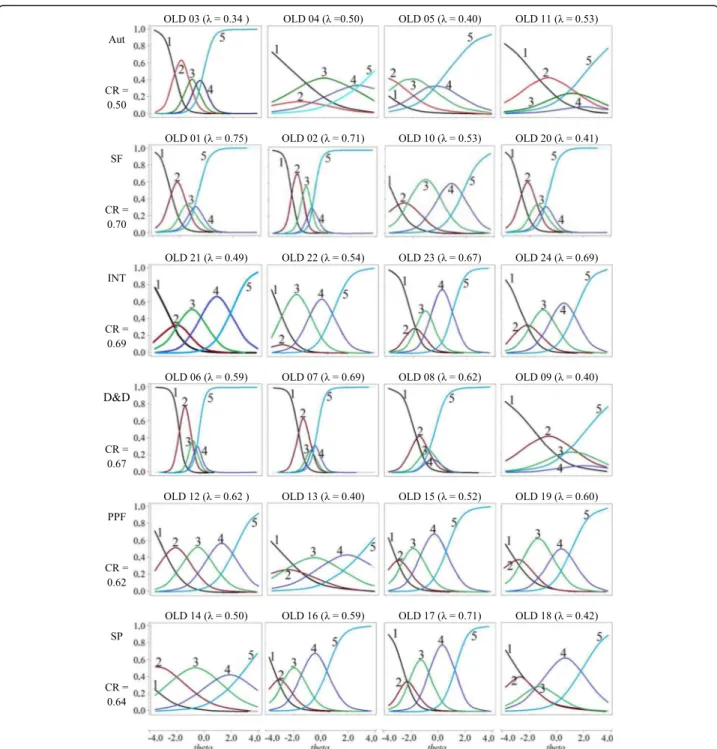
For the reduced version the composite reliability ranged from 0.52 (Aut factor) to 0.77 (FS factor) (Fig. 1). For the original version, it ranged from 0.50 (Aut Factor) to 0.70 (SF Factor) (Fig. 2).
We compare the behavior of the items in two response structures, in the six factors. The comparison of the variable discrimination models (GRM model) with con-stant discrimination showed a better fit to the model of Samejima (variable discrimination), with statistically sig-nificant differences for the six factors of the instrument in both versions (p< 0.05). In addition, the response pat-terns of the participants do not present problems that would be substantially relevant, i.e.,χ2greater than 3.0.
The results of the Mokken analysis for six factors corroborated the monoicity scale and items presenting LoevingerHequal to or greater than 0.3 and Rho > 0.80. One exception was the domain “Sensory function” (SF), with H= 0.28 (abbreviated version) and H= 0.27 (ori-ginal version) and Rho = 0.72 (abbreviated version). Besides that, the statistic of Q3, to test the local inde-pendence of the items, in all combinations of items, for the two versions of the scale presented values superior to 0.2. The exception was for the autonomy factor, from the original scale, which presented a Q3 value of 0.22.
Table 2 shows parameters of WOQOL-OLD items with three response options. The factor that presented the lower mean and greater variance was “autonomy” (Aut) (M= 1.72, DP = 2.42), with one item that presented higher discrimination in the instrument [Item 3 (a = 5.36)] and, in the other items, the lowest discrimination. Mean of information of the “autonomy” factor was also the lowest of the six factors (M= 3.00; DP = 4.98). The factor that presented higher discrimination was “ intim-acy” (Int) (M= 2.33, SD = 1.04), and the one that pre-sented the higher mean of information was “sensorial function” (SF). In relation to response hedge, four fac-tors had first hedge mean (j1) lower than values of−2 in
the theta scale and no other factors overcame the mean of 1 in the second hedge.
Figure 1 presents items characteristics curves (ICC) of WHOQOL-OLD. The “autonomy” factor represents the item OLD 3 “How much freedom do you have in order to take your own decisions,” with great discrim-ination power but small theta interval. For example, each line of ICC represents the probability of support for one of the three possible responses because of the level of QL (theta). In the OLD 3 item, we observed that when the line that represents answer 1 (“ noth-ing”) started to decline, changes in theta were quite sensible (representing discrimination ability) until they became most probable for the specific level (i.e., to j1
of item OLD 3 =−1.98 theta) the alternative choice 2 Table 1Adjustment indicators for two versions of the
WHOQOL-OLD scale
Factorial models χ2/df TLI CFI RMSEA (CI 90%)
1 5 types of response
692.49/237 = 2.92 0.87 0.89 0.07 (0.06–0.08)
2 3 types of
response 371.825/237 = 1.56 0.94 0.95 0.04 (0.03
–0.05)
(mean). The same occurs with transition between re-sponses 2 and 3 (j2 of OLD 3 =−1.00 theta). For
OLD 3, approximately, after zero score of theta scale, a constant behavior is seen in line 3 (option of complete response), i.e., old people with thetas above of this point, even with different QL, support the same answer. Other items of the “Autonomy” factor (OLD 4, 5, 11) cover old people with greater QL, but with low discrimination.
Apparently, one specificity was in the D&D factor. The ICCs for this factor showed a polarization in behavior of answers: the answer“medium” had, in almost all thetas,
less chance to be chosen than answers “nothing” and “completely”(Fig. 1).
Figure 2 presents the ICCs from the original WHOQOL-OLD version to investigate whether the be-havior of the items in the factors would be different from the adapted version (Fig. 1). It is verified that in all factors, two or more items present response options with low probability of endorsement, regardless of theta. This would also indicate that a version with fewer options would be plausible. Regarding the autonomy factor item OLD 3 presented good discrimination, but the remaining items 4, 5, and 11 presented discrimination problems.
Fig. 1Description of the saturations, consistency, and WHOQOL-OLD Items Characteristic Curves (ICC).The vertical axis represents the probability of choosing the answer for the item.“nothing”(01),“medium”(02), and“completely”(03) (Response options to items).λ–Lambdas. CR
Discussion
This study presented evidence of factorial validity in aversion of the WHOQOL-OLD scale using three response categories for older people from a countryside city in Paraíba, Brazil. Results found that use of this measure (three options for response) with hexafactorial oblique structure can be more acceptable than the original version. Another promising aspect of this ver-sion is that, unlike the studies by Leão (2012) and
Chachamovich et al. (2008), which needed to change the number of items in order to find an acceptable adjust-ment, this study, without denying that it may be possible to find adaptations or insertions of content in future studies, did not need to remove any item from the original version of the scale. Thus, it represented only a change in the number of response options for each item. This can indicate that difficulty in finding stability in the factorial structure of WHOQOL-OLD lies not only in
Fig. 2WHOQOL-OLD Items Characteristic Curve (original). The vertical axis represents the probability of choosing the answer for the item.
the problems of concept order that are linked to the complexity of the QL construct but also in the need to facilitate interpretation of options in answers from old people.
Approximately 80% of elderly participants in the two samples of this study had completed only elementary education. This aspect makes it difficult for them to understand scales with many answer options Table 2Description of the parameters of WHOQOL-OLD items (three answer options)
Items Response
thresholds
â Inf. %
j1 j2
AUT OLD 03- Quanta liberdade você tem de tomar as suas próprias decisões −1.98 −1.00 5.36 10.48 100
OLD 04- Até que ponto você sente que controla o seu futuro −3.45 2.50 0.40 0.34 55.35
OLD 05- O quanto você sente que as pessoas ao seu redor respeitam a
sua liberdade −
4.43 −0.14 0.54 0.54 61.63
OLD 11- Até que ponto você consegue fazer as coisas que gostaria de fazer −3.39 2.07 0.58 0.67 64.49
Média (DP) −3.31 (1.00) 0.85 (1.69) 1.72 (2.43) 3.00 (4.98) 70.00 (20.12)
SF OLD 01- Até que ponto as perdas nos seus sentidos afetam a sua vida diária −0.30 1.24 4.03 7.98 100
OLD 02- Até que ponto a perda dos sentidos afeta a sua capacidade de
participar em atividades −0.04 1.32 3.07 5.75 99.98
OLD 10- Até que ponto o funcionamento dos seus sentidos afeta a sua capacidade de interagir com outras pessoas
0.21 2.03 1.66 2.88 97.89
OLD 20- Como você avaliaria o funcionamento dos seus sentidos −2.84 0.79 −1.23 2.09 88.86
Média (DP) 0.67 (1.46) 0.95 (1.21) 1.88 (2.29) 4.67 (2.70) 96.68 (5.30)
INT OLD 21-Até que ponto você tem um sentimento de companheirismo
em sua vida −2.74 −0.52 1.18 1.80 88.9
OLD 22-Até que ponto você sente amor em sua vida −2.51 −0.73 1.82 3.18 96.54
OLD 23-Até que ponto você tem oportunidades para amar −1.39 −0.27 3.50 6.67 99.99
OLD 24-Até que ponto você tem oportunidades para ser amado −1.64 0.05 2.85 5.52 99.94
Média (DP) −2.07 (0.65) −0.37 (0.33) 2.33 (1.04) 4.29 (2.20) 96.34 (5.21)
D&D OLD 06-Quão preocupado você está com a maneira pela qual irá morrer 0.45 1.58 2.14 3.57 99.66
OLD 07-O quanto você tem medo de não poder controlar a sua morte 0.34 0.98 3.10 4.91 99.99
OLD 08-O quanto você tem medo de morrer 0.32 1.09 2.04 3.02 99.82
OLD 09-O quanto você teme sofrer dor antes de morrer −1.38 −0.16 1.10 1.50 95.55
Média (DP) −0.07 (0.88) 0.87 (0.73) 2.09 (0.82) 3.25 (1.41) 98.75 (2.14)
PPF OLD 12-Até que ponto você está satisfeito com as suas oportunidades para continuar alcançando outras realizações na sua vida −
1.88 −0.24 1.96 3.50 99.13
OLD 13-O quanto você sente que recebeu o reconhecimento que merece
na sua vida −3.45 0.66 0.70 0.88 72.27
OLD 15-Quão satisfeito você está com aquilo que alcançou na sua vida −3.65 −1.05 1.28 1.83 78.42
OLD 19-Quão feliz você está com as coisas que você pode esperar daqui
para frente −
1.85 0.11 3.06 6.03 99.93
Média (DP) −2.71 (0.98) −0.13 (0.71) 1.75 (1.01) 3.01 (2.25) 87.43 (14.19)
SP OLD 14-Até que ponto você sente que tem o suficiente para fazer em
cada dia −3.11 0.04 1.26 2.06 86.59
OLD 16-Quão satisfeito você está com a maneira com a qual você usa o
seu tempo −
2.59 −0.21 1.96 3.66 96.93
OLD 17-Quão satisfeito você está com o seu nível de atividade −1.92 0.03 3.39 6.72 99.96
OLD 18-Quão satisfeito você está com as oportunidades que você tem para participar
de atividades da comunidade
−1.66 0.52 0.97 1.45 92.17
Média (DP) −2.32 (0.66) 0.09 (0.31) 1.89 (1.08) 3.47 (2.35) 93.91 (5.84)
Note: ji–Response thresholds; â–Discrimination; Inf. Information in the range of−4 to + 4 theta; % - percentage of total item information for the range of−4 to
(Chachamovich et al., 2008; Fang et al., 2011; Fernandes & Santos, 2015; Matos, Mourão, & Coelho, 2016). Old people who lived in Northeast Brazil have cultural traits different from Brazilians of the South region, where the original version was evaluated and validated. One of these traits is level of education—old people from Porto Alegre (South region, Brazil) have, on average, a higher level of education than those from the Northeast region (Melo, Eulalio, Gouveia, & Silva, 2013; Melo, Ferreira, & Texeira, 2014).
After noting that reducing the answer options on this scale presented better adjustment, we investigated the behavior of these options regarding QL in these old people. The study showed that chance of discrimination of items in old people with different QL can be considered high because in case QL higher than 1.70 (Baker, 2001), this number indicates high quality discrimation in terms of quality of life. However, according to the author (Baker & Kim, 2017), these indicators were proposed for dichot-omous items, and cutoff points considered for these parameters need to increase because of the number of options on the studied scale. There is a need to consider the tendency of increased discrimination of items seen with a higher number of possible answers because, natur-ally, these respondents would have more chances to be divided according to answer options (Cavalcanti, Melo, Medeiros, Oliveira, & Gouveia, 2016; Tezza, Bornia, & Andrade, 2011). For this reason, comparison of discrimin-ation of scales is sensible because they contain items with a number of different answer options.
Although the categories “autonomy” (Aut) and “ sen-sorial function” (SF) did not differ from other facets, they were the ones that presented smaller means of discrimination. Therefore, this property represents the ability of an item to differentiate among respondents because of changes in theta (in this study, represented by QL) (Samejima, 1969), and because of these changes, the higher the discrimination, the greater the sensibility of the item for placing subjects in its real position on the QL scale. There are at least two problems that can be emphasized for factors with low discrimination. The first would be interference in studies in which the use of the score for the factor for covariance studies, because subjects with different QL can be classified in the same score, would increase residues of the model, and gener-ate correlation with magnitudes that reflect less loyal relationship between variables. In this case, the construct would not vary when and where it should vary. In addition, the less variability there is, the more difficult the investigation becomes and the more difficult the implementation of public policies that need to absorb and address different demands of subjects with different QL. Therefore, it would be difficult to differentiate elderly persons in terms of QL.
Other important information that IRT offers is an indication that items might not provide the same infor-mation condition to elderly persons that QL is different. In this regard, a warning would be made about the observation of the mean of answers hedges, in which we observed hedges (mainly the j1) that cover most of the low portion of theta. This indicates that the scale would evaluate fewer mistakes from elderly persons with worse QL. This is more evident for the factor “Social and intimacy participation,” in which hedge “two” (j2) pre-sents lower means of scale.
We also observed that the “intimacy” factor had a higher mean of discrimination because in addition to of-fering more safety information for elderly persons with low QL, it could precisely discriminate and quantita-tively provide more information on the construct. In this regard, in the study of Leão (2012), which used focal groups of old people to investigate factors and items of WHOQOL-OLD, the intimacy with family had an em-phasis in speech of elderly person, who attributed the opportunity of loving and being loved as critical for their health and improved their QL. The importance of love was also found in other studies (Fernandes & Andrade, 2016; Teixeira, 2013). These elements are present in fac-tor items such as“Intimacy”(Ex. item 23– “To what ex-tent do you have the opportunity of loving” (more discrimination of the factor). However, lack of valorization, lack of attention, and abandonment would be among the largest fears and risks for QL in the study of Leão (2012). Perhaps given the importance placed on this question in assessment of life aspects by elderly per-sons, the item would be better able to distinguish between different QLs in the“intimacy” factor. If loving or being loved is experienced with greater need and priority, small changes in these aspects may be felt with more intensity and satisfaction, therefore justifying the higher mean of discrimination of this factor.
Table 2 and Fig. 1 show that the “autonomy” factor presents (except item 3) items with discrimination prob-lems and information. For this reason, specifically for this factor, we verified that ICCs of the scale with five options of answer (Fig. 2). This comparison can indicate whether the problem can reduce the number of answer options from five to three. Results suggest that this hypothesis may be excluded because the same items in Fig. 2 present discrimination problems and little infor-mation. This suggests that the problem may be more related to the content of the items.
are nothing.” The WHOQOL-OLD instrument has the aim to evaluate QL in old people from different con-texts. This requires the need to develop items, at times generic content, to cover the greatest number of popula-tion members, such as in item 11 (“To what extent you can do things you would like to do”). When someone does what he/she likes, that status can depend of other previous conditions, such as health and finances; there-fore, it would be possible to test this factor with items that would place these conditions in a form more dir-ectly related to autonomy (for example, the hypothetical item “My economic condition allows me to do what I like to”).
The factor D&D also presented specificity. The second option for answer items (red curve of Fig. 2) does not give information on quality of life in D&D. Curves of items 6 and 7 show that a small parcel of theta has more changes in choosing the option of the answer“medium” (red curve). For items 8 to 9, the greater change does not exist. For example, for item 9, an elderly person with specific QL in D&D can have more changes in choosing option 0 (“nothing”), and another elderly person, with QL close to the anterior, would have more changes in choosing response 2 (“completely”). This shows that elderly persons tend to be not at all satisfied or “completely” satisfied in relation to D&D. Other authors also verify this polarization for this factor (Melo et al., 2013).
According to study of Leão (2012), elderly persons from Northeast Brazil report that they do not fear death or do not think too much about dying. These finding agree with items of the D&D factor that are related to the manner of death, fear over having no control over how one dies, or even feeling pain before dying. Still, regarding this respect, Menezes e Lopes (2014) found ambiguous reports on fear of death, showing that old people, who are closer to death, bring a dynamic of feeling that, within the same person, oscillate constantly between fear and resigna-tion. This variation of feeling could be explained by ambiguity of reports on death, found by authors, and polarity of satisfaction in the D&D factor in the WHOQOL-OLD instrument.
The majority properties that instrument presented were positive. For this reason, we understand that the version of the scale that uses three answer options shows evidence that the instrument can be applied in the elderly population from Northeast Brazil and even to the overall Brazilian elderly population. Therefore, same re-sults show that this does not mean that the scale needs to be adjusted in order to improve it, mainly because, conceptually, QL is multidetermined and subjective and it is difficult to avoid the variability that exists in each cultural context (Gordia et al., 2011; Vilar, 2015).
In our study, an aspect of moderation that needed to be taken into account is the non-probabilistic sample used. This limitation increases the representative error and reduces trustworthiness when compared to factorial models of two versions of the WHOQOL-OLD scale. Further studies need to be done with the reduced ver-sion of the WHOQOL-OLD. There is a need to check whether different education levels affects the consistency of elderly persons’responses. This can be done by differ-ent functional techniques.
Conclusions
Finally, we suggest adoption of number 0 to represent the alternative of the answer “nothing” of 1 to answer “medium” and 2 to answer “completely.” This makes it easy to calculate the standardized scores (range, 0 to 100) proposed by the original version of WHOQOL-OLD, based on the classic theory of tests. Posteriorly, to multiply answers by 50 would be enough to avoid more calcula-tions. After multiply and elaborate factors, because of items observed in Table 2, the score would be used to compare QL in studies that use both the original scale and the reduced scale because metrics were standardized from 0 (for dissatisfaction with QL) to 100 (complete satisfac-tion with QL).
Further studies should be performed both to facilitate understanding of QL among elderly persons and to im-prove measurement of QL. This study may contribute to development of other studies in this area of knowledge.
Acknowledgements
We thank all the elderly people who voluntarily participated in the study. The WHOQOL-OLD instrument is freely available for research use. The modified version proposed in this article will also available with no copyrights.
Funding
This research received no specific grant from any funding agency or from commercial or not-for-profit sectors.
Authors’contributions
ISL, MCE, and RLPM contributed to a conception, work design, and correction after first opinion of the PRC. ISL, RLPM, and EGSJ organized a sample collection and data preparation. RLPM performs data analysis and interpretation. RLPM, RQS, and EGSJ prepared drafts of the article. EGSJ, RQS, ISL, and MCE critically reviewed the comprehensive content. All authors read and approved the final manuscript.
Competing interests
The authors declare that they have no competing interests.
Publisher’s Note
Springer Nature remains neutral with regard to jurisdictional claims in published maps and institutional affiliations.
Author details
1Cidade Universitária (UFPB), s/n - Castelo Branco III, João Pessoa-PB
58051-900, Brazil.2(UEPB), R. Domitila Cabral de Castro, 38 - Universitário,
Campina Grande-PB 58429-570, Brazil.3(UFPE), Av. Prof. Moraes Rego, 1235
-Cidade Universitária, Recife-PE 50670-901, Brazil.4R. Aprígio Veloso, 882
Received: 26 July 2017 Accepted: 10 January 2018
References
Andrade, T. F. (2014).Refinamento Psicométrico da Escala de Atitudes para o Perdão ( EFI ). João Pessoa: Universidade Federal da Paraíba. Andrich, D. (1978). A rating formulation for ordered response categories.
Psychometrika,37, 561–573.
Baker, F. B. (2001). The basics of item response theory (2a ed). Washington, DC: Eric Clearinghouse on Assessment and Evaluation.
Baker, F. B., & Kim, S. H. (2017).The basics of item response theory using R. Madison, WI, USA: Springer Nature.
Brucki, S. M. D., Nitrini, R., Caramelli, P., Bertolucci, P. H. F., & Okamoto, I. H. (2003). Sugestões para o uso do Mini-Exame do Estado Mental no Brasil.Arquivos de Neuropsiquiatria,61, 777–781.
Caballero, F. F., Miret, M., Power, M., Chatterji, S., Tobiasz-Adamczyk, B., Koskinen, S.,…Ayuso-Mateos, J. L. (2013). Validation of an instrument to evaluate
quality of life in the aging population: WHOQOL-AGE.Health and Quality of Life Outcomes,23(11), 177–190 https://doi.org/10.1186/1477-7525-11-177.
Cavalcanti, T. M., Melo, R. L. P., Medeiros, E. D., Oliveira, L. S., & Gouveia, V. V. (2016). Escala de Avaliação da Fadiga : funcionamento diferencial dos,15(1), 105–113 https://doi.org/10.15689/ap.2016.1501.11.
Chachamovich, E., Fleck, M. P., Clarissa, T., & Power, M. (2008). Brazilian WHOQOL-OLD module version: A Rasch analysis of a new instrument.Revista de Saúde Pública,42(2), 308–316 https://doi.org/10.1590/S0034-89102008000200017.
Conrad, I., Matschinger, H., Riedel-Heller, S., von Gottberg, C., & Kilian, R. (2014). The psychometric properties of the German version of the WHOQOL-OLD in the German population aged 60 and older.Health and Quality of Life Outcomes,5(12), 105–120 https://doi.org/10.1186/s12955-014-0105-4.
Drasgow, F., Levine, M. V., Tsien, S., Williams, B., & Mead, A. (1995). Fitting polytomous item response theory models to multiple-choice tests.Applied Psychological Measurement,19, 143–165.
Embretson, S. E., & Reise, S. P. (2000).Item response theory for psychologists. Mahwah, NJ: Lawrence Earlbaum.
Fang, J., Fleck, M. P., Green, A., McVilly, K., Hao, Y., Tan, W.,…Power, M. (2011).
The response scale for the intellectual disability module of the WHOQOL: 5-point or 3-5-point?Journal of Intellectual Disability Research,55(6), 537–549
https://doi.org/10.1111/j.1365-2788.2011.01401.x.
Fernandes, E. S. O., & Santos, A. A. A. (2015). Testes de Atenção para Idosos: Relações com Idade, Escolaridade e Moradia. Psico - Porto Alegre, 45(1), 110–
119.
Fernandes, J. S. G., & Andrade, M. S. (2016). Representações sociais de idosos sobre velhice. Arquivos Brasileiros de Psicologia, 68(2), 48–59.
Fleck, M. P., Chachamovich, E., & Trentini, C. (2006). Development and validation of the Portuguese version of the WHOQOL-OLD module Desenvolvimento e validação da versão em Português do módulo.Revista de Saúde Pública,
40(5), 785–791.
Fleck, M. P., Chachamovich, E., & Trentini, C. M. (2003). WHOQOL-OLD project: Method and focus group results in Brazil.Revista de Saúde Pública,37(6), 793–799 https://doi.org/10.1590/S0034-89102003000600016
Folstein, M., Folstein, S., & McHugh, P. (1975). Mini-mental state. A practical method for grading the cognitive status of patients for the clinician.Journal of Psychiatric Research,12, 189–198.
Gordia, A. P., Quadros, T. M. B., Oliveira, M. T. C., & Campos, W. (2011). Qualidade de vida: contexto histórico, definição, avaliação e fatores associados.Revista Brasileira de Qualidade de Vida,3(1), 40–52 https://doi.org/10.3895/S2175-08582011000100005.
Jöreskog, K. G., & Sörbom, D. (1999). PRELIS2: User’s reference guide (3oed).
Chicago: Scientific Software International.
Jr Finch, W. H., & French, B. F. (2015).Latent Variable modeling with R (first). New York and London: Routledge.
Leão, I. S. (2012).Estudo das propriedades psicométricas da escala WHOQOL-Old em idosos da região nordeste. Igarss 2014. Natal: Universidade Federal no Rio Grande do Norte.
Liu, R., Wu, S., Hao, Y., Gu, J., Fang, J., Cai, N., & Zhang, J. (2013). The Chinese version of the world health organization quality of life instrument-older adults module (WHOQOL-OLD): Psychometric evaluation.Health and Quality of Life Outcomes,16(11), 156 https://doi.org/10.1186/1477-7525-11-156. Lucas-Carrasco, R., Laidlaw, K., & Power, M. J. (2011). Suitability of the
WHOQOL-BREF and WHOQOL-OLD for Spanish older adults.Aging & Mental Health,
1(15), 595–604 https://doi.org/10.1080/13607863.2010.548054.
Marôco, J. (2014). Análise de equações estruturais: fundamentos teóricos, software e aplicações (2aedição). Pêro Pinheiro: Reportnumber.
Matos, A. I. P., Mourão, I., & Coelho, E. (2016). Interação entre a idade, escolaridade, tempo de institucionalização e exercício físico na função cognitiva e depressão em idosos. Motricidade, 12(2), 38–47.
Melo, N. C. V., Ferreira, M. A. M., & Texeira, K. M. D. (2014). Condições de vida dos idosos no Brasil: uma análise a partir da renda e nível de escolaridade.Revista Brasileira de Economia Doméstica,25(1), 4–19.
Melo, R. L. P., Eulalio, M. C., Gouveia, V. V., & Silva, H. D. M. (2013). O Efeito do Estresse na Qualidade de Vida de Idosos: O Papel Moderador do Sentido de Vida. Psicologia: Reflexão E Crítica, 26(2), 222–230. https://doi.org/10.1590/
S0102-79722013000200002.
Menezes, T. M. O., & Lopes, R. L. M. (2014). Significados do vivido pela pessoa idosa longeva no processo de morte/morrer e luto. Revista Ciência & Saúde Coletiva, 19(8), 3309–3316.
Mokken, R. J., & Lewis, C. (1982). A nonparametric approach to the analysis of dichotomous item responses.Applied Psychological Measurement,
6(1), 417–430.
Rizopoulos, D. (2006). Ltm: An R package for latent variable modeling and item response theory analyses.Journal of Statistical Software,17(5), 1–25. Rosseel, Y. (2012). Lavaan: An R package for structural equation. Retrieved from
https://www.jstatsoft.org/article/view/v048i02.
Samejima, F. (1969).Estimation of latent ability using a response pattern of graded scores (psychometric monograph no. 17). Richmond, VA: Psychometric Society Retrieved from https://www.psychometricsociety.org/sites/default/files/pdf/ MN17.pdf.
Satorra, A., & Bentler, P. M. (1994). Corrections to test statistics and standard errors in covariance structure analysis. In V. Eye, & C. C. Clogg (Eds.),Latent variables analysis: Applications for developmental research, (pp. 399–419). Thousand
Oaks: Sage.
Teixeira, J. S. (2013). Qualidade de vida, saúde e bem-estar: representações sociais de idosos de um centro de convivência na cidade de Juiz de Fora–MG. Universidade Federal de Juiz de Fora.
Tezza, R., Bornia, A. C., & Andrade, D. F. D. (2011). Measuring web usability using item response theory: Principles, features and opportunities.Interacting with Computers,23(2), 167–175.
Van der Ark, L. A. (2007). Mokken scale analysis in R.Journal of Statistical Software,
20(1), 1–19.
Vilar, M. M. P. (2015). Avaliação da qualidade de vida em adultos idosos: estudos de adaptação, validação e normalização do whoqol-old para a população portuguesa. Universidade de Coimbra.
WHOQOL Group (1995). The World Health Organization quality of life assessment (WHOQOL): Position paper from the World Health Organisation.Social Science Medicine,41, 1403–1409.