Ciência Téc. Vitiv. 33(2) 145-166. 2018
145
This is an Open Access article distributed under the terms of the Creative Commons Attribution License
(http://creativecommons.org/licenses/by/4.0), which permits unrestricted use, distribution, and reproduction in any medium, provided the original work is properly cited.
EFFECT OF THE HARVEST SEASON ON PHENOLIC COMPOSITION AND
OENOLOGICAL PARAMETERS OF GRAPES AND WINES CV. ‘TOURIGA NACIONAL’
(Vitis vinifera L.) PRODUCED UNDER TROPICAL SEMI-ARID CLIMATE, IN THE STATE
OF PERNAMBUCO, BRAZIL
EFEITO DA ÉPOCA DE COLHEITA NA COMPOSIÇÃO FENÓLICA E PARÂMETROS ENOLÓGICOS DE UVAS E VINHOS CV. ‘TOURIGA NACIONAL’ (Vitis vinifera L.) PRODUZIDOS SOB CLIMA TROPICAL
SEMIÁRIDO, NO ESTADO DE PERNAMBUCO, BRASIL
Juliane Barreto de Oliveira1,4*, Diana Lemos Faria1, Daniel Fernandes Duarte1, Ricardo Egipto1,2, Olga Laureano1,
Rogério de Castro1, Giuliano Elias Pereira3, Jorge Manuel Ricardo-da-Silva1
1 LEAF - Linking Landscape, Environment, Agriculture and Food. Instituto Superior de Agronomia, Universidade de Lisboa, Tapada da Ajuda, 1349-017
Lisboa, Portugal.
2 INIAV, I.P., Pólo de Dois Portos, Quinta da Almoínha, 2565-191 Dois Portos, Portugal.
3 Embrapa Uva e Vinho/Semiárido, BR-428, Km 152, s/n - Zona Rural, Petrolina - PE, 56302-970, Brasil. 4 PhD student in Food Engineering.
* Corresponding author: Tel.: +351 213652102, email: [email protected]
(Received 23.07.2018. Accepted 29.10.2018)
SUMMARY
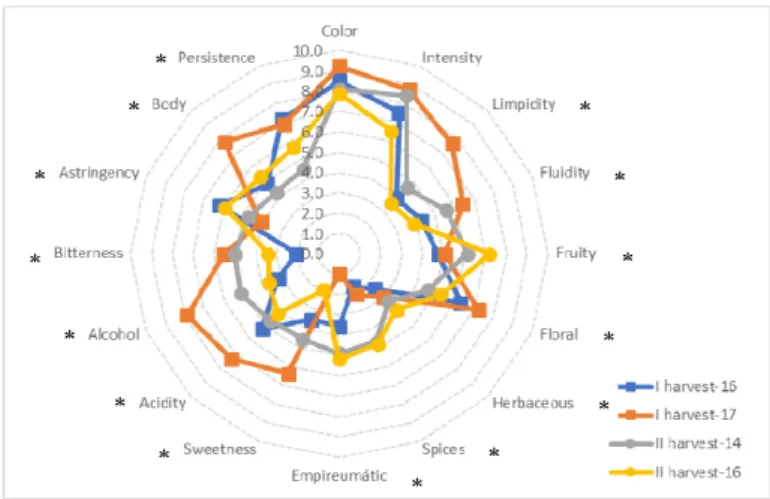
The northeastern region of São Francisco Valley is the third largest wine producer in Brazil, differentiated by the production of at least two harvests per year, generally in the first and second semesters, respectively. The productive cycle of the vine in the first semester is higher than in the second semester, mainly due to differences in temperature, with maximum and average temperatures of approximately 30 ºC and 26 ºC, respectively. Second semester is characterized by higher temperatures (summer season) and that promote a rapid maturation of the grapes. The objective of this work was to evaluate the phenolic composition, other oenological parameters and the sensorial profile of grapes and wines of cv. 'Touriga Nacional' (Vitis vinifera L.), characterizing grapes and wines from four harvest seasons, two of them referring to the first half of the year and two referring to the second half of the year, using a broad analytical approach. The experimental design consisted of three randomized blocks, with sixty plants marked in different lines and positions (twenty plants in each block at the beginning, middle and end of the vineyard). The results showed that there was a harvesting effect for some of the grape chemical compounds (monomeric anthocyanins, organic acids, condensed tannins and monomeric flavanols, for example) as well as in wines (calcium, monomeric anthocyanins, condensed tannins and monomeric flavanols). Regarding the sensorial profile of the wines, it was possible to observe that higher scores were attributed to floral aroma in wines from the first harvest (first half of the year). Fruity, spice and empyreumatic aromas were higher in wines from second harvest season (second half of the year). For other attributes, there was a tendency for higher variations between the period of study (2014 – 2017) than between the harvest seasons.
RESUMO
A região Nordeste do Vale do São Francisco é a terceira maior produtora de vinho do Brasil, diferenciada pela produção de pelo menos duas vindimas por ano, geralmente no primeiro e segundo semestres, respetivamente. O ciclo produtivo da videira no primeiro semestre é maior do que no segundo semestre, principalmente devido as diferenças de temperaturas, com temperaturas máxima e média de aproximadamente 30 ºC e 26 ºC, respetivamente. O segundo semestre é caracterizado por temperaturas mais altas (época de verão) que promovem uma rápida maturação da uva. O objetivo deste trabalho foi avaliar a composição fenólica, outros parâmetros enológicos e o perfil sensorial de uvas e vinhos da cv. ‘Touriga Nacional’ (Vitis vinifera L.), caracterizando uvas e vinhos de quatro épocas de colheitas, sendo duas referentes ao primeiro semestre e duas referentes ao segundo semestre do ano, utilizando para isso uma ampla abordagem analítica. O delineamento experimental consistiu em três blocos casualizados, com sessenta plantas marcadas em diferentes linhas e posições (vinte plantas em cada bloco, no início, meio e fim da vinha). Os resultados mostraram que houve um efeito da época de colheita para alguns dos compostos da uva (antocianinas monoméricas, ácidos orgânicos, taninos condensados e flavanóis monoméricos, por exemplo) e nos vinhos (cálcio, antocianinas monoméricas, taninos condensados e flavanóis monoméricos). Em relação ao perfil sensorial dos vinhos, foi possível observar que maiores pontuações foram atribuídas ao aroma floral nos vinhos da primeira vindima (primeiro semestre do ano). Aromas frutados, de especiarias e empireumáticos foram maiores nos vinhos da segunda época de colheita (segundo semestre do ano). Para os demais atributos, houve uma tendência para maiores variações entre os anos de estudo do que entre as vindimas.
Key words: phenolic compounds, red wines, sensory profile, Touriga Nacional, tropical semi-arid grape. Palavras-chave: compostos fenólicos, vinhos tintos, perfil sensorial, Touriga Nacional, uva tropical semiárida.
146
INTRODUCTION
Tropical viticulture is typical from regions where minimum temperatures are not low enough to induce the vine to dormancy. The vine grows continuously and with the use of appropriate technology is possible to obtain two or more harvests per year in the same vineyard. The harvest season can be scheduled for any day of the year. The main poles of tropical viticulture in Brazil are Submédio São Francisco Valley, northwest Paulista and north of Minas Gerais (mainly for table grapes). In recent years, tropical viticulture has expanded in several other States, such as Espírito Santo, Mato Grosso do Sul, Mato Grosso, Goiás, Rondônia, Ceará and Piauí (Camargo et al., 2011).
The term “Terroir” is diverse and involve several factors that influence the composition of the grapes and consequently of the wines from a specific region. According to some authors, the environmental characteristics (climate and soil conditions) and cultural practices applied in the vineyards are important examples of these factors (Downey et al., 2006; Gamboa et al., 2017, Gutiérrez-Gamboa and Moreno-Simunovic, 2018).
Submédio São Francisco Valley, situated between the States of Bahia and Pernambuco, is recognized as the third region for the production of fine wines, after Serra Gaúcha and Campanha Gaúcha in the State of Rio Grande do Sul. This “Terroir” is located in places 350 m high, in average, where is present flat productive areas. Those have typical landscape of northeastern sertão, with an annual temperature of 26 ºC in average and intra-annual variability. This region has a tropical semi-arid climate that allows the production of grapes in non-conventional periods of the year, such as the winter, in even three harvests. The sun incidence and high temperatures, associated with irrigation that must be done allow these special conditions, making this region unique in the world (Pereira et al., 2008, Pereira et al., 2011).
Vitis vinifera L. cv. ‘Touriga Nacional’ is an
important Portuguese autochthon red grape variety (Böhm, 2007). It is adapted to all types of soils although it requires high temperatures and sunshine. In addition, it behaves well in most part of the rootstocks, as long as they have a fertile soil and availability of water (IVV, 2017). This variety has presented good adaptation in the edaphoclimatic conditions of São Francisco Submédio Valley, being one of the most used to produce monovarietal wines, as well as added in blends with other grape varieties.
Some studies were carried out in this region to evaluate the phenolic composition of grapes and wines at different harvest seasons. Santos et al. (2007) evaluated the oenological potential of the cultivars ‘Alfrocheiro’, ‘Deckrot’ and ‘Tempranillo’ in two different seasons of the year. Their studies concluded that there were significant differences on the oenological potential between different varieties when harvested in different seasons. In addition, Rosatti et al. (2013) have studied the maturation of ‘Barbera’ grapes from organic production in two productive cycles. These authors have concluded that this variety presents some variance in between cycles along the year. This grapes variety presented duration of the first productive cycle (first half of the year) between 82 up to 92 days after fruiting and the second productive cycle (second semester) between 47 up to 57 days after fruiting. Second cycle has shown higher concentrations of bioactive compounds. Oliveira et al. (2014) have analysed the influence of grape maturation stage on the physicochemical composition and antioxidant activity of the ‘Syrah’ wine manufactured in the harvest of the second productive cycle of the year. The results of their studies have demonstrated that on the second cycle of production the total anthocyanins, total phenols and antioxidant activity has increased in wines made from grapes harvested between 120 and 128 days after pruning. Lima and Leão (2015) studied the content of phenolic compounds and antioxidant potential of ‘Syrah’ grapes under the influence of leaf removal and trimming during productive cycle on the first semester. They concluded that ‘Syrah’ grapes from semi-arid tropical conditions submitted to the treatment described presented higher concentrations of total anthocyanins and antioxidant activity. Lima et
al. (2015) evaluated the main physical and chemical
characteristics of ‘Syrah’ grapes harvested on tropical semi-arid region of São Francisco Valley, at different times and their relationship with analytical characteristics of resulting wines. They have concluded that ‘Syrah’ grapes harvested between 126 and 133 days after pruning in the first harvest season presented better oenological potential for the manufacture of red wine.
Due to the lack of information on grape and wine chemical composition from cv. ‘Touriga Nacional’, produced in tropical semi-arid region of São Francisco Valley at different harvest seasons, the aim of this work was to characterize the phenolic composition and other oenologic parameters of grapes and wines, as well as their sensorial profile in four harvest seasons, using a broad analytical approach.
147
MATERIAL AND METHODS Description of vineyard area and their harvests
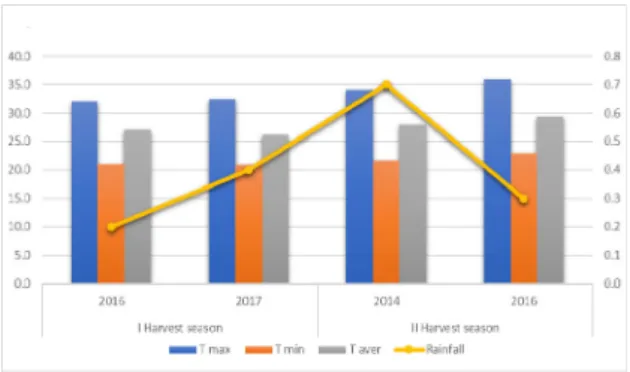
The area of study is located in the municipality of Lagoa Grande, State of Pernambuco, between latitude parallels 8-9º in the Southern Hemisphere and with an altitude of 350 m. The soil is classified as red-yellow Argissolo, usually with medium natural fertility. The region's climate is characterized in first semester of the year as very warm, with warm nights and moderate drought. In second semester, the temperature is very high, inclusive during the night and severe drought (Tonietto et al., 2012) and natural climatic conditions can change the class of wine according with period of the year during which the grapes are being produced. It has been collected climatic data according with the period of this study and the results are presented in Figure 1.
Figure 1. Meteorological data relative to the harvest seasons and years of study, in the state of Pernambuco, tropical semi-arid region
of Brazil.
Dados meteorológicos relativos às épocas de colheita e anos de estudos, no estado de Pernambuco, em região tropical semiárida
do Brasil.
The vineyard was conducted in a single wire trellis system, being the planting density of 3.333 vines/ha (3 m between rows and 1 m in each row). The orientation of these lines was North-South. Irrigation system utilized was by drip irrigation. The variety used in the study was ‘Touriga Nacional’ (Vitis
vinifera L.). The vines were grafted onto 1103
Paulsen rootstock. Plants had 11 years old and due to the conditions of the region it was possible to harvest grapes twice a year (first and second semesters). The experimental design was a randomized three blocks, where sixty plants were marked in different lines and positions (twenty plants in each block, at the beginning, middle and end of the vineyard).
The first harvest season was made in December 2014 (corresponding of second harvest of 2014), the second in July 2016 (first harvest of the year), the third in
January 2016 and the fourth in July 2017. The decision of the harvest point was defined by the winery. In each harvest, approximately forty kilos of grapes has been collected manually and stored at low temperature (0 °C) during 24 hours until vinification.
Methods used to extract compounds from the grapes
The grapes were randomly selected for analysis in different plants and parts of the bunch (beginning, middle, end, interior and exterior), following two methodologies of extraction of the phenolic compounds.
The first one is proposed by Carbonneau and Champagnol (1993). The extract was obtained from the maceration of skins and seeds, during 24 hours at 20 ºC, using as solvents ethanol (96%) and tartaric acid solution at pH 3.2. Then, the extract was centrifuged at 3500 rpm for 10 to 15 minutes, before being used.
In the second extraction method, skins, pulps and seeds were separated, weighed and the phenolic compounds extracted in each part according to the method described by Bourzeix et al. (1986) using solvents of different polarities (methanol, water and acetone) and with different contact times for successive macerations. The first extraction takes place at -24 ° C overnight (using methanol), then further macerations were carried out under a nitrogen atmosphere, according to the following procedure: 4 h at room temperature, with a solution of methanol and water (80:20 v/v); 4 h at room temperature, with a solution of methanol and water (50:50 v/v); 15 h at - 24 °C with distilled water; 1h at room temperature, with a solution of acetone and water (75:25 v/v). At each extraction the obtained liquid must was collected and stored (4 ºC) under nitrogen atmosphere.
Routine and spectrophotometric analytical
methods applied to grapes analysis
Technological parameters
The technological parameters were obtained from the pulp: pH, total soluble solids, total acidity, as well as tartaric acid and malic acid. These parameters were evaluated according to the methodologies described by the International Organization of Vine and Wines (OIV, 2014).
Spectrophotometric analyses
The analyses were performed using the extracts of the skins and seeds, in order to determine total phenols (Ribéreau-Gayon, 1970), non-flavonoid and flavonoid phenols (Kramling and Singleton, 1969), total anthocyanins (Ribéreau-Gayon and Stonestreet, °
148 1965), color intensity and tonality (OIV, 2014). Tanning power (De Freitas and Mateus, 2001) was also evaluated using a turbidimeter. With the individual extracts of the skins, pulps and seeds of the berries, the fractionation of flavanols as a function of their molecular weight (Sun et al., 1998a,b) has been analysed.
Vinification of monovarietal wines
After the harvest of grapes at Santa Maria farm (Global Wines), experimental wines were made at Embrapa Semi-Arid Oenology Laboratory (Petrolina, Brazil). The microvinification process was performed with a composite sample of forty kilograms per each harvest season.
Wine made has followed the traditional vinification for red wines: after harvest, the grapes were kept in a cold chamber (0-5 °C) until vinification. Then the grapes were removed from the stalks with semi-automatic equipment (Model DH150-DA, Recifer-Brazil). To induce the alcoholic fermentation, 50 mg/L of sulfur dioxide and 20 g/hL of yeast (Saccharomyces cerevisiae, bayanus variety, Everintec, Italy) were added. At this stage, the temperature was between 22 ºC and 25 ºC. The “remontage” was performed once a day with rack and return modality. The maceration time and the contact of the solid parts with the liquid was uniform in all treatments with made during 7 days (with the objective of maintain the homogeneity of the phenolic compounds extraction). The end of the alcoholic fermentation was identified through the stability of the density and analysis of alcohol content. Malolactic fermentation was performed without addition of bacteria, and has been done only with native species. For this fermentation, temperature has varied between 16 ºC up to 18 ºC. The ending point has been identified through chromatography paper (OIV, 2014). The tartaric stabilization in cold (0-5 °C) has happened during 30 days. Then, the amount of sulfur dioxide has been corrected. Wines were bottled in green bottles and the head space was replaced with nitrogen before closing.
Wines physicochemical characterization
The wines were analyzed six months after the end of the tartaric stabilization. The following parameters have been analysed: alcohol content, residual sugar, free and total sulfur dioxide, volatile and total acidity, pH, dry extract, and minerals (potassium and calcium) following the methodologies proposed by International Organization of Vine and Wine (OIV, 2014).
The colorimetric parameters determined in this study were: total anthocyanins (Ribéreau-Gayon and Stonestreet, 1965); colored anthocyanin(Somers and Evans, 1977); total phenols (Ribéreau-Gayon, 1970); flavonoid and non-flavonoid phenols (Kramling and Singleton, 1969); color due to copigmentation (Boulton, 2001); color intensity and tonality (OIV, 2014); total and polymeric pigments (Somers, 1971; Somers and Evans, 1977) and tanning power (De Freitas and Mateus, 2001). These parameters have been determined according with methods proposed and described in the literature.
Separation and quantification of individual monomeric anthocyanins by HPLC
The identification and quantification of individual monomeric anthocyanins was carried out using HPLC equipment (Perkin-Elmer, USA), consisting of pump (Series 200) and detector (LC95 Uv/Visible), with a column C18 (250 mm x 4 mm) of reverse phase with 5µm of compaction, protected by a pre-column consisting of the same material, both from LichroCart (Merck, Germany). The solvents consisted of: A (40% formic acid and 60% bidistilled water), B (acetonitrile p.a.) and C (bidistilled water). Methanol/water (50:50 v/v) was used to wash the column after the analyses.
The initial conditions used in HPLC were the following: 25% A, 6% B and 69% C for 15 minutes, followed by a 25% linear gradient of A, 25.5% B and 49.5% C for 70 minutes. The finish has happened after 20 minutes with the addition of 25% A, 25.5% B and 49.5% C. The flow was 0.7 mL/min, and detection has been made at 520 nm. Both samples and the solvents were filtered under the same conditions. The volume injected was 20 μl (samples extract have been previously separated from the grapes or wine, following by filtration). The analyses have been performed in triplicate. The column temperature was 30 °C, controlled by a column oven. Fourteen individual anthocyanin molecules have been separated and quantified. Identification has followed the method described by Roggero et. al. (1986) and quantification was done based on a standard curve obtained with malvidin 3-O-glucoside (R2=0.981). Grape and wine extracts have been analysed in triplicate.
Fractionation of low molecular weight flavanols on a polyamide column chromatography and further quantification by HPLC
Five milliliters of individual extracts (skins and seeds samples) and wineswere fractionated on a polyamide column (Macherey-Nagel, Germany) as described by Ricardo-da-Silva et al. (1990). Phenolic acids were
149 first eluted with 80 mL of phosphate buffer, pH 7.0. The monomeric flavanols were eluted with 50 mL of ethyl acetate/water (30:70 v/v) and oligomeric procyanidins with 50 mL of acetone/water (75:25 v/v). The fractions were brought to dryness, dissolved in 1.2 mL of methanol/water (50:50 v/v), filtered through a 0.45 μm membrane (Whatman, USA) and finally injected onto the HPLC column. Following the procedure described above a new polyamide column was used for each sample.
The equipment used for HPLC analysis consisted of a UV-Vis detector (Waters 2487) and a L-7100 pump (Waters, USA). The separation was performed on a Lichrosphere C18 reverse phase column (Merck, Germany) 250 mm x 4.6 mm x 5 μm, at room temperature. For monomeric flavan-3-ols, the gradient consisting of solvent A (water/acetic acid, 97.5:2.5 v/v) and solvent B (acetonitrile / solvent A, 80:20 v/v) was used. The elution was performed at a flow rate of 0.9 mL/minas follows: 7-25% B linear from 0 to 31 minutes, followed by washing (methanol/water, 50:50 v/v) 32-50 min and the rebalancing of the column from 51 to 65 min under initial gradient conditions. For oligomeric procyanidins, the solvents A (bidistilled water) and B (bidistilled water/acetic acid, 90:10 v/v) were used. The elution was performed at a flow rate of 1.0 mL/min as follows: 10-70% linear B 0-45 min, 70-90% linear B 45-70 min, 70-90% B isocratic 70-82 min, 90-100% linear B 82-85 min, 100% B isocratic 85-90 minutes, followed by washing (methanol/water, 50:50 v/v) 91-100 min, and rebalancing the column from 101 to 120 min under initial conditions of the gradient. Detection was performed at 280 nm. The following flavanol molecules have been quantified: (+)-catechin; (-)-epicatechin; (-)-epicatechin 3-O-gallate; procyanidin dimers B1 [(-)-epicatechin-(4β→8)-(+)-catechin], B2 [(-)-epicatechin-(4β→8)-(-)-epicatechin], B3 (4α→8)-(+)-catechin], B4 [(+)-catechin-(4α→8)-(-)-epicatechin], B1-3-O-gallate [(-)-epicatechin-3-O-gallate-(4β→8)-(+)-catechin],
B2-3-O-gallate [(-)-epicatechin (4β→8)-(-)-epicatechin],
B2-3’-O-gallate (4β→8)-(-)-epicatechin-3-O-gallate], trimer C1 [(-)-epicatechin-(4β→8)-(-)-epicatechin-(4β→8)-(-)-epicatechin)] and trimer 2 (T2) [(-)-epicatechin-(4β→8)-(-)-epicatechin-(4β→8)-(+)-catechin] (Ricardo-da-Silva
et al., 1990; Ricardo-da-Silva et al., 1991; Rigaud et al., 1991) . The identification of the chemical
compounds was done according with studies of Rigaud et al. (1991) and Ricardo-da-Silva et al. (1991) and later confirmed by Monagas et al. (2003). The quantification of monomeric flavan-3-ol and small oligomeric procyanidins (some dimers and
trimers) were based on standard curves obtained with (+)-catechin and (-)-epicatechin (R2=0.999) for the monomers and dimer B2 for the other compounds (R2=0.997).
Isolation of flavanols in skins and seeds on a fractogel chromatographic column and further degradation by acid catalyzed depolymerization in the presence of toluene-α-thiol, following by HPLC analysis
In a glass column of QuickFit CR 12/10 of (100 mm x 10 mm) filled with fractogel TSK HW-40F (Toyopearl®, Japan) 5 mL of skin or seed extracts has passed with a flow rate of 0.7 mL/min, maintained by a vacuum pump (Vacuubrand, Germany) model MZ2C.
A mixture of ethanol/water/trifluoroacetic acid (TFA) with concentrations of (55:45:0.05 v/v/v) was used to conditioned the column before incorporating the 5 mL extract, the volume of 30 mL was added. After the passage of the sample, 30 mL of the solvent containing TFA was added, which allowed the elution of single and monomeric flavonoids (phenolic acids, anthocyanins, flavonols, stilbenes and catechins) and polymeric in increasing order of their degree of polymerization.
The column was washed with 30 mL of acetone: water (60:40 v/v) to collect the polymeric flavonoids that were still attached to the gel. The latter fraction was evaporated to dryness, diluted in 1 mL of methanol to the seed samples and 0.5 mL to samples of skins, and then stored at -20 °C. The preparation of the fractogel column and isolation of flavanols was performed following the method described by Labarbe et al. (1999).
Acid-catalyzed degradation in the presence of toluene-α-thiol was performed under the conditions described by Kennedy et al. (2000) and Monagas et
al. (2003) but with some modifications. A 100 µL
portion of the sample was placed in a 1.0 mL screw-cap vial and mixed with 100 µL of toluene-R-thiol (5% for seed samples and 12% for skin) in methanol containing HCl (0.2 M). The mixture was placed in a 55 °C water bath for 10 min. The thiolyzed sample was cooled under running water and immediately analyzed by reversed HPLC phase. The equipment used in the analysis was a liquid chromatography with a Merck Hitachi L-7100 pump and Waters 2487 detector. Separation was performed on a reversed-phase Gemini C18 110A (150 mm x 3 mm x 5 μm) at room temperature. A binary gradient consisting of solvent A (water/formic acid 98:2 v/v) and solvent B (acetonitrile/water/formic acid, 80:18:2 v/v/v) was applied at a flow rate of 1.0 mL/min as follows: 0 to
150 15 minutes with 10 % solution A e 90% solution B, followed by washing (solvent B) and reequilibration of the column. The detection was performed at 280 nm.
The calculation of the mean degree of polymerization (mDP), percentage of galloylation (%g) and percentage of prodelphinidins (%p), was based on the peak areas (kW) of the terminal units and extensions after HPLC analysis. The identification of the peaks was based on the work performed by Monagas et al. (2003).
Separation of proanthocyanidins in Sep-Pak C18 cartridges and quantification of the obtained fractions by the vanillin assay
In this method, extracts of skins, pulps, seeds and wine samples were used. The separation of flavanols was performed using a Sep-Pak C18 cartridge (Waters, USA) according to their degree of polymerization in three fractions: monomeric (using ethyl ether as solvent), oligomeric (extracted with methanol) and polymeric fractions (extracted with methanol), following the method described by Sun et
al. (1998a).
The flavanol content of each fraction was determined using the vanillin assay according to the method described by Sun et al. (1998b). The quantification was performed by means of standard curves prepared from flavanol monomers, oligomers and polymers of grape seed isolates as described by Sun et al. (1998a,b) and Sun et al. (2001). Extractions on the C18 cartridge and the further measurements after reaction with vanillin were performed in triplicate.
Characterization of the sensory profile of wines
The sensory evaluation was conducted by a panel of twelve experienced tasters, in Instituto Superior de Agronomia – Lisbon University, Portugal. The panel consisted of seven men and five women with age between twenty-five and forty-five years old. The evaluation of the visual, olfactory and taste characteristics of the wines were carried out with Quantitative Descriptive Analysis (QDA), with 16 attributes: 4 visual sensations (color, color intensity, limpidity and fluidity), five aromatic attributes (fruity, floral, herbaceous, spices and empireumatic) and seven taste attributes (sweetness, acidity, alcohol, bitterness, astringency, body and persistence). The quantification was made by a scale with an unstructured intensity of 10 points, with minimum anchorage on the left and maximum on the right. Each taster evaluated between one or two samples per session, with three sections: one sample in the first
semester of 2015 (wines from 2014 harvest), another in the second semester of 2016 (wines from 2016 harvest – two samples) and in the second semester of 2017 (wines from the first 2017 harvest – one sample). The test room was composed by individual, white and illuminated booths. The samples were served individually, coded in tasting glasses (ISO), each containing 50 mL of wine, with a temperature of 18 ± 2 ºC, range considered ideal for red wines tasting.
Statistical analysis
All the chemical analyses performed in this study were made in triplicate and sensory analysis was made by a panel composed by twelve tasters. To verify the differences between the samples, based on four harvest seasons, an analysis of variance (One-way ANOVA) has been performed. To test the differences between each level of treatment, a multiple mean comparison test (HSD Tukey) has been done. The confidence level utilized in the statistical analysis was 95%, which means max admissible for error type I was 5%. Both analyzes were performed using STATISTIX 9.0 software (Florida, USA).
RESULTS AND DISCUSSION Grapes - Chemical composition
Classic analysis and organic acids in grapes
The results of classic parameters and organic acids are presented in Table I. It is possible to observe that there was significant effect of the harvest season for pH and ºBrix. pH varied from 3.7 to 3.8 and from 3.8 to 4.0 in the grapes harvested in the first and second semester, respectively. It is possible to verify high pH values in ‘Touriga Nacional’ grapes on both harvest seasons, a fact that may be related to the high potassium content found in soils in this region (Soares and Leão, 2009), which reflect the formation of acid salts at the expense of free acids.
In the same Table is possible to detect that was an influence of the harvest season on total acidity, for grapes harvested in the first semester of the year. These contained higher concentrations of tartaric acid: 5.3 g/L on I harvest - year 2016 and 6.7 g/L on I harvest - year 2017. The high concentrations of total acidity in the harvests may be due to a characteristic of the cultivar, according to Böhm (2007) and Brites and Pedroso (2000). They have reported that the ‘Touriga Nacional’ variety has high total acidity, with values ranging from 4.5 - 6.0 g/L of tartaric acid,
151 based on studies of traditional regions. Another factor that may influence higher total acidity during the first harvest season is the lower degradation of organic acids in this period, due to lower diurnal temperatures and higher thermal amplitude when compared to the second harvest season (Figure 1).
Organic acids were also influenced by the harvest season, with the highest concentrations in grapes
harvested in the first semester of the year. The highest content of tartaric acid was 4.6 g/kg (I harvest in 2017) and malic acid 3.2 g/kg (I harvest in 2017). In a review on biochemistry of organic acids found in grapes, Ford (2012) has reported that tartaric acid was not affected by temperature, but malic acid has the opposite behavior.
TABLE I
Classical parameters, organic acids, color, global phenolic compounds and monomeric anthocyanins in ‘Touriga Nacional’ grapes, cultivated in tropical semi-arid region, in Brazilian Northeast
Parâmetros clássicos, ácidos orgânicos, cor, compostos fenólicos globais e antocianinas monoméricas em uvas ‘Touriga Nacional’, cultivadas em região tropical semiárida, no Nordeste brasileiro
Means within the same row followed by different letters are significantly different according to the Tukey test (p˂ 0.05); * significant differences at 95% confidence level; ** significant differences at 99.9% confidence level; *** significant differences at 99.99% confidence level; I Harvest - first semester, years 2016 and 2017; II Harvest - second semester, years 2014 and 2016; Total acidity (g/L of tartaric acid); SST - total soluble solids; u.a. - absorbance units.
Harvest season 1
st Year-Experiment essays 2nd Year-Experiment essays ANOVA
I Harvest II Harvest I Harvest II Harvest (p-values) Classic analysis pH 3.81ab ±0.00 4.04a ±0.08 3.75b ±0.00 3.81ab ±0.00 ** Total acidity (g/L) 5.3b ±0.0 4.0c ±0.1 6.7a ±0.0 4.9b ±0.1 *** SST (°Brix) 19.7c ±0.1 21.2ab ±0.1 22.0a±0.1 20.6b±0.0 ** Organic acids (g/kg) Tartaric acid 3.1c ±0.0 2.4d ±0.1 4.6ª ±0.1 3.8b ±0.1 *** Malic acid 2.4b ±0.0 1.5c ±0.0 3.2a ±0.2 3.0a ±0.2 **
Color and phenolic compounds
Total phenols (mg/kg) 600.7d ±4.0 713.6c ±3.9 932.7ª ±2.2 734.5b ±6.9 ***
Flavonoids (mg/kg) 322.1d ±5.5 600.9b ±5.7 751.9ª ±2.8 416.4c ±3.1 ***
Non-flavonoids (mg/kg) 169.9b ±0.9 113.4c ±2.1 181.2ª ±0.7 111.3c ±0.1 *** Total anthocyanins (mg/kg) 426.8b ±4.0 462.1a±13.6 416.9b ±0.9 353.0c ±2.1 ** Color Intensity (u.a) 6.723c ±0.034 10.347b ±0.045 16.163ª ±0.101 6.377c±0.025 ** Tonality (u.a) 0.629a ±0.005 0.604a ±0.001 0.494c ±0.002 0.576b ±0.008 * Monomeric anthocyanins (mg/g) Non-acylated Delphinidin 3-O-glucoside 23.0a ±0.5 15.1b ±0.6 15.6b ±1.5 6.0c ±0.3 ** Cyanidin 3-O-glucoside 4.1b ±0.3 2.4c±0.2 5.2a ±0.1 1.3d ±0.1 ** Peonidin 3-O-glucoside 15.3d ±0.5 22.5b ±2.3 25.0a ±0.5 18.9c ±0.9 * Petunidin 3-O-glucoside 20.7a ±0.3 8.1c ±0.5 18.8b ±0.5 4.1d ±0.0 ** Malvidin 3-O-glucoside 40.1c ±0.4 61.9b ±5.0 77.6a ±2.5 62.3b ±1.3 ** Acetylated (mg/g) Peonidin 3-O-acetylglucoside 0.8ab ±0.0 0.1d ±0.0 1.0a ±0.1 0.4c ±0.0 ** Petunidin 3-O-acetylglucoside 4.6b ±0.1 0.0d ±0.0 9.2ª ±0.7 0.8c ±0.0 ** Cyanidin 3-O-acetylglucoside 0.3c ±0.0 2.2a ±0.4 0.4c ±0.1 0.9b ±0.0 * Delphinidin 3-O-acetylglucoside 2.9b ±0.1 0.0d ±0.0 6.1ª ±0.2 0.5b ±0.0 *** Malvidin 3-O-acetylglucoside 12.2c ±0.1 13.7b ±1.0 6.9d ±0.2 14.7a ±0.4 * Coumaroylated (mg/g) Peonidin 3-O-coumarylglucoside 0.7b ±0.0 1.9a ±0.1 0.0c ±0.0 0.8b ±0.0 *** Petunidin 3-O-coumarylglucoside 0.5c ±0.0 0.8b ±0.0 1.1a ±0.1 0.3c ±0.0 ** Delphinidin 3-O-coumarylglucoside 8.1b ±0.5 8.9b ±0.4 15.5a ±0.6 5.4c ±0.1 ** Malvidin 3-O-coumarylglucoside 5.9b ±0.1 5.1c ±0.2 7.5ª ±0.3 5.8b ±0.1 *
Total monomeric anthocyanins (mg/g)
152 The low malic acid content in the second harvest semester can be related to degradation due to high minimal and average temperatures during this period in the region (Figure 1). According to some authors, warm-weather grapes tend to have a faster respiration rate with L-malic acid compared to cold regions, thus having a reduced concentration of this acid (Volschenkla et al., 2006).
Phenolic compounds and color in grapes
Concentrations of total flavonoid and non-flavonoid phenols are shown in Table I. The contents varied between years and not in the harvest season for total flavonoid phenols. The concentration of non-flavonoids remained higher in the first harvest semester, following the pattern of other organic acids present in grapes. The highest concentrations obtained in this study were the following: total phenols 932.7 mg/kg, flavonoids 751.9 mg/kg, and nonflavonoids 181.2 mg/kg.
The concentration of total anthocyanins in the grapes was influenced by the harvest season and between the years of study (Table I). The highest concentration was 462.1 mg/kg of malvidin in 2014 and was found on the harvest of the second semester, followed by 426.8 mg/kg of malvidin in the first harvest season of 2016. As reported by some authors, the accumulation of anthocyanins in the berries is influenced by temperature; the ideal range would be between 17-18 ºC (night) and 24-26 ºC during the day (Yamane and Shibayama, 2006). Temperatures above 35 ºC promote the anthocyanins degradation (Kliewer and Torres, 1972; Reynolds, 2010). Thus, higher concentrations of anthocyanins were expected for the grapes of the first harvest season than for those of the second, due to lower temperatures, but the high concentration in one of the harvests of the second semester may be related to a characteristic of the variety that promotes lesser degradation of anthocyanins during maturation. Further studies are needed to confirm this aspect. Jordão et al. (1998) showed that anthocyanins increase gradually during maturation of ‘Castelão’ variety under traditional viticulture conditions.
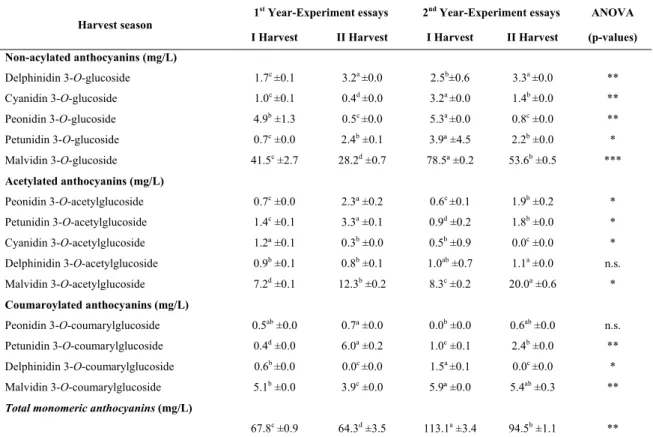
Monomeric anthocyanins in grapes
Fourteen monomeric anthocyanins (Table I) were identified and quantified, and most of them were influenced by the harvest season. Regarding the five non-acylated anthocyanins, three remained in high concentrations for grapes harvested in the first semester, in time period of this study. Those are: delphinidin, cyanidin and petunidin. The highest amounts for these anthocyanins were 23.0 mg/g, 5.2 mg/g and 20.7 mg/g, respectively. For peonidin and
malvidin, there was no trend for a particular harvest season; concentrations varied between the years of this study. The highest amounts were 25 mg/g and 77.6 mg/g for peonidin and malvidin, respectively, all in the 2017 first harvest. Table I also present non-acylated anthocyanins that are pigments with the highest concentrations within the group of monomeric anthocyanins, which was also reported in other studies (Roggero et al., 1986; Jordão et al., 1998; Mulinacci et al., 2008; Jordão and Correia, 2012). The highest concentrations of non-acylated anthocyanins may be related to lower degradation due to less minimum and average temperatures in first semester compared with semester.
In relation to acetylated anthocyanins (Table I) results indicate that there was an influence of the harvest season on the profile of these anthocyanins, except for peonidin. Anthocyanin petunidin 3-O-acetylglucoside and delphinidin 3-O-3-O-acetylglucoside were higher in the first harvest season of the year, with 9.2 mg/g and 6.1 mg/g, respectively. The cyanidin acetylglucoside and malvidin 3-O-acetylglucoside had higher concentrations in the second harvest season with 2.2 mg/g and 14.7 mg/g, respectively. The concentrations of anthocyanins esterified with acetic acid from the semi-arid region of Brazil were higher than that reported by Mateus et
al. (2001) when evaluating the skins of ‘Touriga
Nacional’ grapes in Douro region, in Portugal (300-350 m altitude), in which they have quantified values below 1 mg/g in berries.
Concentrations of coumaroylated anthocyanins are also shown in Table I. For four anthocyanins analysed in this study, it has been detected statistical differences for the harvesting effect. The highest concentrations on the first harvest season were obtained for petunidin 3-O-coumarylglucoside (1.1 mg/g), delphinidin 3-O-coumarylglucoside (15.5 mg/g) and malvidin 3-O-coumarylglucoside (5.9 mg/g). On the second harvest season, the highest concentration was reached for anthocyanin peonidin 3-O-coumarylglucoside with 1.9 mg/g.
Concerning the total concentration of monomeric anthocyanins, no tendency for higher concentrations in a specific harvest season has been detected. The highest content of total monomeric anthocyanins was 189.9 mg/g for grapes harvested in 2017 first harvest season, followed by 142.7 mg/g in 2014 second harvest season.
Condensed tannins in seeds, skins and pulps
The concentrations of monomeric, oligomeric and polymeric tannins in the seeds are presented in Table II.
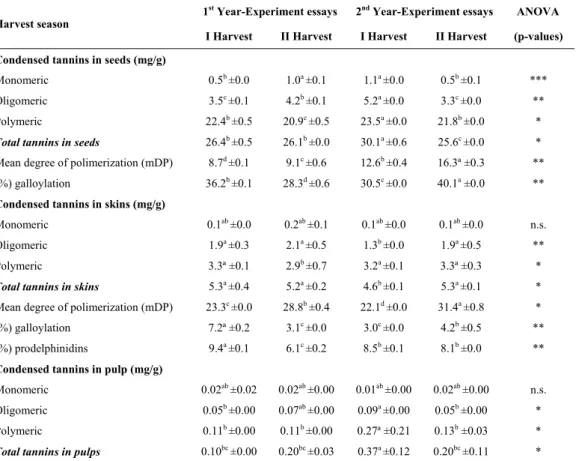
153 TABLE II
Condensed tannins in seeds, skins and pulps of ‘Touriga Nacional’ variety, cultivated in semi-arid tropical region of Brazil, during four harvest seasons
Taninos condensados em grainhas, películas e polpas da variedade ‘Touriga Nacional’, cultivada em região tropical semiárida do Brasil, durante quatro épocas de colheita
Means within the same row followed by different letters are significantly different according to the Tukey test (p˂ 0.05); n.s. not significant; * significant differences at 95% confidence level; ** significant differences at 99.9% confidence level; *** significant differences at 99.99% confidence level; I Harvest - first semester, years 2016 and 2017; II Harvest - second semester, years 2014 and 2016.
For monomeric and oligomeric tannins, a greater effect due to the year of study rather than the harvest season seems to exist, with highest concentrations for these compounds of 1.1 and 5.2 mg/g, respectively. As for polymeric tannins in seeds, it has been detected an effect of the harvest season, with the highest content in grapes harvested in the first season, with values of 22.4 up to 23.5 mg/g, for the two years of study, respectively. The values of polymeric tannins in the seeds used for this study were slightly below from those reported by Cosme et al. (2009) for the same cultivar, in Lisbon region, where they have quantified 27.1 mg/g at harvest time.
The mean degree of polymerization (mDP) in seeds varied on first harvest season from 8.7 up to 12.6 and in the second harvest season from 9.1 up to 16.3, respectively, demonstrating that there was an effect of
the harvest season, with higher values in the grapes harvested in the second semester of the year. This fact can be related to a greater presence of polymerized tannins due to a divergence between the technological and phenolic maturation of the grapes in this region, where during the harvest of the berries is still present green tannins. This may be related to the high temperatures in the second season that lead to a faster ripening of the grapes. According to some authors (Kennedy et al., 2000; Bordiga et al., 2011) in studies in regions with traditional production it has been detected that mDP generally decreases during maturation. These values are higher than those reported by Cosme et al. (2009) for ‘Touriga Nacional’ grape seed extract, under traditional viticulture conditions, in which mDP of 6.2 was observed for the mentioned grape variety. The values
Harvest season 1
st Year-Experiment essays 2nd Year-Experiment essays ANOVA
I Harvest II Harvest I Harvest II Harvest (p-values) Condensed tannins in seeds (mg/g)
Monomeric 0.5b ±0.0 1.0a ±0.1 1.1a ±0.0 0.5b ±0.1 ***
Oligomeric 3.5c ±0.1 4.2b ±0.1 5.2a ±0.0 3.3c ±0.0 **
Polymeric 22.4b ±0.5 20.9c ±0.5 23.5a ±0.0 21.8b ±0.0 *
Total tannins in seeds 26.4b ±0.5 26.1b ±0.0 30.1a ±0.6 25.6c ±0.0 *
Mean degree of polimerization (mDP) 8.7d ±0.1 9.1c ±0.6 12.6b ±0.4 16.3ª ±0.3 ** (%) galloylation 36.2b ±0.1 28.3d ±0.6 30.5c ±0.0 40.1a ±0.0 ** Condensed tannins in skins (mg/g)
Monomeric 0.1ab ±0.0 0.2ab ±0.1 0.1ab ±0.0 0.1ab ±0.0 n.s.
Oligomeric 1.9a ±0.3 2.1a ±0.5 1.3b ±0.0 1.9a ±0.5 **
Polymeric 3.3ª ±0.1 2.9b ±0.7 3.2a ±0.1 3.3ª ±0.3 *
Total tannins in skins 5.3a ±0.4 5.2a ±0.2 4.6b ±0.1 5.3a ±0.1 *
Mean degree of polimerization (mDP) 23.3c ±0.0 28.8b ±0.4 22.1d ±0.0 31.4a ±0.8 *
(%) galloylation 7.2ª ±0.2 3.1c ±0.0 3.0c ±0.0 4.2b ±0.5 **
(%) prodelphinidins 9.4a ±0.1 6.1c ±0.2 8.5b ±0.1 8.1b ±0.0 ** Condensed tannins in pulp (mg/g)
Monomeric 0.02ab ±0.02 0.02ab ±0.00 0.01ab ±0.00 0.02ab ±0.00 n.s. Oligomeric 0.05b ±0.00 0.07ab ±0.00 0.09a ±0.00 0.05b ±0.00 *
Polymeric 0.11b ±0.00 0.11b ±0.00 0.27ª ±0.21 0.13b ±0.03 *
154 obtained for mDP were also higher than those cited by Obreque-Slier et al. (2010) for seeds from other red varieties, where it has been quantified a mDP of 3.2 for ‘Carmenére’ and mDP of 2.7 for ‘Cabernet Sauvignon’, in Maule Valley in Chile region. However, Sun et al. (1998a) found mDP values of 31.5 in the polymeric fraction of grape seeds (‘Tinta Miúda’ variety), in Portugal, the highest values encountered. The mDP values of this study are also in agreement with the values cited by Spranger et al. (2009) in cv. ‘Fernão Pires’, where it was detected values of mDP varying from 0.02 up to 17.8 in the oligomeric fraction and mDP ranging from 0.01 up to 34.5 in the polymeric fraction of the seeds.
The percentage of galloylation was not influenced by the harvest season, but varied between the years of study, with the highest percentage of 40.1 in grape seeds harvested in the second semester of 2016. The percentage of galloylation was higher in this study than those mentioned by Monagas et al. (2003) for seeds of the ‘Graciano’ (10.9%), ‘Tempranillo’ (14.3%) and ‘Cabernet Sauvignon’ (12.9%); by Obreque-Slier et al. (2010) for seeds of other red varieties, it was quantified 27.5% for ‘Carmenére’ and 16.3% for ‘Cabernet Sauvignon’. Other authors, such as Cosme et al. (2009), evaluating the seeds of the varieties’ Vitis vinifera L. ‘Touriga Nacional’ (16.4%), ‘Trincadeira’ (18.5%), ‘Cabernet Sauvignon’ (19.7%), ‘Castelão’ (18.6%) and ‘Syrah’ (18.7%), being the studies reported by the previous authors made in traditional wine-growing regions. The condensed tannins of the skins are presented in Table II. It is possible to observe that there was an influence of the harvest season. The monomeric flavan-3-ols varied from 0.1 up to 0.2 mg/g, the oligomeric tannins ranged from 1.3 up to 2.1 mg/g and the polymer tannins ranged from 2.9 up to 3.3 mg/g, respectively. Concentration of total tannins was not influenced by the time of harvest and the results of the study ranged from 4.6 mg/g up to 5.3 mg/g. These values are higher than those reported by Cosme
et al. (2009) for the same variety, in the region of
Lisbon – Portugal, in which were quantified concentrations of 0.02 mg/g for monomeric tannins, 0.01 mg/g for oligomeric tannins and 2.36 mg/g for polymer tannins.
The mean degree of polymerization in the skins was higher in grapes harvested in the second harvest season of the year, being the highest value 31.4, as it was found for grape seeds. This fact can be related to a faster ripening in grapes from second harvest season, which occurs mainly due to the high
temperatures during the production cycle (Figure 1) as may be observed during the study of the grapes from the second semester containing lower total acidity (Table I) and greater mDP in skins (Table II). According to Kennedy et al. (2001) and Obreque-Slier et al. (2010) on the grape skins, mDP increases during maturation.
The percentage of galloylation in the skins was affected by the harvest season and the values varied from 3.0% up to 7.2% in the harvest of the first semester and 3.1% to 4.2% in the second harvest
season, respectively. The proportion of
prodelphinidins was higher in skins of grapes harvested in the first harvest season, being 9.4% the higher result. The values of mDP and percentage prodelphinidins (%p) for ‘Touriga Nacional’ grape skins, under semi-arid conditions were lower than those reported in the literature for other red varieties, such as ‘Tempranillo’ skins (mDP 72.3 and %p 13.3), ‘Graciano’ (mDP 33.8 and %p 10.7). Monagas et al. (2003) and Bordiga et al. (2011) have analysed ‘Cabernet Sauvignon’ skins and they found values of mDP 36.6 and 53.9% of prodelphinidins.
In this study, small amounts of condensed tannins were detected in the pulp of the grape samples. According to Sun et al. (2001) the proanthocyanidins present in the pulp may result in some kind of contamination during the pulp separation from the skins that was made for the preparation of the extracts.
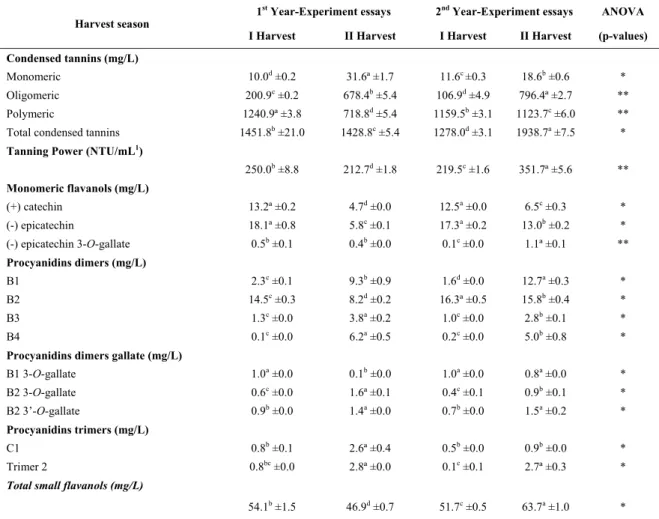
Monomeric and small oligomeric flavanols in seeds
The concentration of the flavanol phenolic compounds from grape seeds is shown in Table III. It is observed that the monomeric flavanols catechin and epicatechin were influenced by the harvest season, with higher concentrations in the first harvest season of the year. The quantities detected on seeds were 1038.1 mg/kg of seeds and 701.5 mg/kg of seeds, for catechin and epicatechin, respectively. Data indicate no significant effect of the harvest time on the concentration of epicatechin 3-O-gallate, but an influence of the year. Their concentration ranged from 6.4 up to 14.8 mg/kg of seeds in the first harvest season and from 5.4 p to 15.3 mg/kg of seeds in the second harvest season, respectively.
For the flavanol dimers extracted from seeds, it was observed that they were influenced by the harvesting season. The concentrations of dimer B1 varied from 5.7 to 11.5 mg/kg, the dimer B2 varied from 219 to 429.8 mg/kg, B3 ranged from 5.7 to 64.6 mg/kg, and B4 ranged from 6.5 up to 19.7 mg/kg.
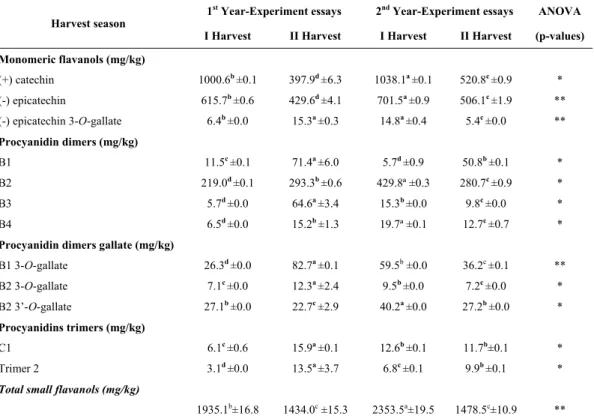
155 TABLE III
Monomeric flavanols and procyanidins in seeds of ‘Touriga Nacional’, cultivated in semi-arid tropical region of Brazil, during four harvest seasons
Flavanóis monoméricos e procianidinas em grainhas de ‘Touriga Nacional’, cultivadas em região tropical semiárida do Brasil, durante quatro épocas de colheita
Harvest season 1
st Year-Experiment essays 2nd Year-Experiment essays ANOVA
I Harvest II Harvest I Harvest II Harvest (p-values) Monomeric flavanols (mg/kg) (+) catechin 1000.6b ±0.1 397.9d ±6.3 1038.1a ±0.1 520.8c ±0.9 * (-) epicatechin 615.7b ±0.6 429.6d ±4.1 701.5a ±0.9 506.1c ±1.9 ** (-) epicatechin 3-O-gallate 6.4b ±0.0 15.3a ±0.3 14.8a ±0.4 5.4c ±0.0 ** Procyanidin dimers (mg/kg) B1 11.5c ±0.1 71.4a ±6.0 5.7d ±0.9 50.8b ±0.1 * B2 219.0d ±0.1 293.3b ±0.6 429.8ª ±0.3 280.7c ±0.9 * B3 5.7d ±0.0 64.6a ±3.4 15.3b ±0.0 9.8c ±0.0 * B4 6.5d ±0.0 15.2b ±1.3 19.7ª ±0.1 12.7c ±0.7 *
Procyanidin dimers gallate (mg/kg)
B1 3-O-gallate 26.3d ±0.0 82.7a ±0.1 59.5b ±0.0 36.2c ±0.1 ** B2 3-O-gallate 7.1c ±0.0 12.3a ±2.4 9.5b ±0.0 7.2c ±0.0 * B2 3’-O-gallate 27.1b ±0.0 22.7c ±2.9 40.2a ±0.0 27.2b ±0.0 * Procyanidins trimers (mg/kg) C1 6.1c ±0.6 15.9a ±0.1 12.6b ±0.1 11.7b±0.1 * Trimer 2 3.1d ±0.0 13.5a ±3.7 6.8c ±0.1 9.9b ±0.1 *
Total small flavanols (mg/kg)
1935.1b±16.8 1434.0c ±15.3 2353.5a±19.5 1478.5c±10.9 ** Means within the same row followed by different letters are significantly different according to the Tukey test (p˂ 0.05); * significant differences at 95% confidence level; ** significant differences at 99.9% confidence level; I Harvest - first semester, years 2016 and 2017; II Harvest - second semester, years 2014 and 2016; results in mg/kg of seeds in fresh weight.
The concentrations of B1 and B4 were lower than those reported in the literature by Ricardo-da-Silva et
al. (1992) for seeds belonging to the variety
‘Carignan’ (B1 - 0.53 mg/g and B4 - 0.91 mg/g, both extracted from seeds) and ‘Mourvèdre’ (B1 - 0.73 mg/g and B4 - 1.32 mg/g, extracted from seeds) as well as results found by Obreque-Slier et al. (2010) in ‘Carmenere’ grape seeds (B1 - 37.6 mg/kgand B4 - 37.1 mg/kg) and ‘Cabernet Sauvignon’ (B1 - 29.2 mg/kg and B4 - 43.6 mg/kg). For procyanidins B2 and B3 the concentrations were higher than those reported by the previous authors.
Concerning the trimer of procyanidins C1 and T2 present in seeds (Table III), it was verified that the highest concentrations were in the second harvest season (2014) with 15.9 mg/kg and 13.5 mg/kg, respectively. There is a tendency for higher concentrations of trimer 2 in the second harvest season.
The concentrations of total small flavanols extracted from seeds were higher in samples from the first harvest season, with values varying from 1935.1 mg/kg up to 2353.5 mg/kg.
The high concentrations of catechin and epicatechin also detected in the first harvest may have contributed to this behavior because other compounds had variations between the periods of time of this study, and not between harvest seasons. Some authors have also reported the vintage effect on the composition of flavanols from seed extracts in other grape varieties. Fuleki and Ricardo-da-Silva (1997) have analysed seventeen cultivars in Ontario – Canada, in 1993 and 1994 harvests, Ferrer-Gallego et al. (2012) have studied ‘Graciano’ variety in Spain, Hernández et al. (2016) have analysed ‘Graciano’, ‘Tempranillo’ and their hybrids (grown at Viveros Provedo in La Rioja, Spain between 2008 and 2010, and reached to the same conclusion: the vintage effect in the flavanol seed chemical composition.
156
Monomeric and small oligomeric flavanols in skins
Table IV presents the results of flavanol concentrations in grape skins. Regarding monomeric flavanols, it is possible to detect that concentrations had higher variation in the year of the experiment than between harvest seasons. Catechin, epicatechin and epicatechin 3-O-gallate presented higher concentrations in the skins of the grapes from the second harvest season, in 2016, with results of 72.8 mg/kg, 117.4 mg/kg and 1.6 mg/kg of skins, respectively. Among the monomers quantified in grape skins, epicatechin was the major flavanol.
As regards the dimeric procyanidins, it was observed that from the seven compounds analysed from the skins of the grapes that only three were influenced by the harvest season: B1 and B2 (higher concentrations in the first harvest season) and B2 3'-O-gallate (higher concentration on the skins of the grapes from the second harvest season). The other compounds varied between the period of time of this study. The highest concentrations were 14.0 mg/kg (B1), 74.2 mg/kg (B2) and 5.2 mg/kg of skins (B2 3'-O-gallate). B2 dimer (Table IV) was predominant in the skins of ‘Touriga Nacional’ grapes in the region of this study. TABLE IV
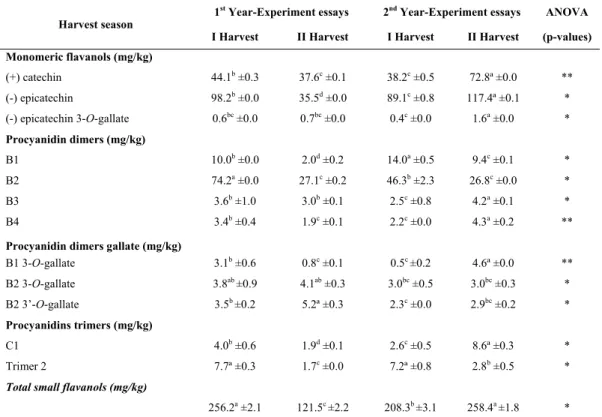
Monomeric flavanols and procyanidins obtained from skins of ‘Touriga Nacional’, cultivated in semi-arid tropical region of Brazil, during four harvest seasons
Flavanóis monoméricos e procianidinas em peliculas de ‘Touriga Nacional’, cultivadas em região tropical semiárida do Brasil, durante quatro épocas de colheita
Harvest season 1
st Year-Experiment essays 2nd Year-Experiment essays ANOVA
I Harvest II Harvest I Harvest II Harvest (p-values) Monomeric flavanols (mg/kg) (+) catechin 44.1b ±0.3 37.6c ±0.1 38.2c ±0.5 72.8ª ±0.0 ** (-) epicatechin 98.2b ±0.0 35.5d ±0.0 89.1c ±0.8 117.4ª ±0.1 * (-) epicatechin 3-O-gallate 0.6bc ±0.0 0.7bc ±0.0 0.4c ±0.0 1.6a ±0.0 * Procyanidin dimers (mg/kg) B1 10.0b ±0.0 2.0d ±0.2 14.0a ±0.5 9.4c ±0.1 * B2 74.2a ±0.0 27.1c ±0.2 46.3b ±2.3 26.8c ±0.0 * B3 3.6b ±1.0 3.0b ±0.1 2.5c ±0.8 4.2a ±0.1 * B4 3.4b ±0.4 1.9c ±0.1 2.2c ±0.0 4.3a ±0.2 **
Procyanidin dimers gallate (mg/kg)
B1 3-O-gallate 3.1b ±0.6 0.8c ±0.1 0.5c ±0.2 4.6ª ±0.0 ** B2 3-O-gallate 3.8ab ±0.9 4.1ab ±0.3 3.0bc ±0.5 3.0bc ±0.3 * B2 3’-O-gallate 3.5b ±0.2 5.2ª ±0.3 2.3c ±0.0 2.9bc ±0.2 * Procyanidins trimers (mg/kg) C1 4.0b ±0.6 1.9d ±0.1 2.6c ±0.5 8.6ª ±0.3 * Trimer 2 7.7ª ±0.3 1.7c ±0.0 7.2ª ±0.8 2.8b ±0.5 *
Total small flavanols (mg/kg)
256.2a ±2.1 121.5c ±2.2 208.3b ±3.1 258.4a ±1.8 * Means within the same row followed by different letters are significantly different according to the Tukey test (p˂ 0.05); * significant differences at 95% confidence level; ** significant differences at 99.9% confidence level; I Harvest - first semester, years 2016 and 2017; II Harvest - second semester, years 2014 and 2016; results in mg/kg of skins in fresh weight.
According to the literature, in the extract of grape skins from traditional regions, compound B1 is usually the most plentiful (Ricardo-da-Silva et al., 1992; Jordão et al., 1998; Butkhup et al., 2010). However, Tyihák et al. (1998) also found higher
concentrations of B2 in skins of Hungarian varieties. Since many factors influence the composition of procyanidins in grapes, the high concentrations of B2 in skins of grapes from São Francisco Valley may be related to the interaction of the variety and the
157 characteristics of the region's "Terroir". Further studies are needed to better understand this behavior, especially in what concerns their biosynthetic pathway.
The total of small flavanols in the skins of the grapes varied mainly with the year of study and there was no tendency for a specific harvest season. The highest concentration present in the skins of the grapes from the first harvest season was 256.2 mg/kg and in the second harvest season was 258.4 mg/kg, both in 2016.
Wines - Chemical composition
Wine oenological parameters
The classic analyse of the wines has been made and results are presented in Table V. pH, total and volatility acidity were not influenced by the grape harvest season. The pH varied from 3.9 up to 4.1 among the wine samples. The total acidity ranged from 4.3 up to 4.9 g/L of tartaric acid. The pH value was considered high for red wines; in general, pH values between 3.6 and 4.5 are common in wines regions (Soares and Leão, 2009).
TABLE V
Effect of the harvest season on the composition of ‘Touriga Nacional’ wines in relation to classic analysis, global phenolic compounds, color, anthocyanins and other pigments
Efeito da época de colheita na composição dos vinhos ‘Touriga Nacional’ em relação à análises clássicas, compostos fenólicos globais, cor, antocianinas e outros pigmentos
Harvest season 1
st Year-Experiment essays 2nd Year-Experiment essays ANOVA
I Harvest II Harvest I Harvest II Harvest (p-values) Classic analysis
pH 3.94a ±0.00 4.00a ±0.04 4.01a ±0.01 4.09a ±0.01 n.s.
Total acidity (g/L) 4.9a ±0.1 4.9a ±0.1 4.8a ±0.0 4.3b ±0.1 *
Volatile acidity (g/L) 0.52a ±0.01 0.61a ±0.04 0.41a ±0.02 0.54a ±0.03 n.s
Alcohol content (% v/v) 11.2c ±0.1 12.0b ±0.2 12.7a ±0.1 12.4a ±0.1 *
Total dry extract (g/L) 29.1b ±0.0 30.0b ±0.4 32.0a ±0.3 25.9c ±0.4 *
reducing substances (g/L) 1.6a ±0.0 1.6a ±0.2 1.5b ±0.0 1.2c ±0.0 **
Free sulfur dioxide (mg/L) 36a±0.3 26c±0.7 34ab±0.6 32b±2.1 *
Total sulfur dioxide (mg/L) 197a±0.5 63c ±3.0 97b ±0.6 52d ±0.9 ***
Potassium (mg/L) 1977.1c ±0.9 2588.4a ±2.7 2108.8b ±2.3 1927.8d ±1.5 **
Calcium (mg/L) 72.4a ±0.4 34.5c ±0.2 53.9b ±0.5 22.1d ±0.1 **
Color and phenolic compounds
Total phenols (mg/L) 1811.8c ±9.9 3187.2a ±9.8 2948.8b ±4.1 1808.5c ±3.5 ** Flavonoids (mg/L) 1674.1c ±3.2 2982.2a ±2.1 2781.2b ±4.9 1628.6c ±3.1 *** Non-flavonoids (mg/L) 138.2d ±3.5 205.5a ±2.8 167.0c ±1.3 180.5b ±0.3 ** Total anthocyanins (mg/Lmalvidin) 381.7d ±3.4 626.0b ±2.0 713.9a ±2.3 453.2c ±8.1 ** Colored anthocyanins (mg/L malvidin) 46.9c ±2.8 119.2b ±1.8 126.3a ±4.0 39.5d ±1.3 **
Ionization index (%) 25.8a ±1.5 19.1b ±0.8 15.4c±0.6 8.7d ±0.2 **
Total pigments (u.a.) 16.9d ±0.1 51.2a ±0.1 43.4b ±0.2 26.8c ±0.3 **
Polymerized pigment (u.a.) 4.7b ±0.1 7.3a ±0.1 4.2b ±0.0 2.5c ±0.1 **
Polymerization index (%) 27.7a ±0.5 16.7b ±0.2 8.2d ±0.0 9.3c ±0.7 **
Copigmentation (%) 9.8c ±0.3 30.6a ±0.7 10.9b ±0.8 11.2b ±1.3 *
Color Intensity (u.a.) 13.757c ±0.083 22.753a ±0.204 20.443b ±0.038 9.037d ±0.060 **
Tonality (u.a.) 0.619c±0.005 1.208a±0.038 0.591d±0.007 0.725b±0.009 **
Means within the same row followed by different letters are significantly different according to the Tukey test (p˂ 0.05); * significant differences at 95% confidence level; ** significant differences at 99.9% confidence level; *** significant differences at 99.99% confidence level; I Harvest - first semester, years 2016 and 2017; II Harvest - second semester, years 2014 and 2016; total acidity (g/L tartaric acid); volatile acidity (g/L acetic acid); u.a. - absorbance units.