UNIVERSITY OF LJUBLJANA FACULTY OF ECONOMICS
MASTER THESIS
BENEFITS AND BARRIERS OF SELF-SERVICE BUSINESS
INTEL-LIGENCE IMPLEMENTATION IN MICRO-ENTERPRISES: A CASE
OF ABC TRAVEL & CONSULTING
AUTHORSHIP STATEMENT
The undersigned Tobias Harms a student at the University of Ljubljana, Faculty of Economics, (hereafter: FELU), author of this written final work of studies with the title: Benefits and barriers of self-service Business Intelligence implementation in micro-enterprises: A case of ABC Travel & Consulting prepared under super-vision of Jurij Jaklič and co-supersuper-vision ofMiguel de Castro Neto.
D E C L A R E
1. this written final work of studies to be based on the results of my own research;
2. the printed form of this written final work of studies to be identical to its electronic form;
3. the text of this written final work of studies to be language-edited and technically in adherence with the FELU’s Technical Guidelines for Written Works, which means that I cited and / or quoted works and opinions of other authors in this written final work of studies in accordance with the FELU’s Technical Guidelines for Written Works;
4. to be aware of the fact that plagiarism (in written or graphical form) is a criminal offence and can be prosecuted in accordance with the Criminal Code of the Republic of Slovenia;
5. to be aware of the consequences a proven plagiarism charge based on the this written final work could have for my status at the FELU in accordance with the relevant FELU Rules;
6. to have obtained all the necessary permits to use the data and works of other authors which are (in written or graphical form) referred to in this written final work of studies and to have clearly marked them; 7. to have acted in accordance with ethical principles during the preparation of this written final work of
studies and to have, where necessary, obtained permission of the Ethics Committee;
8. my consent to use the electronic form of this written final work of studies for the detection of content similarity with other written works, using similarity detection software that is connected with the FELU Study Information System;
9. to transfer to the University of Ljubljana free of charge, non-exclusively, geographically and time-wise unlimited the right of saving this written final work of studies in the electronic form, the right of its repro-duction, as well as the right of making this written final work of studies available to the public on the World Wide Web via the Repository of the University of Ljubljana;
10. my consent to publication of my personal data that are included in this written final work of studies and in this declaration, when this written final work of studies is published.
Ljubljana, ________________________ Author’s signature: _________________________
(Month in words / Day / Year, e. g. June 1st, 2012
i
TABLE OF CONTENTS
INTRODUCTION ... 1
1 THEORETICAL BACKGROUND ABOUT SSBI ... 5
1.1 Self-service technologies ... 5
1.1.1 Definitions ... 5
1.1.2 Self-service Technologies ... 6
1.1.3 Different levels of self-service ... 7
1.2 SSBI foundations ... 9
1.2.1 Definition ... 10
1.2.2 Components of SSBI ... 10
1.2.3 Difference between traditional BI and SSBI ... 12
1.2.4 Different levels of SSBI ... 14
1.2.5 Data quality for SSBI ... 17
1.2.6 Challenges of SSBI ... 20
1.2.7 Success factors of SSBI ... 21
1.2.8 SSBI Tools ... 26
2 THEORETICAL BACKGROUND OF MICRO-ENTERPRISES ... 27
2.1 Definitions ... 27
2.2 Categorization of SME ... 28
2.3 Characteristics of micro-enterprises ... 29
2.4 Micro-enterprises and SSBI ... 32
2.4.1 Challenges ... 32
2.4.2 Benefits ... 33
2.5 TOE framework ... 34
2.5.1 Technology dimension ... 35
2.5.2 Organizational dimension ... 36
2.5.3 External task environment ... 38
3 METHODOLOGY & CASE STUDY ... 40
3.1 Case Study ... 40
3.2 Methodology ... 41
4 CASE STUDY APPROACH ... 43
4.1 Implementation process of SSBI ... 43
4.1.1 Data preparation ... 43
4.1.2 Data model ... 44
4.1.3 Reports ... 45
4.2 Results of the Expert interview ... 47
5 ANALYIS AND DISCUSSION ... 51
5.1 SWOT Analysis ... 51
5.2 Benefits of SSBI in micro-enterprises ... 53
5.2.1 Technology Dimension ... 53
ii
5.2.3 External Task Environment ... 54
5.3 Barriers of SSBI in Micro-Enterprises ... 55
5.3.1 Technology Dimension ... 55
5.3.2 Organizational Dimension ... 55
5.3.3 External Task Environment ... 56
5.4 Limitations and Future Research Direction ... 56
CONCLUSION ... 56
REFERENCES ... 57
LIST OF TABLES
Table 1: Categories and examples of SSTs in use ... 6Table 2: Astute Customer Experience Maturity Framework ... 8
Table 3: The different types of completeness ... 17
Table 4: Example data for completeness ... 18
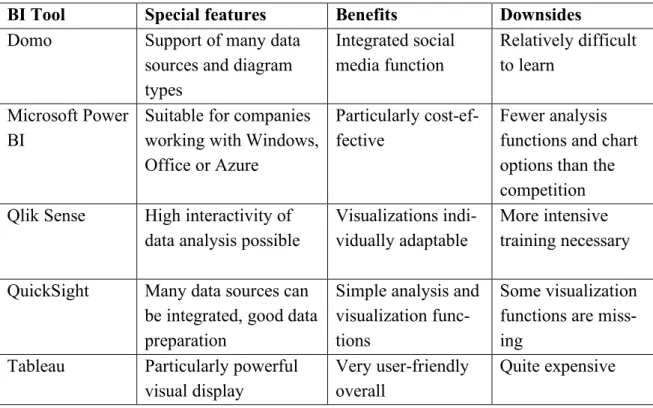
Table 5: Overview of the most popular SSBI tools ... 26
Table 6: Categorization of SME ... 28
Table 7: Overview of technological dimension ... 36
Table 8: Overview of the organizational dimension ... 38
Table 9: Overview of external task environment drivers and barriers ... 40
Table 10: SWOT Analysis of SSBI ... 52
LIST OF FIGURES
Figure 1: SSBI framework ... 14Figure 2: Levels of SSBIst ... 15
Figure 4: TOE framework ... 34
Figure 5: Final data set ... 44
Figure 6: Star-Schema, Data-Model ... 45
Figure 7: Total Revenue by Year and Destination ... 45
Figure 8: Interactive Revenue for selected location ... 46
Figure 9: Top destinations with highest revenue ... 46
Figure 10: Top Customer ... 46
LIST OF APPENDIXES
Appendix 1: Interview Guidelines ... 1iii
LIST OF ABBREVIATIONS
Abbreviation Meaning
ATM Automated teller machine
BI Business intelligence
BIS Business intelligence systems
DBMS Database-management system
ETL Extraction-Transformation-Loading
IT Information technology
OLAP Online analytical processing
SSBI Self-service business intelligence
SSBIS Self-service business intelligence solutions
SST Self-service technologies
SME Small medium enterprises
SWOT Strengths, Weaknesses, Opportunities, Threats
TOE Technology, Organization, Environment
ME Micro-enterprises
1
INTRODUCTION
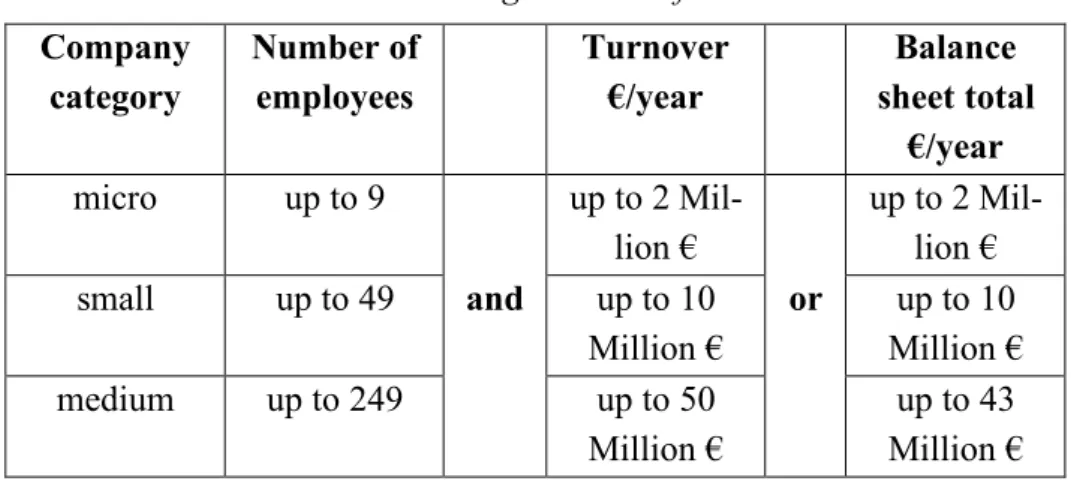
Small medium enterprises (hereinafter: SME) represent 99.8 % of firms in the non-financial business sector of the European Union. SME’s cover three different types of companies, namely micro-, small- and medium-sized enterprises. Micro-enterprises are the most com-mon type of SME in the European Economic Area, accounting for 93.2 % of the non-finan-cial business sector (Muller, Julius, Herr & Peycheva, 2017). Due to their importance, the focus of this work will be on micro-enterprises. They are defined by two factors: firstly, the number of employees has to be lower than ten, and secondly, the turnover or the total assets must be lower than or equal to two million Euros (European Commission, 2014).
Business intelligence systems (hereinafter: BIS) have become significantly important in the business world and academic community over the last two decades (Chen, Chiang & Storey, 2012). The global revenue reached a volume of $ 18.3 billion in 2017 and is forecasted to reach $22.8 billion by the end of 2020. Modern BIS continue to expand more rapidly than the overall market (Moore, 2017). The benefits of the integration of BIS can be seen long-term, users are typically decision makers at higher organizational levels (Puklavec, Oliveira & Popovic, 2014). With the usage of BIS, knowledge workers such as executives, managers, and analysts can make better and faster decisions (Chaudhuri, Dayal & Narasayya, 2011). The proper usage of BIS can be seen as a prerequisite for business success, but these tools are often complex and require a high level of expertise to work with (Davenport, 2017). It is a challenge for micro companies to implement BIS because they have often only a limited set of financial and human resources (Puklavec, Oliveira & Popovic, 2014).
Modern business intelligence (hereinafter: BI) have solutions emerged in recent years, to meet new organizational requirements, accessibility, agility and deeper analytical insight, shifting to a business-led, agile analytics, including self-service (Moore, 2017). BIS has un-dergone two distinctly different fundamental changes. On the one hand, new data sources like social media systems, machine sensors and mobile devices appeared. They often differ from traditional operational data in terms of their structure, rate of growth and volume (McAfee & Brynjolfsson, 2012). On the other hand, the scope of BIS extended from a stra-tegic oriented to more operational oriented tasks. Thus, more employees have the need to apply BI (Böhringer, Gluchowski, Kurze & Schieder, 2010). In addition, BI reports are re-quested to change more frequently (Yu, Lapouchnian & Deng, 2013). Consequently, more users, which are neither information technology (IT or BI professionals, are working with BIS (Kobielus, 2009).
Further to the recent development, the approach of self-service Business Intelligence solu-tions (hereinafter: SSBIS) has been suggested (Spahn, Kleb, Grimm & Scheidl, 2008); (Schlesinger & Rahman, 2016). Through the usage of SSBI users without a specific IT back-ground shall be equipped to work with BIS (Curran & Meuter, 2005). It simplifies the access to source data in order to prosecute reporting and analytical tasks. Furthermore, it provides
2
improved data analysis and easy-to-use BI tools, fast-to-deploy and easy-to-manage data warehouse options, such as cloud computing and simpler and customizable end-user inter-faces (Imhoff & White, 2011). The concept of self-service can be implemented for different tasks in BI: access to prepared reports or data resources, direct access to data, access to functions, or creation of new resources (Alpar & Schulz, 2016). When it comes to the im-plementation of BIS, relevant data of a high quality is needed. Getting the right data is one of the most challenging parts of BI. It is difficult to find the right data and to ensure the right data quality (Watson & Wixom, 2007). So far, research focused on traditional BIS and the adoption of it in SME’s and large enterprises. There is a lack of in-depth research on the barriers and benefits of SSBS in micro companies (Olszak & Ziemba, 2012).
Micro-enterprises (hereinafter: ME) may be home-based, farm-based or street-front busi-nesses and can be either part-time or full-time. They can be found everywhere: rural, urban, as well as in suburban areas in both developed and developing countries. ME are at the lead-ing edge of the enterprise formation process (Wolcott, Kamal & Qureshi, 2008). To be suc-cessful in today's business world, it is essential for them to use BIS. By using BIS, companies can gain a marked advantage over competitors (Davenport, Harris & Morison, 2010). Due to the limited set of resources available to ME the implementation of a SSBIS can be a so-lution (Ranjan, 2009). Managing directors of micro companies often lack awareness of the benefits that information and communication technology (ICT) may provide to their busi-ness and have little or no training in this field (Duncombe & Heeks, 2003). Consequently, this is a major barrier to the adoption of new technologies. Since a lot of small companies are not using IT for their business activities, it is a big problem especially in micro companies (Barba-Sanchez, Martinez-Ruiz & Jimenez-Zarco, 2007).
The purpose of this thesis is to identify the benefits and barriers of self-service business intelligence implementation in micro-enterprises. In this dissertation the technology-organ-ization-environment (hereinafter TOE) framework will be applied specifically for SSBIS solutions in micro companies. Therefore, relevant factors that decide the adoption of SSBIS in micro companies will be revealed. Further to this, an SSBI prototype for the company ABC Travel & Consulting will be developed. In-depth interviews with decision makers at the company will give a well-researched solution to the problems mentioned in this proposal. The results of this study will help micro-enterprises to make a well-educated decision, as to whether they shall implement self-service business intelligence solutions, or not
This study will investigate the usage of SSBIS in micro companies, therefore there will be two main objectives in this study:
- Firstly, to determine the benefits which micro companies will gain through the implementation of SSBIS.
3 SSBIS.
The following goals can be derived from the main objectives: - What differentiates SSBI from traditional BI?
• To understand the differences of SSBI, first, a distinction between traditional BI and SSBI must be made. This will be done through a literature review. - What are the different levels of self-service in BI?
• There are different levels of self-service, it must be investigated which one are suitable in BI.
- What level of self-service is the most suitable for micro companies?
• Because micro companies have specific characteristics it must be investigated which level of self-service is the most effective.
- What are the main success factors of SSBI?
• It is crucial to understand the success factors, in order to guarantee a successful implementation in a company.
- What are the benefits of SSBI in a micro company?
• We have to understand the benefits in terms of business and successful decision making for companies.
- What are the barriers of SSBI in micro companies?
• For a critical consideration of SSBI, the barriers, especially in micro companies, need to be examined.
- What is the role of data in SSBI for the case?
• Finding the right data for BI is one of the most challenging parts. The quality factors of the data need to be defined. Because every implementation is different, the specific role of data for the case study must be researched. As a research methodology, scientific quantitative and qualitative methods will be used. The following chapter describes in detail how the research method is chosen for this master thesis.
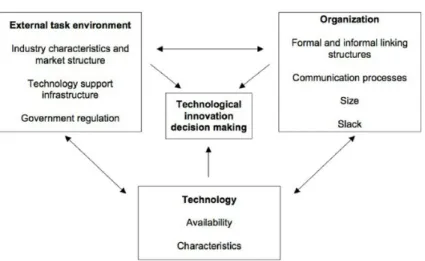
In the first phase, there will be a quantitative document review of the relevant scientific literature. This method is used to cover the theoretical part of the thesis. This includes the theoretical parts about SSBI. To solve the problems confronted in this study, the TOE framework will be used (Tornatzky, Fleischer & Chakrabarti, 1990). Thus, the three elements of the framework, technological, organizational and the environmental context will be examined more closely regarding the implementation of SSBI in ME (Baker, 2012). In the technological component, the characteristics and usefulness of SSBI will be described. The organizational context contains the internal issues within the company such as management, employee, products, and services. Within the environmental context, all external factors that exist in the business field will be investigated.
4
the main framework used in this study (Chiu, Chen & Chen, 2017). The technological context describes all the technologies that are relevant for the implementation of SSBI, this is both technologies that are already in use, as well as those that need to be acquired externally (Collins, Hage & Hull, 1988). The objective of this dimension is to identify the technological limits and to show how technology can enable the firm to evolve and adapt SSBIS. There are three types of innovations, those that create incremental, synthetic or discontinuous changes (Tushman & Nadler, 1986). To identify the component of this dimension, the theory of diffusion of innovations (Chiu, Chen & Chen, 2017) that refers to “Relative advantage”, “Compatibility”, “Complexity”, “Trialability” and “Observability” as main technological factors for new innovations will also be addressed. The organizational context of the TOE framework refers to the characteristics and resources of the firm (Baker, 2012). A very important orgfetanizational factor for the adoption of new innovations is, for example, the support of high-level executives (Low, Chen & Wu, 2011). Other important factors are “Information Intensity” “Management Support”, “Employees Knowledge”, “Absorptive Capability”, (Chiu, Chen & Chen, 2017). The third dimension of the TOE framework is the environmental context. It includes the structure of the industry, the presence and absence of technology service providers and government regulation. For example, a competitive environment stimulates the adoption of new technologies (J. Baker, 2012). Factors that determine this dimension can be “Competitive Pressure”, “Business Partners”,“External Support” and “Governmental Support” (Chiu, Chen & Chen, 2017). In this context, the objective is to identify all relevant technology, organizational and environmental factors that may influence the adoption of SSBIS in micro companies. In the second phase, a case study will be perform by the implementation of a SSBIS prototype in a micro company (ABC Travel & Consulting GmbH). The prototype used will be the SSBI solution Mircosoft Power BI. This will make it possible to gain an insight into how micro companies can profit from this type of software and the challenges they face. Following on from this qualitative interviews with open and closed questions will be conducted with relevant stakeholders, relevant decision makers like the CEO. The interviews will be held personal and will be recorded and transcribed in its entirety. The results from this phase will help the reader to understand the relevant benefits and barriers of SSBIS for micro companies, as well as other relevant factors. Furthermore, the implementation process of the prototype may allow the company to gain experience in the usage of an SSBIS, as well guide them to improve business performance and to give them a competitive advantage. Finally, in the third phase, the objectives of the thesis will be to analyze the results of the previous phases to answer the research question. Thus, the results of the case study will be assessed according to the dimensions and factors of the TOE framework. Additionally, a SWOT (Strengths, Weaknesses, Opportunities, Threats) analysis will be conducted to properly address the main features of SSBIS. The analysis will help to identify key issues which affect business development and entreprises growth (Pickton & Wright, 1998). The SWOT framework will be used to identify the strengths and weaknesses through an analysis
5
of the resources and capabilities, and will also identify the threats and opportunities for micro companies that arise as a result of the implementation of an SSBIS (Stacey, 2011).
1
THEORETICAL BACKGROUND ABOUT SSBI
1.1 Self-service technologies
In today’s competitive environment, service marketers are constantly looking for new, inno-vative ways to meet customers wants and needs. At the same time companies are trying to reduce labor costs. A practice-proven solution that combines both objectives is the usage of self-service technologies (hereinafter: SSTs) (Lee & Allaway, 2002, p. 553).
The following chapter will introduce a definition of SSTs and will discuss various aspects of this technology. Furthermore, the different levels of self-service will be explained. 1.1.1 Definitions
In 1917 the term “self-service” was introduced to the business world. Back then the U.S Patent Office granted a patent for a “self-service store” (U.S. Patent No. 1242872A, 1917). Grocery stores, that licensed this business method, now allowed customers to collect items themselves and present them to a cashier. Before that clients needed to give a shopping list to a store clerk who then collected the items for them (Shaw, Curth & Alexander, 2004, p. 570). Therefore the term self-service is defined as “a system in which customers are not served by an employee, but collect goods or food themselves” (Cambridge University Press, 2018).
The use of the term “technology” has changed scientifically over the last few centuries. Be-fore the 20th century it was mostly used to describe practical subjects such as manufacture
and craftsmanship (Buchanan, 2018) or the term referred to technical education (Stratton & Mannix, 2005, pp. 190–192). The word’s meaning changed in the early 20th century with the
second industrial revolution (Schatzberg, 2006). So, American sociologist Read Bain wrote in 1937 that "technology includes all tools, machines, utensils, weapons, instruments, hous-ing, clothhous-ing, communicating and transporting devices and the skills by which we produce and use them." (Bain, 1937, p. 860). This definition still remains in common usage today, even though scientist and engineers usually define technology as an applied science (Mac-Kenzie & Wajcman, 1999, pp. 9–10). According to the English dictionary Merriam-Webster, the term can also be defined as “the practical application of knowledge especially in a par-ticular area” (Merriam-Webster.com, 2018).
The term self-service technologies (SSTs) can be derived from the definitions of the terms self-service and technology. Thus, SSTs are “technological interfaces that enable customers to produce a service independent of direct service employee involvement.” (Meuter, Ostrom,
6 Interfac
e Purpos
e
Roundtree & Bitner, 2000, p. 50). This explanation implies that SSTs are characterized by two aspects. First, the service is enabled through technology and the customer interacts with a machine instead of a person during the service process (Cunningham, Young & Gerlach, 2008, p. 723). Second, the customer is a co-producer of the service (Vargo & Lusch, 2008, p. 2). Examples of SSTs include ATM’s (automated teller machines), automated hotel check out, online transactions such as investment trading, fully automated phone systems and self-service business intelligence systems (Curran & Meuter, 2005, p. 103).
1.1.2 Self-service Technologies
The internet has changed the interactions between clients and service providers in many ways. It is playing an increasingly significant role in the way in which services are delivered to the customer (Bobbitt & Dabholkar, 2001, p. 424). Although the internet enables a lot of SSTs there are also other technologies that enable self-service (Meuter, Bitner, Ostrom & Brown, 2005).
Table 1 gives an overview of the SSTs that are available to customers today. It is not an exhaustive list but it gives an idea as to what is possible through the usage of self-service (Meuter, Ostrom, Roundtree & Bitner, 2000, p. 52).
Table 1: Categories and examples of SSTs in use Interactive Voice Re-sponse Online/Internet Interactive Kiosks Video/CD Customer service - Telephone banking - Flight infor-mation - Order status - Package track-ing - Account Infor-mation - ATMs - Hotel checkout Transac-tions - Telephone banking - Prescription refills - Retail pur-chasing - Financial transactions
- Pay at the pump - Hotel checkout - Car rental Self-help - Information telephone lines - Internet infor-mation search - Distance learning - Blood pressure machines - Tourist infor-mation - Tax preparation software - Television/CD based training
Source: Meuter, Ostrom, Roundtree & Bitner (2000).
Examples of SSTs enabling customers to produce their own customized services abound. For example, Amazon.com revolutionized the image of retail shopping. The company allows
7
customers to buy almost every conceivable book online, just by typing in the related key-word. Customers use a virtual shopping cart and can easily browse, explore related titles, and purchase all the items at once. Based on clients past ordering history, they also receive customized advice in the form of personalized book recommendations (Linden, Smith & York, 2003, p. 76). Similarly, Wells Fargo Bank changed the service standards in the finance sector. The bank offers a wide variety of self-service. Through the online portal, customers can view their account information, pay bills, transfer money, apply for new account or in-vest in the stock market. In addition to this the bank also provides a 24-hour banking system offering more than 150 types of services and maintains a vast network of ATM’s. They enable customers to access any combination of banking services, 24 hours a day, 365 days a year (Bitner, 2001, p. 377). A pioneer in a business-to-business context in providing self-service for their customers is FedEx. Through the usage of SSTs, the company gives access to package tracking, information storing, billing and provides access to the FedEx online portal. Customers receive service when they want it and are able to customize the service on their own (Bitner, Brown & Meuter, 2000, p. 144).
There are typically three goals that a business hopes to achieve with the adoption of self-service technologies. The first goal is to provide technology delivered customer self-service, with the intent to provide customer service without tying up the company’s human resources. If the implementation is carried out correctly then the firm will also save financial resources. Some examples of this are: providing product information to customers, online troubleshoot-ing systems, internet-based package tracktroubleshoot-ing, and online/phone banktroubleshoot-ing (Chang-tseh, 2005, p. 78). The second goal of SSTs is to engage customers in direct transactions with the com-pany’s products or services through the use of technology (Ostrom, Bitner & Meuter, 2002, p. 46). Examples for this sort of SSTs include: automated kiosks, online shopping, online trading and travel and ticket services. The third goal of the integration of SSTs is education, whereby the customers are able to educate and train themselves. Information homepages, training videos (via DVD or Internet) and phone-based information lines are some examples of related to the educational objectives of SSTs (Chang-tseh, 2005, p. 78).
1.1.3 Different levels of self-service
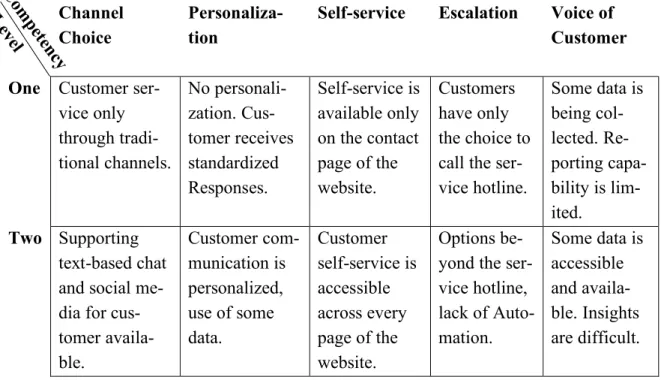
According to the Customer Maturity Matrix, there can be derived five different levels of self-service. The level of service maturity rank from one to five, with five being the most sophisticated. As the majority of SSTs are delivered through web technologies, a mature web and mobile self-service strategy is important to reach a high level of self-service. Self-service means that the customer can fulfill their needs without of any external help. Thus, to provide a satisfying self-service experience, companies need to reach a high level in all five competencies of the Customer Experience Maturity Framework (Astutesolutions.com, 2017). The five core competencies which determine the level of self-service are described below and the complete Customer Maturity Matrix with all the necessary competencies is displayed in table 2.
8 Com pe ten cy L eve l
1. Channel Choice: to offer customers a satisfying service, the right channels need to be offered, if a client prefers one channel he should not be forced to use another channel (Schoenbachler & Gordon, 2002).
2. Personalization: the more personalized a service offer is, the higher is the response rate of the customer, therefore it is an important competency (Aguirre, Mahr, Grewal, de Ruyter & Wetzels, 2015).
3. Self-service: people want to use the full service offer without depending on employees and office hours (C. Meyer & Schwager, 2007).
4. Escalation: when a customer cannot find an answer on their own, they need to be for-warded to another department, therefore an efficient escalation strategy is needed (Smith, 2005).
5. Voice of Customer (hereinafter: VOC), is the process of capturing customers’ require-ments. It produces a detailed set of customers’ wants and needs which the company can use to provide a sophisticated customer experience (Gaskin, Griffin, Hauser, Katz & Klein, 2011, p. 6).
Table 2: Astute Customer Experience Maturity Framework Channel
Choice
Personaliza-tion
Self-service Escalation Voice of Customer
One Customer ser-vice only through tradi-tional channels. No personali-zation. Cus-tomer receives standardized Responses. Self-service is available only on the contact page of the website. Customers have only the choice to call the ser-vice hotline. Some data is being col-lected. Re-porting capa-bility is lim-ited. Two Supporting text-based chat and social me-dia for cus-tomer availa-ble. Customer com-munication is personalized, use of some data. Customer self-service is accessible across every page of the website. Options be-yond the ser-vice hotline, lack of Auto-mation. Some data is accessible and availa-ble. Insights are difficult. table continues
9 C om pe ten cy L eve l table continued Channel Choice Personaliza-tion
Self-service Escalation Voice of Cus-tomer
Three Optimized multi-channel customer support avail-able, but lack of integra-tion. Reactive in-teraction with deeper level of personali-zation. Multiple channels for self-service, but no inte-gration be-tween them. Some level of automa-tion. Only limited infor-mation is passed to agent. Collecting at least 2 types of VOC data, but data is not consolidated.
Four Customer ex-perience is optimized but agent experi-ence is lim-ited and inef-ficient.
Proactive communica-tions are now on same level as reactive in-teractions. Integration between self-service chan-nels. Unified strategy and experience across plat-forms. Responding agent, re-ceives full context of previous in-teractions. Collecting all 3 forms of VOC data and able to consol-idate to gain best insights.
Five Support all channels cus-tomers want and have op-timized agent experience. Individualized communica-tion, Cross-channel inte-gration pro-vides con-sistent person-alization. Consistent ex-perience that is automated and device-optimized. Uses of artifi-cial intelli-gence. Best agents are paired to most valua-ble custom-ers. Opti-channel ap-proach. Collecting and consolidating all VOC data and reporting includes real-time and ac-tionable in-sights.
Source: Adopted from Astutesolutions.com (2017).
1.2 SSBI foundations
According to the Business Application Research Centers, SSBI is a powerful trend that is gaining momentum in the delivery and use of BI software. Financial reasons and time con-siderations are the cause to let end users create their own reports and data analyzes, without applying for IT support (Bange, 2014)
10 1.2.1 Definition
The term SSBI is composed of service and business intelligence. A definition of self-service was already given in chapter 1.1.1.
The Gartner Group Inc. is one of the leading companies in the field of BI and was one of the first firms to use the term “business intelligence” in the mid-1990s (Shariat & Hightower, 2007, p. 40). They referred in one of their reports to BI as “…making sound business deci-sions based on accurate and current information takes more than intuition. Data analysis, reporting, and query tools can help business users wade through a sea of data to synthesize valuable information from it – today these tools collectively fall into category called Busi-ness Intelligence” (Gartner Group, 1996). The meaning of the term developed to the follow-ing definition “Business intelligence” is an umbrella term that includes the applications, in-frastructure and tools, and best practices that enable access to and analysis of information to improve and optimize decisions and performance” (Gartner Group, 2018). According to this definition, BI systems are tools which support decisions through the provision of actionable information at the right time, at the right location and in the right form. The goal of BIS is to facilitate managerial work and to improve the timeliness and quality of input in the deci-sion process (Negash, 2004, p. 178).
Derived from the definitions of the terms “self-service”, “self-service technologies” and “business intelligence” it can be said that through the usage of self-service business intelli-gence users shall become able to use BI solutions without explicit BI/IT knowledge. For an explanation of SSBI we refer to the following definition: “The facilities within the BI envi-ronment that enable BI users to become more self-reliant and less dependent on the IT or-ganization. These facilities focus on four main objectives: easier access to source data for reporting and analysis, easier and improved support for data analysis features, faster deploy-ment options such as appliances and cloud computing, and simpler, customizable, and col-laborative end-user interfaces” (Imhoff & White, 2011, p. 5). The definition implies that SSBI tools should be intuitive and easy to use (Schlesinger & Rahman, 2016, p. 14). Fur-thermore, it should be metadata dictionary to allow the knowledge workers to understand the underlying data (Foshay, Mukherjee & Taylor, 2007).
1.2.2 Components of SSBI
SSBI systems consists of similar components as traditional BIS, there are three components that are the most common through the literature that characterize a SSBI system. These are logical Data Warehouse, data preparation tools, and an alternative OLAP tools (Olszak, Ziemba & Alex Koohang, 2006, p. 49).
11
An important component of a SSBI system is a logical data warehouse. The basic idea of the data warehouse is simple: data from the operative systems are copied into a separate database. If necessary, the data will be prepared for carrying out corresponding queries and analyzes. A data warehouse is a tool for storing decision-relevant information. The goal is to improve the company-wide information supply. Every data warehouse is unique, thus it is a solution tailored for the specific needs of the company (Grothe & Gentsch, 2000, p. 52). The idea of a SSBI is that different departments of companies can dive into the data and run analytics without having to submit a formal request to IT. For example, the marketing de-partment might analyze the performance of marketing campaigns based on data from the CRM while the sales team might use another tool to analyze the sales performance. There is also data, such as unstructured social media data that is not made for a traditional data ware-house. To solve the challenge of different data sources a SSBI should have a logical data warehouse (Shankar, 2017). A logical data warehouse does not contain any data, instead it contains the intelligence and the logic for accessing the various sources, including the nec-essary security credentials. The data sources may include structed, semi structured or un-structured databases, flat files, cloud-based storage repositories and also traditional physical data warehouses (Merv, 2011).
1.2.2.2 Data preparation
The second important component of a SSBI system is the data preparation. It is “the process of preparing and providing data for data discovery, data mining and advanced analytics” (BARC, 2017). In SSBI it is used to integrate the various data types into the SSBI system. In traditional BI, Extraction-Transformation-Loading (hereinafter: ETL) tools are used for the extraction of data from several sources, their cleansing, customization and insertion into a data warehouse (Theodoratos, 2002). A SSBI system does not necessary need a data ware-house, so ETL tools are only needed if the SSBIS integrates a data warehouse. "There is a big myth in self-service which is that you can just somehow open a big database and the users are going to go make sense out of it, typically, there has to be a lot of prep work to get something in place. It doesn't matter what kind of self-service it is. IT, data people, whoever -- technical people -- have to do a fair amount of prep work to get at it and make it available." said Philip Russom, TDWI's director of research for data management. There are a dozen data preparation tools available on the market. Some have rich scripting and data mining features, others provide automation and a modern user experience intended for nontechnical users. With data preparation, users are able to quickly and easily access, manipulate, enrich and combine disparate data from various sources and prepare it for analysis (Moreno, 2017). 1.2.2.3 OLAP alternative
Traditional BI systems rely on data from an integrated and consisted data warehouse which is constantly fed with operational data. According to the OLAP approach (online analytical processing), data is stored in multidimensional cubes, and with the help of OLAP techniques
12
like slice and dice, the cubes get consolidated. To change the structure of OLAP cubes, ex-pert IT knowledge is necessary (Golfarelli, Rizzi & Pagliarani, 2009, p. 29). Thus, another important component is the usage of an OLAP alternatives (Abelló and other, 2013) suggests the usage of Fusion Cubes, which is different to traditional multidimensional cubes as it can be dynamically extended in its schema and its instances. Furthermore, each fragment of data and metadata is associated with a set of explanatory notes that describe its quality from dif-ferent points of view, the source it was taken from, its validity and its reliability (Abelló and other, 2013, p. 69). Also the usage of data lakes has been suggested (Harris, 2017). It is a methodology based on low cost technologies that improves the capture, refinement, archival and exploration of raw enterprise data. A data lake contains unstructured or multi-structured raw data (Fang, 2015, p. 820). Another alternative is the usage of in-memory database man-agement system (hereinafter: DBMS) (Harris, 2017). The memory of a computer offers higher access speeds than hard disk and the algorithms for access are simpler. Therefore, in-memory databases are much faster, and their access times are more predictable than those of disk-accessing DBMS. As in-memory databases store their data in volatile memory, which they lose in the event of system crashes, it is harder to meet the requirement of persistent storage after a successfully completed transactions (Vizard, 2012). It is also possible to im-plement hybrid in-memory databases, which are database systems that can store data in both the main memory and hard disks. That makes it possible to achieve the right balance of performance, cost, durability and form factor during operation (Cole, 2007). As small com-panies normally don’t have very complex data structures, another alternative for the tech-nologies mentioned before, is the direct data analysis with OLAP similar techniques pro-vided by the SSBI tool itself. (Mihai, 2017). Self-service tools eliminate the technical knowledge requirements for business users and the need for IT assistance, because they are designed for analytics via a visual interface. Upfront data modeling is not necessary with the usage of SSBI tools and can be used with a lot of different kind of data sources. They offer the same kind of multi-dimensional interactions with data sets that originally required the use of OLAP cubes. Users can define and adjust their own drill paths based on their need, and data structures don’t need to be structured into a data cube during data modeling (Harris, 2017).
1.2.3 Difference between traditional BI and SSBI
The components of a SSBI and a traditional BI system are different, as already described in chapter 1.2.2, but there are some additional characteristics that may differ between these two models as described in the following chapter.
1.2.3.1 Architecture
The traditional BI architecture is composed of three layers: data layer, information layer and access layer (Baars & Kemper, 2008, p. 137):
13
1. The data layer is responsible for storing various types of data. Usually structured data is kept in data repositories like data warehouses or data martes whereas unstructured con-tent is handled by concon-tent and document management systems. The data is extracted from source data and before the data can be analyzed in a valid way it has to be trans-formed in several steps (Kemper, 2000).
2. The logical layer provides the functionality to analyze the various data types and supports the distribution of relevant knowledge. The analytical functionality includes OLAP and data mining but also the functionality to generate business reports, ad hoc analysis and to implement concepts like the balanced scorecard or value driver trees (Cheng & Cheng, 2011).
3. The access layer allows the user to use all the relevant functions of the logic layer in an integrated fashion. It is usually realized with some sort of software that provides a con-venient graphical user interface (Priebe, Pernul & Krause, 2003).
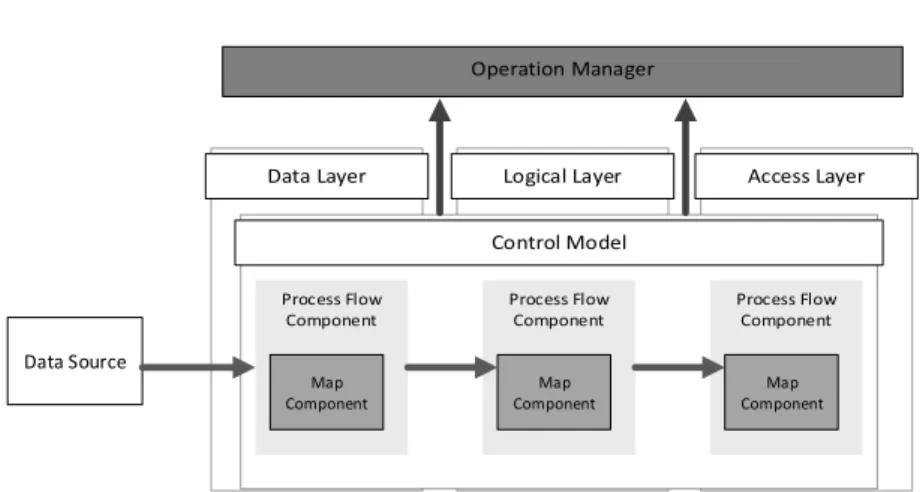
Zaghloul and collaborators (2013) suggest a new SSBI business analysis framework with the same layers as the traditional BI architecture but using a process centric approach with different components for each layer. There are four main components which will play the main role of connecting this layer: map component, process flow component, control model and the operation manager, as depicted in Figure 1 (Zaghloul, Ali-Eldin & Salem, 2013). 1. The map component takes over the function of the ETL. It starts from the data layer and
continues until the business Layer. The idea is that with the usage of a map component it is not necessary to use a third-party tool for the ETL process.
2. The process flow component is responsible for allowing the other components to tion. It allows the next function in the flow to start automatically once the previous func-tion is done. This component is the backbone of the suggested SSBI structure including all the business rules required to move from one function to the next.
3. The control model is responsible for managing and monitoring all the activities of the map component and any other component that might be integrated within the framework in the future to execute any other functions. When integrating external components into the framework, a metadata file needs to be integrated so that the control component is able to execute and manage the activities of all process flows and map components. 4. The operation manager is made up of two user interfaces, one for the business users and
another for the technical users responsible for managing the process flow operations It is a single point of access that allows users to monitor, control and configure most of the framework functions.
14
Figure 1: SSBI framework
Source: Zaghloul, Ali-Eldin & Salem (2013).
1.2.3.2 Reporting
SSBI tools provide easy operation of the reporting system in the preparation of ad hoc reports or analyzes. It also allows cooperation between users (collaboration). Further to this, it is also possible to integrate its own, often Excel-based evaluations as well as other sources in an existing dashboard. Users don’t need specific IT knowledge. In comparison to this, with traditional BI tools users can only access predefined reports which were previously created by the IT team (Rohrmoser, 2013). SSBI tools are typically intuitive and interactive and let users explore data beyond what the IT department has curated. Furthermore, they also allow the user to create reports for mobile phones and to publish them on the web (Blitz, 2017). 1.2.3.3 Costs
The costs of implementing SSBI can be considered qualitatively and quantitatively. Quanti-tative analysis varies from company to company, from organizational form to organizational form and from case to case. The qualitative costs analysis can be generalized in most cases. The difference with the implementation of traditional BIS is that the costs for the IT will drop and the expenses department will rise. There is a cost shifting through SSBI from IT to the individual department. However, with an SSBI there are overall less or maximum equal cost. Furthermore the implementation leads to higher satisfaction in both areas (Spieß, 2012). SSBI have comparatively low entry costs that allow micro-enterprises to exploit their data in a way that was once only possible for much larger companies (Humphries, 2017). 1.2.4 Different levels of SSBI
There can be distinguished three different levels of self-service in BI. To each of these levels there can be assigned different tasks. An equivalent classification is shown in Figure 2. The system support necessary varies with these tasks and different BI applications exist for each of the levels. Some only extend traditional BIS, while other are stand-alone SSBIS. Some of
Data Source Map Component Map Component Map Component
15
the features already exist in traditional BI but the implementation for a large group of user, the user friendliness, and the power exceed the possibilities of traditional BIS (Alpar & Schulz, 2016, p. 154).
Figure 2: Levels of SSBIis
Source: Alpar & Schulz (2016).
1.2.4.1 Usage of Information
This is the lowest possible level of self-service. Users can only access already created reports or can set few parameters before processing them. The difference to traditional BI reports are that user have access to all reports that are potential relevant. This is approach is espe-cially well-suited for business users without special analytical or tool skillsets. With this approach it is difficult to gain deep insights into the data. Only basic insights can be obtained. This level can be improved with the implementation of a “drill anywhere” possibility for reports and dashboards (Eckerson, 2009). Users start their analysis usually on a highly ag-gregated level, but they can drill down predefined paths to answer more specific questions, step by step until they acquire the information they need. For analyzing data that is not in-clude in the data warehouse, these don’t need to be imported into the system. A switch to these sources is very intuitive or the users do not notice it at all. This guidance simplifies the analysis for the user but it remains restricted to what has been prepared by an IT specialist before (Bessa, Branco, Costa, Gonçalves & Moreira, 2018).
1.2.4.2 Creation of information
On the second self-service level, to create new information, users can get access to data on the lowest particular level in the system. It can not be foreseen which needs consumer have, thus it is favorable to give them the capability to create new information. In traditional BI this is possible though the usage of SQL (Structured Query Language), but this query lan-guage is difficult to use for business users and thus do not meet the requirements of self-service. With the usage of new self-service tools, virtual views can be created almost on the fly, even from big data files if necessary. Casual users can choose whether they want to analyze existing data as flat, relational or multidimensional files (Hänel & Schulz, 2014). Thus, BI specialists are no longer needed to select the necessary data. This however, carries
16
the risk of incorrect data. On the downside, casual users normally have less understanding for complex data relationships. Hence, it also carries the risk that incorrect data excerpts or aggregates are selected. In addition to the preparation of charts and reports, users can also give the chance to autonomously perform advanced analytics, like text mining or predictive analytics, that go beyond the analyses of historical data. Because these functions are highly complex, casual users are often not able to correctly formulate their analysis requirement. Thus, it is necessary to provide the analytical functions, without the need to master a statis-tical package. Especially when mathemastatis-tically and statisstatis-tically inexperienced users perform these tasks, the risk of a faulty analysis is given, because they have little chances to assess the correctness of their calculations (Meyers, 2016).
1.2.4.3 Creation of information resources
The creation of information resources is the highest level of self-service, functions at this level go beyond traditional BI systems. In traditional BIS, the data from various sources are combined and offered to the user as a unified source. Because there is a huge variety of data sources and varying user requirements, data preparation is becoming more and more chal-lenging (Chen, Chiang & Storey, 2012). Thus, with SSBIS, business users can be given the opportunity to exploit new data sources for analysis that are not preprocessed by IT. New information resources get created due the combination of these data with corporate data. After a simple implementation into the system, they have the opportunity to load the data into their personal workspace. Complex systems enable autonomous integration of various sources with corporate data. This creates new sources of errors. Existing access rights must be respected if the data is shared with others, the usage of poor quality data shall be avoided and relationships need to be identified (Stodder, 2012). Another possibility on this level is to offer casual users different functionalities using reusable components that have been pre-pared by IT professionals. Because these elements have been already preprocessed they can be joined through simple drag-and-drop to form a so called mashup, e.g., in the appearance of a dashboard (Kobielus, 2009). This approach is more complex and involves IT-profes-sionals, but it stays hidden to the business user.
1.2.4.4 User roles
The required BI skills depend on the flexibility that is offered to the user (Spahn, Kleb, Grimm & Scheidl, 2008). Thus, the idea of SSBI does not mean the same for everybody. To provide the right BI tools to the users, the needs need to be determined based on their specific tasks, their informational demands, their IT skills, and their analytic skills (Eckerson, 2008). Thus, the self-service concept can be adapted to the needs of any business user giving them enough flexibility without overstraining them with functionalities. A strict classification in different user groups according to their business function is not needed, because they have alternating needs and different skills independently on their function, it is sufficient to con-trol the individual access rights to data. It makes sense to make a rough division of two user
17
types into casual and power user based on their analytical and tool skills. Power user produce information, either for themselves or for others and casual users consume information most of the time.
1.2.5 Data quality for SSBI
Business users can import all kinds of data into a SSBI, and because the IT department is often not included in the decision, and casual users lack technical understanding, there is a pitfall of including bad quality data. Decisions based on this kind of data have a high prob-ability of leading to bad decisions that affect the business. Thus, it is very important to ensure a high quality for the data used in SSBI. The data only has value when it supports the deci-sion-making process (Yeoh & Koronios, 2010). The quality rules should consider the value that data can provide to the company. There are six dimensions that need to be considered when determining the quality of data: completeness, uniqueness, timeliness, validity, accu-racy and consistency. They will be explained in the following chapter (Askham and other, 2013).
1.2.5.1 Completeness
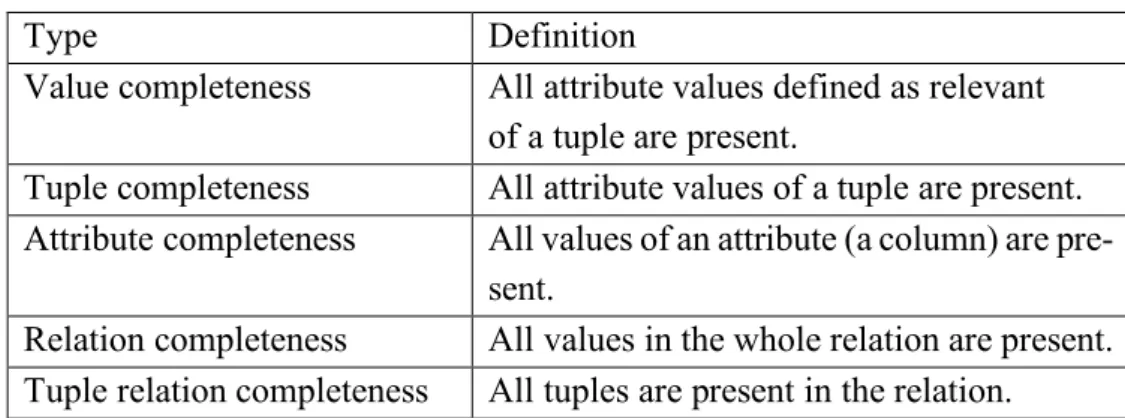
Completeness describes to which extend data is not missing and is of sufficient breadth and depth for the desired analysis (Daniel, Casati, Palpanas & Chayka, 2008). When defining the completeness, it must be distinguished whether zero values are allowed in the data model or not (Scannapieco, Missier & Batini, 2005). There are five different types of completeness, which are shown in Table 3. Table 4 shows an example of data set and functions to symbolize the various types of completeness.
Table 3: The different types of completeness
Type Definition
Value completeness All attribute values defined as relevant of a tuple are present.
Tuple completeness All attribute values of a tuple are present. Attribute completeness All values of an attribute (a column) are
pre-sent.
Relation completeness All values in the whole relation are present. Tuple relation completeness All tuples are present in the relation.
Source: Scannapieco, Missier & Batini (2005).
The tuple completeness is satisfied if all attribute values of a tuple are present. In Table 4 the tuples with the Student-ID 129234, 239023 and 129329 fulfill the tuple completeness. The tuples with the Student-ID 328928 and 139203 are not complete because one or two values
18
are missing. The value-completeness is a weakened form of tuple-completeness. Here, a dis-tinction is made between relevant and non-relevant attribute values. The value-completeness is fulfilled if the previously defined attribute values of a tuple are present. If the Exam date is defined as not relevant in Table 4, the tuple with the student number 328928 would fulfill the value-completeness. If all the values of an attribute (a column) exist in the entire table, the attribute completeness is satisfied. In Table 4 the attributes Student-ID, first name and last name fulfill this criterion. In contrast to this, one or two values are missing for the at-tributes Grade and exam day, so that the attribute completeness is not fulfilled (Panse & Ritter, 2009). The relation-completeness examines missing values in the whole relation. It does not matter which tuple or attribute lacks the value. Accordingly, in Table 4, there are a total of three zero values, and therefore the relation-completeness is not satisfied. In tuple relation completeness it is required that all tuples are present in the relation. So, if a whole tuple is missing, the tuple relation-completeness is not fulfilled (Scannapieco & Batini, 2004).
Table 4: Example data for completeness
Student-ID First name Last Name Grade Exam day
129234 Peter Maier 9 22.05.2018
328928 Hans Ulrich 8
139203 Andreas Schneider
239023 Thomas Torres 7 01.06.2018
129329 Lukas Mueller 5 21.05.2018
Source: Own work.
1.2.5.2 Uniqueness
A record must be uniquely interpretable, that is, the existing metadata must commit the se-mantics of the record. That means that there should not be data duplicates. To reduce the risk of accessing outdated information, each data record should be unique. For example, we may have in our database two clients that were registered as Tom Mueller and Thomas Mueller, which in fact are the same person, but the latter has the latest details. This data brings the risk that the Customer Service department may access outdated information under Tom Mueller and will not be able to contact the client. The quality dimensions are not always 100% met, meaning that data can be accurate but incomplete. Decision makers have to make conclusions based on data, thus it is important to perform a short audit of data before com-piling KPI results in a performance report, based on the quality dimensions presented here. Thus, if there is a uniqueness issue or data is not complete, data users must be informed in order to avoid biased decisions (Fürber & Hepp, 2011).
19 1.2.5.3 Timeliness
All datasets correspond to the current state of the modeled world and are therefore not alien-ated. The data reflects the actual properties of the object in a timely manner. Lack of up-to-dateness can result on the one hand from the frequency of the charging cycles (e.g. weekly instead of daily) or on the other hand from the delayed maintenance of the data in the already operational system (e.g. no regular reassessment of collateral) (Apel, Behme, Eberlein & Merighi, 2015). According to Gamble and Goble (2011) timeliness is defined as “a compar-ison of the date the annotation was updated with the consumer’s requirement” (Gamble & Goble, 2011). This quality dimension is important because it is possible to have current data but that is actually not suitable because it reflects a state of the current world that is too old for the specific use case. To guarantee that data will never become outdated, it should be ideally reported and recorded on a constant base as the source data values change over time (Rula, Palmonari, Harth, Stadtmüller & Maurino, 2012).
1.2.5.4 Validity
The term validity refers to the validity of the data collection. A data collection is valid if it measures what you wanted to measure. Thus, if it conforms to the syntax (format, type, range) of its definition. To ensure a fully functional SSBI, initial and ongoing data validation is important. A lack of data validation is a common error source and can even occur when an experienced team developed the BI model. A data model that is maintained on a contin-uous basis, reduces the likelihood of errors or inconsistent results. Thus, the contincontin-uous data validation leads to improved decision-making for the organization. However, a lack of data validation will lead to mistakes in the decision-making process, based on inaccuracies with the potential to impact the business, reputation and safety of the company (Burke, Simpson & Staples, 2016, p. 36).
1.2.5.5 Accuracy
Accuracy is also considered a very important criterion for data quality. This is about how exactly the data reflects the facts (Beutler, 2005). It means whether the values stored for an object have the correct values. To be accurate, a data value must be the correct value and must be represented in an unambiguous and consistent form. For example, the birthdate of a client is saved as 12. May 1974 and the personal data-base has the element DATE_BIRTH that expect dates in US format, so the date 05/12/1974 would be correct. A date 05/11/1974 would be inaccurate because it has the wrong value. A date of 12/05/1974 would be also incorrect because it is a European representation instead of a US format (Helfert, 2000, p. 64). Thus, accuracy is measured by how the values conform with an identified reference source of information that is free of error, such as comparing values against a database of record or with a set of data values from another table, checking against computed values or
20
it is also possible to apply a manual process to check value accuracy (Loshin, 2012, pp. 173– 174).
1.2.5.6 Consistency
The attribute values of a dataset have no logical contradictions among themselves or to other datasets. Inconsistent data within the operational systems lead to massive credibility prob-lems in the analytical systems (Apel, Behme, Eberlein & Merighi, 2015). This quality di-mension applies whenever a dataset is kept in more than one place. It is about ensuring that data values in one data set are consistent with the values in another data set (Loshin, 2012). For example, if there is an employee repository as the system of record for employee data and another system (like a monitoring stream) as a downstream replica, a periodic con-sistency check should be executed. Data can be evaluated for concon-sistency in view of its re-lation to other systems data, or even within the same system. For instance, a high-perfor-mance system that caches regular accessed data also runs the risk of potential issues in terms of consistency. All such controversies should be flagged through exception reporting and investigated, whether between or within systems. The process errors that caused the con-sistency issues to occur must also be investigated and fixed. Finding and fixing such prob-lems may require a few rounds of experimentation, but these are baseline requirements for an unbiased SSBI system (Cong, Fan, Geerts, Jia & Ma, 2007).
1.2.6 Challenges of SSBI
With the introduction of a SSBI in a company, several challenges may occur. The following chapter better describes these aspects.
Due to the relocation of tasks from the IT-department to the specialist departments, the usa-bility of the SSBI tools is an important basis for the acceptance of SSBI as a complete pack-age (Jooste, Biljon, Mentz & Jooste, 2014). It is an important challenge to ensure that a SSBI environment allows users to work efficiently with the tools. This means, a SSBIS needs to allow easy modeling, make access to data sources as easy as possible, ensure high perfor-mance and scalability for the delivery and use of user applications, as well as easy manage-ment and offer easy access to the finished applications. Moreover a possibility for user mod-ification of applications and reports should be provided (Imhoff & White, 2011, pp. 5–8). A prerequisite is the creation and provision of an adequate infrastructure and the necessary development environments (SSBI environment). This includes the availability of sufficient resources (including support staff) that should be easily expandable as their usage increases. Since different responsibilities for IT tasks are often defined within a company, the close cooperation and coordination of the IT departments responsible is extremely important. Monitoring, care and maintenance of the SSBI environment are tasks that should be fully accounted for and not casually understood (Lönnqvist & Pirttimäki, 2006).
21
Data provisioning and data governance are also fundamental requirements for enabling and promoting the use of self-service BI (Imhoff & White, 2011). In particular, data from trans-actional and operative systems is meant here. A business user who does not have access to the data needed, cannot use SSBI. Business users can benefit from easy access to data in this regard, i.e. the data should be easy to find and reach. User-friendly tools with access to var-ious data sources, are supportive. Usability is the foundation for the acceptance of a self-service tool in a company. Thus, it is a challenge to provide an understandable system for non-technical users as well as to provide easy access to the right data (Richardson, Schlegel, Sallam & Hostmann, 2009).
Previous experiences show that it is important to specify which kind of data can be made available to users. The data does not necessarily have to be in a so-called snowflake or star schema (Minelli, Chambers & Dhiraj, 2013). Even a freely accessible database (relational) has proven to be an adequate data access level. It can be problematic to just adopt, technical terms from an ERP, because casual users might not understand them. In this regard with the implementation of data governance, it can be ensured that the data is sufficiently enriched so when using the data, business users can be sure that they are also working with the data they need and want (Khatri & Brown, 2010). A first step may be the conversion of the tech-nical designations into defined "friendly names". When using data from other sources (In-ternet, etc.), in the context of data governance, it is necessary to create policies that define standards, such as typical names for data (Vercellis, 2009).
For access to the data, a security concept has to be developed which defines which depart-ments and users have access to which data. Often, a company has a lot of employees and not all of them have the same access rights. Thus, it is a challenge to implement the security concept into the SSBIS and guarantee all users the access they need.
Since companies are divided into several business areas, it must be discussed whether data can be accessed across different business units. This aspect potentially requires a differenti-ated consultation and coordination within the company (Horvath, 2001). In addition, training the specialist users and departments in how to use the application of the SSBI is essential (Gamble & Goble, 2011).
1.2.7 Success factors of SSBI
From the challenges several success factors for the successful implementation of a SSBIS can be derived. Usability is a principal factor for the acceptance of a self-service tool in a company's business intelligence processes. In addition to the usability, an adequate data management architecture and data governance are other success factors.
The use of self-service functions does not necessarily require the purchase of a special BI tool as a stand-alone solution. Often, the existing BI platforms in companies already offer
22
self-service functions. End-user-friendliness is a top priority for platform-based self-service functions (Imhoff & White, 2011).
1.2.7.1 Ease of use
As previously mentioned, the usability is one of the main success factors when it comes to the implementation of a SSBI. If the SSBI tool does not appeal to the business users, they will simply not use it. Whether a tool or system is user-friendly, can be determined by the following aspects:
- Equipment with role-specific functionalities (sales, marketing, finances etc.) - Simplicity in use
- The degree of flexibility and agility in generating reports on an ad-hoc and analytical basis
- User Interface / Surface Design (based on the familiar designs from known tools like Microsoft Office or apps)
- Individual search functions
- IT-independent access to various data
- Types of data visualization (graphics, corporate designs, etc.) - Collaboration features
- Availability of additional data (e.g. metadata)
The most important criteria for using a self-service tool is the provision of role-specific func-tionality. The key here is to address two groups in the company: on the one hand, the power users with their special know-how for analysis and reporting. On the other hand, the end users who use BI tools only to display reports and dashboards and, if necessary, conduct simple modifications (Kobielus, 2009). If the mentioned criteria for the users are fulfilled in a satisfactory manner, a high degree of user-friendliness of the SSBI system can be expected. If the ease of use factor is met, it is important to address topics such as data management and data governance. It is important for companies to define which data treatment, control and stability policies and procedures are defined in order to ensure the best possible provision of information and to ensure the best possible use for business processes (Isik, Jones & Si-dorova, 2011).
1.2.7.2 User requirements
Regardless of the solution approach - either using existing tools or implementing special self-service tools - users' requirements can in practice be divided into different categories: modifying reports and dashboards, creating ad hoc reports and dashboards, integrating pri-vate, local data and modifying data models. A SSBI solution must meet these user require-ments to be successful, thus they are an important success factor. The various aspects of the user requirements will be described below. Data governance is of great importance in all
23
cases because it represents the elementary basis for an adequate self-service strategy with regard to the control and monitoring of processes. It can allow the user to act as a data stew-ard, i.e. data manager, within the framework of given requirements and standard (Azvine, Cui, Nauck & Majeed, 2006).
1.2.7.3 Modifying reports and dashboards
The use of self-service tools supports users in the individual modification of reports and dashboards. Power users can filter according to their own key figures and structures and generate simple reports. With the preparation of analyses for a specific purpose, the users can operate independently and from these gain unique insights into the business processes. Furthermore, report customization can be easily carried out by calculation and creation of new figures, graphics and views. Consequently, self-service functions give users a higher degree of flexibility during report generation (Demirkan & Delen, 2013).
1.2.7.3.1 Creating ad hoc reports and dashboards
The creation of reports and dashboards is no longer the sole task of the IT department. With intuitive tools and predefined reports and dashboard objects, power users can now create ad-hoc reports and dashboards to support end users. The extension of ad ad-hoc functionalities by analytical functions, contributes to the user-friendliness of a solution. The advantage of this is that, for example, dashboards can be mapped according to the exact ideas of the user. A central, semantic layer is technically fundamental for the entire reporting process. This serves to encapsulate the complexity of technical data modeling for a business user and translate it into an understandable form. The number of connected data sources is not visible and is only presented to the end user as a kind of library with available data objects. This enables a much easier access to the many different data sources in a company (Berthold and other, 2010).
1.2.7.3.2 Integrating private, local data
Another success factor in the user requirements is the integration of independent private, local data. These are, for example, taken from Excel documents, TXT or CSV files or can come from externally provided data sources. There are three different ways of integrating this data. Firstly, data can be entered directly or together with other data into a data ware-house or other centralized and shared data stores. Data federation technologies can also en-able an architecture in which data remains in its original data sources (e.g. ERP systems) and does not have to be transferred to other data stores (e.g. data warehouse). The second way is to implement metadata of private, local data into one or more semantic layers. In the BI environment, the user has access to data that is centrally provided as well as to local data for their reports and analyses. Finally, local data can also be integrated directly into reports by linking the report data with local data via keys (Minelli, Chambers & Dhiraj, 2013).