Nitrogen and phosphorus uptake efficiency in Indian mustard cultivated during three
growth cycles in a copper contaminated soil treated with biochar
Eficiência de absorção de nitrogênio e fósforo em mostarda indiana cultivada por três ciclos sucessivos em um solo contaminado com cobre e tratado com biocarvão
Maria Isidória Silva Gonzaga1* Danyelle Chaves Figueiredo de Souza2 André Quintão de Almeida3
Cheryl Mackowiak4 Idamar da Silva Lima1 José Carlos de Jesus Santos1 Raquel Santos de Andrade1 ISSNe 1678-4596
INTRODUCTION
Use of biochar as soil amendment has been considered as an environmentally friendly strategy to improve soil fertility while reducing negative impacts caused by the inappropriate disposal of organic wastes. Effect of biochar on soil fertility is believed to
be related to its high porosity, surface area and CEC, which increase the soil retention capacity for water and nutrients. However, many other factors such as the biochar liming effect and the presence of a variety
of oxygenated functional groups make it difficult to predict all the benefits of biochar to plant growth and
productivity (NGUYEN et al., 2017), specially the
1Departamento de Engenharia Agronômica, Universidade Federal de Sergipe (UFS), 49100-000, São Cristóvão, SE, Brasil. E-mail:
[email protected]. *Corresponding author.
2Pós-graduação em Recursos Hídricos, Universidade Federal de Sergipe (UFS), São Cristóvão, SE, Brasil. 3Departamento de Engenharia Agrícola, Universidade Federal de Sergipe (UFS), São Cristóvão, SE, Brasil. 4North Florida Research and Education Center, University of Florida, Quincy, 32351, United States.
ABSTRACT: Biochar has been used worldwide as an efficient soil amendment due to its beneficial interaction with soil particles and nutrients; however, studies on the effect of biochar on the availability of nutrients such as N and P in tropical soils are still missing. The objective of the study was to evaluate the effect of different types and doses of biochars on the concentration and uptake of N and P in Indian mustard plants (Brassica juncea L.) grown in a Cu contaminated soil during three successive growth cycles. The greenhouse experiment was set up as randomized block design in a 3x3 factorial scheme, with 3 types of biochars (coconut shell, orange bagasse and sewage sludge) and three
rates of application (0, 30 and 60t ha-1), and 4 replicates. Biochar increased plant growth by approximately 30 to 224%; however, the orange
bagasse biochar was the most effective. Biochar reduced plant N concentration in approximately 15-43%, regardless of the rate of application, indicating the need to carefully adjust N fertilization. In the last growth cycle, biochar from coconut shell and orange bagasse improved the N uptake efficiency suggesting a better amelioration effect with ageing in soil. Biochar did not affect P nutrition in Indian mustard to a great extent; however, it significantly decreased the N:P ratio in the plant.
Key words: biochar, pyrogenic carbon, copper contamination, plant nutrition, Brassica juncea.
RESUMO: O biocarvão tem sido usado mundialmente como um eficiente insumo agrícola devido à sua interação benéfica com as partículas e os nutrientes do solo. Contudo, seu efeito na disponibilidade de nutrientes como N e P em solos tropicais tem sido pouco investigado. O objetivo do estudo foi avaliar o efeito de diferentes tipos e doses de biocarvão na concentração e na eficiência de absorção de N e P em plantas de mostarda indiana (Brassica juncea L.) cultivadas em solo contaminado com cobre, em três ciclos sucessivos de cultivo. O estudo foi desenvolvido em delineamento de blocos casualizados, em esquema fatorial 3x3, em casa de vegetação, com três tipos de biocarvão (casca
de coco, bagaço de laranja e lodo de esgoto) e três doses (0, 30 e 60t ha-1). Todos os biocarvões aumentaram o crescimento das plantas, com
variação de 30 a 224%. No entanto, o biocarvão de bagaço de laranja foi o mais eficiente. A presença de biocarvão reduziu a concentração de N nas plantas em torno de 14 a 43%, independente da dose aplicada, indicando a necessidade de monitoramento mais cuidadoso da fertilização nitrogenada. Os biocarvões de casca de coco e bagaço de laranja melhoraram a eficiência da planta na absorção de N no terceiro ciclo de cultivo, indicando melhor efeito com o tempo de contato como o solo. O uso de biocarvão teve pouca influência na nutrição fosfatada na mostarda indiana, mas diminuiu significativamente a relação N:P.
Palavras-chave: biocarvão, carbono pirogênico, contaminação com cobre,nutrição de planta, Brassica juncea.
effect of biochar on the behavior of N and P in the soil and in the plant (KAMMANN et al., 2015; DEENIK & COONEY, 2016).
Nitrogen and P are very important plant macronutrients and their availability in soil as well as their interaction limits plant growth (GROOT et al., 2003). Studies about the effect of biochar on the availability of N in soil have generated many contradictory results varying from positive, negative and even no effect (CLOUGH et al., 2013; RAHMAN et al., 2013; NGUYEN et al., 2017). The same different outcomes are observed during the evaluation of the effects of biochar on plant N absorption (SAARNIO et al., 2013). Additionally, biochar has also been related to changes in the P cycle in highly weathered acidic soils (ABDELHAFEZ et al., 2017), where the availability of P is mostly controlled by the presence of reactive Al and Fe surfaces that present
high affinity for P at low soil pH, causing P to be
chemically adsorbed and leading to low agronomic
P use efficiency (ANTONIADIS et al., 2015). In that
case, the liming effect of biochar to certain extent can increase P availability by reducing P adsorption (VANEK & LEHMANN, 2015).
Plant growth in metal contaminated soils can be seriously impaired not only by high concentrations of heavy metals but also by availability of nutrients and nutritional status, including heavy metal tolerant ones such as Indian mustard (MOURATO et al., 2015) that are often used as food crop as well as to remediate contaminated soils (RODRÍGUEZ-VILA et al., 2015). Therefore, the objective of this study was to evaluate the concentration of N and P in plant
tissue as well as N and P use efficiency in Indian
mustard plants cultivated in a copper contaminated soil and treated with different types and doses of biochar, during three successive growth cycles.
MATERIALS AND METHODS
Soil and biochar characterization
Soil was collected in the 0-0.20m layer from a
fallow field at the Universidade Federal de Sergipe (UFS)
experimental station, Northeast Brazil (about S 10º 55’
46”; N 37º 06’ 13”). The soil was classified as Argissolo
Amarelo (SANTOS et al., 2013), (Ultisol, according to SOIL SURVEY STAFF (2014)) and presented the following characteristics: pH: 4.64, organic carbon: 11.6g kg-1, CEC: 1.88cmol kg-1, P: 1.82mg kg-1, K: 25.4mg kg-1,
total Cu: 100mg kg-1. Physical properties were: Sand: 72%,
Silt: 13%, Clay: 15% (DAY, 1965).
The biochars were produced from coconut shell, orange bagasse and sewage sludge in a slow pyrolysis reactor, at 500oC. Biochar was ground,
sieved to 2mm particle size and evaluated through
proximate analysis (Ash, volatile matter and fixed C),
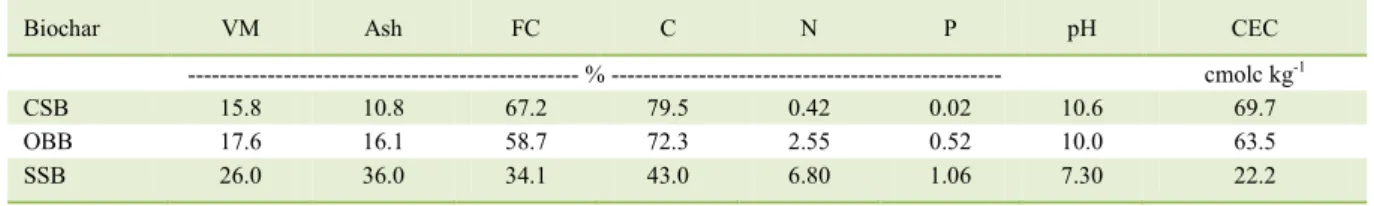
and ultimate analysis (C, N, H and O) according to the American Society for Testing and Materials (ASTM) D1752-84. Elemental composition of C, H, and N was determined using an elemental analyzer. Cation exchange capacity was determined by ammonium acetate method (THOMAS, 1982). Biochar pH and electrical conductivity were also determined. Biochar characteristics are presented in table 1.
Experimental set up
The experiments were carried out in a greenhouse environment at a temperature of 28oC
and as a completely randomized design in a 3x3 factorial scheme, with 4 replicates. Treatments were three types of biochar (coconut shell-CSB; orange bagasse – OBB; and sewage sludge – SSB) and three rates of application (0, 30 and 60t ha-1). Experimental
units were comprised of 5L plastic pots. Soil was spiked with copper sulfate three months prior the experiment. Biochar (37,5g or 75g) was mixed with the contaminated soil (3.5kg), transferred to pots,
watered to field capacity and incubated during one
week before planting in order to equilibrate. One healthy Indian Mustard seedling with four leaves was transferred to each pot and allowed to grow for 60 days. Plants were watered throughout the study to keep the
soil at approximately 70% of its field capacity. Indian
mustard plants were cultivated for three successive growth cycles (April to June; June to August; August to October, 2016). At the beginning of each growth
Table 1 - Characteristics of biochars.
Biochar VM Ash FC C N P pH CEC
--- % --- cmolc kg-1
CSB 15.8 10.8 67.2 79.5 0.42 0.02 10.6 69.7
OBB 17.6 16.1 58.7 72.3 2.55 0.52 10.0 63.5
cycle, 1g of mineral fertilizer (osmocote:14-14-14) was applied to each pot.
Before harvesting, chlorophyll content of the mid-section, fully expanded leaves was measured,
using a non-modulated fluorimeter OS-30P model (ADC BioScientific Ltd., UK). After each harvesting,
plants were washed with tap water, rinsed with DI water and dried in a 60oC oven for approximately
48 hours, weighed for the determination of the dry biomass and ground to pass through a 2mm screen for N and P analysis. Samples were digested in a hot block digestion system, according to the TKN protocol for N determination (BREMNER, 1996). Total P concentration in plant samples was determined in the TKN extracts using the molybdenum blue method (MURPHY & RILEY 1962). Soil samples were collected at the beginning of each growth cycle from each experimental pot, dried, sieved to 2mm screen and analyzed for pH, EC, organic C and concentration of extractable Cu, N, P, K and Na. Soil pH was determined in a 1:5 (w/w) biochar:water ratio after 1.5h shaking in a reciprocating shaker and 1h equilibration. Concentrations of extractable Cu, P, K and Na were determined following extraction with 1% citric acid (WU et al., 2004). Soil plant available
N was extracted with 2M KCl. The uptake efficiency
of N or P was calculated by dividing N or P uptake by the root biomass dry weight (GOOD et al., 2004).
Statistical analysis
Statistical analysis was performed separately on each crop cycle because the experiments were not run concurrently. Results are reported as the means of four replicates. Data obtained were subjected to two-way Analysis of Variance (ANOVA)
for assessing the significance of quantitative changes
in the variables as a result of biochar treatments using SISVAR software package (FERREIRA, 2011).
When a significant difference was observed between
treatments, multiple comparisons were made by the Tukey-test at P<0.05.
RESULTS AND DISCUSSION
Effect of biochar in plant biomass
Application of biochar significantly
(P<0.05) increased plant biomass in all growth cycles (Table 2); however the effects varied with biochar type
and rates of application. In the first and third growth
cycles, biochar from coconut shell increased plant biomass by approximately 50 and 32%, regardless of the rate of application. In the second growth cycle, the increase was according to the rate of application, being 100% (30t ha-1) and 224% (60t ha-1). The OBB
was more effective in increasing plant biomass in all growth cycles, varying from 168% (GC1), 148-191% (GC2, 30t ha-1 and 60t ha-1, respectively) and 60%
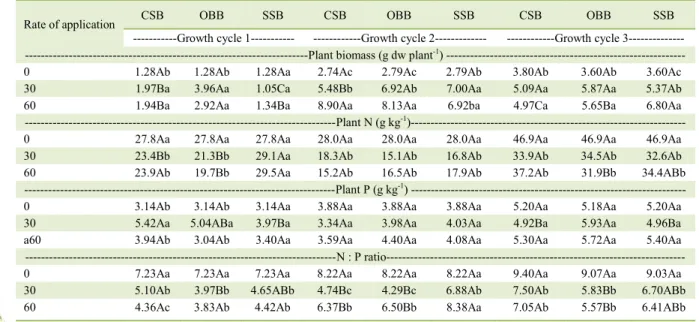
Table 2 - Biomass and concentration of N and P in the shoot of Indian mustard plants after growing in the copper contaminated soil treated with biochar from coconut shell (CSB), orange bagasse (OBB) and sewage sludge (SSB). Means followed by same letter
(uppercase in a row; lowercase in a column) are not significantly different (P < 0.05) for comparisons made within each crop
cycle (n = 4 per treatment).
Rate of application CSB OBB SSB CSB OBB SSB CSB OBB SSB
---Growth cycle 1--- ---Growth cycle 2--- ---Growth cycle 3--- ---Plant biomass (g dw plant-1) ---
0 1.28Ab 1.28Ab 1.28Aa 2.74Ac 2.79Ac 2.79Ab 3.80Ab 3.60Ab 3.60Ac
30 1.97Ba 3.96Aa 1.05Ca 5.48Bb 6.92Ab 7.00Aa 5.09Aa 5.87Aa 5.37Ab
60 1.94Ba 2.92Aa 1.34Ba 8.90Aa 8.13Aa 6.92ba 4.97Ca 5.65Ba 6.80Aa
---Plant N (g kg-1)---
0 27.8Aa 27.8Aa 27.8Aa 28.0Aa 28.0Aa 28.0Aa 46.9Aa 46.9Aa 46.9Aa
30 23.4Bb 21.3Bb 29.1Aa 18.3Ab 15.1Ab 16.8Ab 33.9Ab 34.5Ab 32.6Ab
60 23.9Ab 19.7Bb 29.5Aa 15.2Ab 16.5Ab 17.9Ab 37.2Ab 31.9Bb 34.4ABb
---Plant P (g kg-1) ---
0 3.14Ab 3.14Ab 3.14Aa 3.88Aa 3.88Aa 3.88Aa 5.20Aa 5.18Aa 5.20Aa
30 5.42Aa 5.04ABa 3.97Ba 3.34Aa 3.98Aa 4.03Aa 4.92Ba 5.93Aa 4.96Ba
a60 3.94Ab 3.04Ab 3.40Aa 3.59Aa 4.40Aa 4.08Aa 5.30Aa 5.72Aa 5.40Aa
---N : P ratio---
0 7.23Aa 7.23Aa 7.23Aa 8.22Aa 8.22Aa 8.22Aa 9.40Aa 9.07Aa 9.03Aa
30 5.10Ab 3.97Bb 4.65ABb 4.74Bc 4.29Bc 6.88Ab 7.50Ab 5.83Bb 6.70ABb
(GC3). The effect of the SSB on plant biomass was only observed in the GC2 (150%) and GC3 (50% and 90%, for 30t ha-1 and 60t ha-1, respectively), confirming the beneficial effect of this biochar as reported by
SILVA et al. (2017). Biochar effect in increasing plant growth was probably due to the amelioration effect in the contaminated soil by increasing soil pH and the availability of some nutrients such as P and K which
was confirmed in the study of DEENIK & COONEY
(2016) when corn cob and sewage sludge biochar was applied to an oxisol. The authors observed that biochars in combination with fertilizer doubled plant
growth compared to the control in the first crop cycle produced no significant effect in the second cycle,
and more than tripled plant growth for the sewage sludge biochar in the third cycle. In the present study,
plants presented poor growth in the first cycle due to
a problem in the greenhouse.
Effect of biochar in N nutrition
The increase in plant biomass caused by the presence of biochar was not followed by an increase in the concentration of N in the plant aboveground part, which varied from 15.1 - 46.9g kg-1. Considering
that the concentration of N commonly ranges from 23.9 - 55.1g kg-1 for plants of the Brassica genus, the
presence of biochar, especially in the GC2, caused a reduction in N concentration below the lower limit in most plants. In fact, all biochars reduced plant N (Table 2) in approximately 15-43%, regardless of the rate of application, which could be observed by the chlorotic appearance of leaves. Considering that all
the plants were equally fertilized with N, the yellow discoloring of the leaves observed in the treatments with biochar is supposed to be related to the effect of biochar on the fate of N and not to the effect of the high Cu concentration in the contaminated soil. Therefore, N fertilization in soils treated with biochar should be a concern. Reduction in plant N
concentration due to biochar was also confirmed by
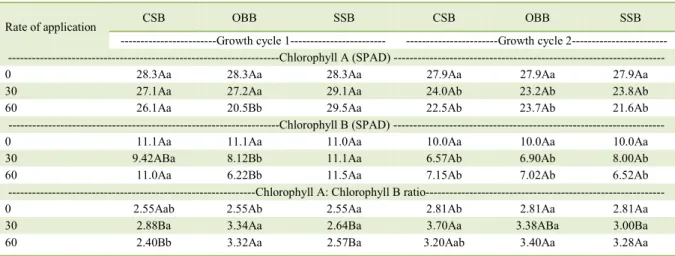
the reduction in the chlorophyll content (Table 3) and could have been a result of the improved growth and consequently increased demand for this essential macronutrient. ARGENTA et al. (2004) also reported good correlations between plant N and Chlorophyll content in maize plants.
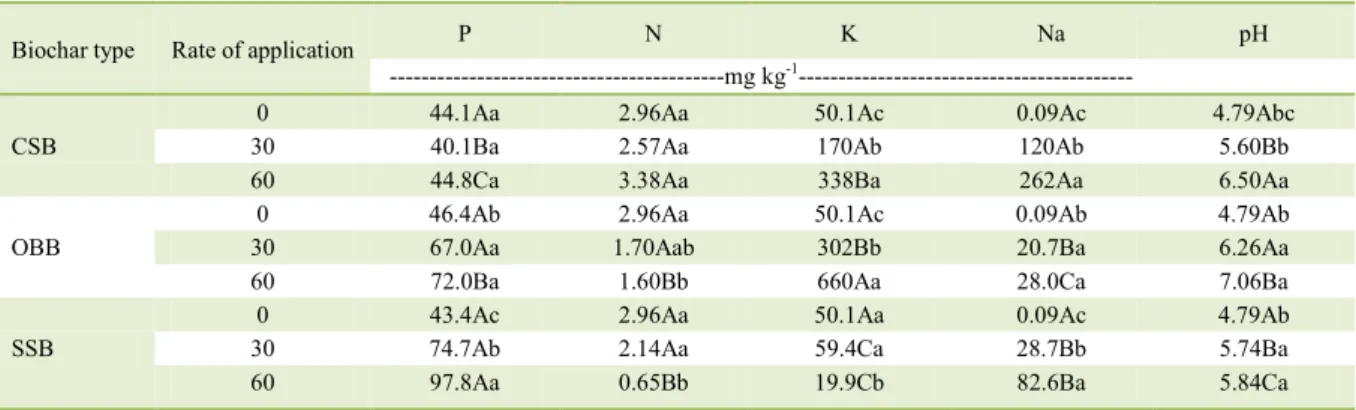
Additionally, it was reported that during the ageing of biochar in the soil, NO3-N chemisorption through H-bonding may be enhanced because biochar becomes more hydrophilic (HAMMES & SCHMIDT, 2009); however, in the present study, the evaluation of N availability through KCl extraction showed little
influence of the biochars (Table 4), except in the OBB treatment which significantly decreased extractable
N. This effect could also be related to the increase in pH when the OBB was applied to soil (Table 4), leading to N loss through volatilization (NGUYEN et al., 2017). Therefore, different biochars may likely
influence different mechanisms of N interaction in
soil for which more investigation is needed.
The evaluation of the N uptake efficiency
(NUE) showed a huge variation in the treatments
among growth cycles (Figure 1). In the first GC,
when biochar was recently incorporated to the soil,
Table 3 - Chlorophyll A, Chlorophyll B and ChloA/ChloB ratio of Indian mustard plants after growing in the copper contaminated soil treated with biochar from coconut shell (CSB), orange bagasse (OBB) and sewage sludge (SSB). Means followed by same letter
(uppercase in a row; lowercase in a column) are not significantly different (P < 0.05) for comparisons made within each crop
cycle (n = 4 per treatment).
Rate of application CSB OBB SSB CSB OBB SSB
---Growth cycle 1--- ---Growth cycle 2--- ---Chlorophyll A (SPAD) ---
0 28.3Aa 28.3Aa 28.3Aa 27.9Aa 27.9Aa 27.9Aa
30 27.1Aa 27.2Aa 29.1Aa 24.0Ab 23.2Ab 23.8Ab
60 26.1Aa 20.5Bb 29.5Aa 22.5Ab 23.7Ab 21.6Ab
---Chlorophyll B (SPAD) ---
0 11.1Aa 11.1Aa 11.0Aa 10.0Aa 10.0Aa 10.0Aa
30 9.42ABa 8.12Bb 11.1Aa 6.57Ab 6.90Ab 8.00Ab
60 11.0Aa 6.22Bb 11.5Aa 7.15Ab 7.02Ab 6.52Ab
---Chlorophyll A: Chlorophyll B ratio---
0 2.55Aab 2.55Ab 2.55Aa 2.81Ab 2.81Aa 2.81Aa
30 2.88Ba 3.34Aa 2.64Ba 3.70Aa 3.38ABa 3.00Ba
NUE varied from 0.57 to 0.80g N plant-1 g root-1, and only the OBB reduced the plant efficiency in taking
up N. The NUE was greatly reduced in the second GC in all treatments, including the control, varying from 0.08 to 0.18g N plant-1 g root-1; however, this time
all biochars caused reduction in the capacity of the plant to absorb N, except for CSB at 30t ha-1 and OBB
at 60t ha-1. In the third GC, all biochars increased in
approximately 80% the values of NUE, varying from 0.2 to 0.5g N plant-1 g root-1, except the SSB when
applied at a rate of 30t ha-1.
Effect of biochar in P nutrition
The concentration of P in the shoot varied from 3.40 to 5.93g kg-1 (Table 2). Biochar
did not affect P nutrition in Indian mustard, except for the CSB and OBB applied at a rate of 30t ha
-1, in the first GC, which increased P concentration
in the aboveground biomass by approximately 72% and 61%, respectively. These results are not likely related to the concentration of citric acid extractable P in the soil since application of CSB had no effect on P availability, regardless of the increase in soil pH caused by this biochar. In fact, application of OBB and SSB even increased the concentration of extractable P (Table 4), which could be related not only to the increase in soil pH but also to the concentration of P in the biochar (Table 1). A reasonable explanation for the lack of plant response related to P nutrition is the lower P requirement by Indian mustard plants which have higher demand for N.
The plant efficiency in taken up P greatly
varied among growth cycles (Figure 1), from 0.09-0.14g P plant-1 g root-1 (GC1), 0.02-0.03g P plant-1 g
root-1 (GC2) and 0.02-0.10g P plant-1 g root-1 (GC3). CSB and OBB significantly (P<0.05) increased P uptake efficiency (PUE), regardless of the rate of application. SSB had low influence on the PUE.
Effect of biochar on the N:P ratio in the plant
Biochar addition to soil significantly
(P<0.05) reduced the N:P ratio in the plants, regardless of the type and rate of application (Table 2). In the control treatment, N:P ratio varied from 7.23 to 9.04 across the three growth cycles whereas in the biochar treatments this variation was from 3.83 to 8.38, with mean values of 5.85, 5.00 and, 6.24 for CSB, OBB and SSB, respectively, with lowest values mostly associated with the OBB. According to GARRISH et al. (2010), the N:P ratio is an effective tool to evaluate the availability of these nutrients to plants; values < 14 indicates N limitation whereas values > 16 are a sign of P restriction to plant productivity. Therefore,
our values confirmed N limitation in plants treated
with biochar.
CONCLUSION
All biochars increased plant growth and reduced plant N concentration; however, the most effective was the orange bagasse biochar, indicating the need for a more cautious management of the N fertilization. Biochar increased plant N uptake efficiency which could explain the improved plant growth.
Even though biochar from orange bagasse and sewage sludge increased the availability of P in soil, no biochar influenced plant P nutrition, regardless of the increase in pH
Table 4 - Extractable concentrations of P, N, K and Na, pH and EC in the copper contaminated soil treated with biochar from coconut shell (CSB), orange bagasse (OBB) and sewage sludge (SSB). Uppercase letters compare means among different biochars at the same dose. Lowercase letters compare means among different doses at the same biochar type ((P < 0.05) (n = 4 per treatment).
Biochar type Rate of application P N K Na pH
---mg kg-1---
CSB
0 44.1Aa 2.96Aa 50.1Ac 0.09Ac 4.79Abc
30 40.1Ba 2.57Aa 170Ab 120Ab 5.60Bb
60 44.8Ca 3.38Aa 338Ba 262Aa 6.50Aa
OBB
0 46.4Ab 2.96Aa 50.1Ac 0.09Ab 4.79Ab
30 67.0Aa 1.70Aab 302Bb 20.7Ba 6.26Aa
60 72.0Ba 1.60Bb 660Aa 28.0Ca 7.06Ba
SSB
0 43.4Ac 2.96Aa 50.1Aa 0.09Ac 4.79Ab
30 74.7Ab 2.14Aa 59.4Ca 28.7Bb 5.74Ba
of this acidic soil. This was probably related to the plant species itself and its lower demand for P than for N.
Considering that the plants had poor
growth in the first cultivation cycle and; therefore,
should not be taken into account, the effect of
biochar on the plant N and P use efficiency seemed
to improve as biochar aged in the soil from the second to the third cycle.
ACKNOWLEDGMENTS
We thank the Coordenação de Aperfeiçoamento de Pessoal de Nível Superior (CAPES) for supporting our research.
Figure 1 - N (a) and P (b) uptake efficiency of Indian mustard plants after growing in the copper contaminated
soil treated with 30 and 60t ha-1 of biochar from coconut shell (CSB), orange bagasse (OBB) and
CONFLICTS OF INTEREST
The authors declare no conflict of interest. The
founding sponsors had no role in the design of the study; in the collection, analyses, or interpretation of data; in the writing of the manuscript, and in the decision to publish the results.
AUTHORS’ CONTRIBUTIONS
The authors contributed equally to the manuscript.
REFERENCES
ABDELHAFEZ, A.A. et al. The black diamond for soil sustainability, contamination control and agricultural production. In: Huang, W.J. (ed.), Engineering applications of biochar. InTech, Chapter 2. 2017, 90p. Available from: <http://www.intechopen.com/embed/engineering-applications- of-biochar/biochar-the-black-diamond-for-soil-sustainability-contamination-control-and-agricultural-production>. Accessed: Oct. 26, 2017. doi: 10.5772;intechopen.68803.
ANTONIADIS, V. et al. Phosphorus availability in low-P and acidic soils as affected by liming and P addition. Communications in Soil Science and Plant Analysis, v.46, n.10, p.1288-1298, 2015. Available from: <http://dx.doi.org/10. 1080/00103624.2015.1033539>. Accessed: Oct. 20, 2017.
ARGENTA, G. et al. Leaf relative chlorophyll content as an indicator parameter to predict nitrogen fertilization in maize. Ciência Rural, v.34, n.5, p.1379-1387, 2004. Available from: <http://dx.doi.org/10.1590/S0103-84782004000500009>. Accessed: Jul. 23, 2017.
BREMNER, J.M. Nitrogen total. In: SPARKS, D.L. (ed). Methods of soil analysis. Part 3. Madison, America Society of Agronomy, Madison, 1996. p.1085-1121.
CLOUGH, T.J. A review of biochar and soil nitrogen dynamics. Agronomy, v.3, n.2, p.275-293, 2013. Available from: <https:// www.mdpi.com/2073-4395/3/2/275/pdf>. Accessed: Oct. 13, 2017. doi: 10.3390/agronomy3020275.
DAY, P. R. Particle fractionation and particle-size analysis. In: BLACK, C.A. et al. ed. Methods of Soil Analysis. Part 2. Chemical and Microbiological Properties. American Society of Agronomy, Madison, 1965. pp. 1367–1378.
DEENIK,J.L.; COONEY, M.J. The Potential Benefits and
Limitations of Corn Cob and Sewage Sludge Biochars in an Infertile Oxisol. Sustainability, v.8, n.131, p.1-18, 2016. Available from: <https://www.mdpi.com/2071-1050/8/2/131/ pdf>. Accessed: Jun. 10, 2017. doi: 10.3390/su8020131.
FERREIRA, D.F. Sisvar: a computer statistical analysis system. Ciência e Agrotecnologia, v.35, p.1039-1042, 2011. Available from: <www.scielo.br/scielo.php>. Accessed: Oct. 10, 2017. doi: 10.1590/S1413-70542011000600001.
GARRISH, V. et al. Nitrogen to phosphorus ratio of plant biomass versus soil solution in a tropical pioneer tree, Ficus insipida. Journal of Experimental Botany, v.61, n.13, p.3735-3748, 2010. Available from: <https://www.ncbi.nlm.nih.gov/pmc/articles/ PMC2921206>. Accessed: Jul. 11, 2017. doi: 10.1093/jxb/erq183.
GOOD, A.G. et al. Can less yield more? Is reducing nutrient input into the environment compatible with maintaining crop production? Trends in Plant Science, v.9, n.12, p 597-605, 2004. Available from: <https://www.ncbi.nlm.nih.gov/ pubmed/15564127>. Accessed: Oct. 10, 2017. doi: 10.1016/j. tplants.2004.10.008.
GROOT, C.C.et al. Interaction of nitrogen and phosphorus nutrition in determining growth. Plant and Soil, v.248, n.1, p.257–268, 2003. Available from: <jpkc.scau.edu.cn/soilless/ papers/upload/2012102722454790725.pdf>. Accessed: Oct. 12, 2017. doi: 10.1023.
HAMMES, K.; SCHMIDT, M.W.I. Changes of biochar in soil. In: LEHMANN, J.; JOSEPH, S. Biochar for Environmental Management. Earthscan, London, 2009. pp 169–182.
KAMMANN, C. I. et al. Plant growth improvement mediated by nitrate capture in co-composted biochar. Scientific Reports, v.5, n.11080, p.1-13, 2015. Available from: <https://www.
nature.com›scientificreports›articles>. Accessed: Oct 12, 2017. doi: 10.1038/srep11080.
MOURATO, M. P. et al. Effect of heavy metals in plants of the genus Brassica. International Journal of Molecular Science. v.16, n.1, p.17975–17998, 2015. Available from: <https:// www.ncbi.nlm.nih.gov/pubmed/26247945>. Accessed: Sept.
9, 2017. doi: 10.3390/ijms160817975.
MURPHY, J. A.; RILEY, J. P. A modified single solution method for the determination of phosphate in natural waters. Analytica chimica acta, v. 27, n.1, p.31-36, 1962. Available from: <https://www.sciencedirect.com/science/ article/pii/S0003267000884445>. Accessed: Apr. 02, 2017. doi: 10.1016/S0003-2670(00)88444-5.
NGUYEN, T.T.N. et al. Effects of biochar on soil available inorganic nitrogen: A review and meta-analysis. Geoderma, v.288, n.1, p.79-96, 2017. Available from: <https://www. sciencedirect.com/science/article/pii/S0016706116307388>. Accessed: Oct. 25, 2017. doi: 10.1016.
RAHMAN, M.M. et al. Enhanced Accumulation of Copper and Lead in Amaranth (Amaranthus paniculatus), Indian Mustard (Brassica juncea) and Sunflower (Helianthus annuus). PLOS
one, v.8, n.5, p. 1-9, 2013. Available from: <https://journals. plos.org/plosone/article?id=10.1371/journal.pone.0062941>. Accessed: Apr. 06, 2017. doi:10.1371.
RODRÍGUEZ-VILA, A. et al. Recovering a Cu mine soil using organic amendments and phytomanagement with Brassica
juncea L. Journal of environmental management, v. 147,
n.1, p.73-80, 2015. Available from: <https://www.ncbi.nlm. nih.gov/pubmed/25262389> Accessed: Oct. 20, 2017. doi: 10.1016/j.jenvman.2014.09.011.
SAARNIO, S. et al. Biochar addition indirectly affects N2O emissions via soil moisture and plant N uptake. Soil Biology and Biochemistry, v.58, n.1, p.99–106, 2013. Available from: <https://www.sciencedirect.com/science/ article/pii/S0038071712004142>. Accessed: Oct. 13, 2017. doi: 10.1016/j.soilbio.2012.10.035.
SILVA, M.I. et al. Potential impacts of using sewage sludge biochar on the growth of plant forest seedlings. Ciência Rural, v.47, n.1, p. 1-5, 2017. Available from: <www.scielo.br/scielo.php?script=sci_ arttext&pid=S0103-8478201700010040>. Accessed: Oct. 13, 2017. doi: 10.1590/0103-8478cr20160064.
SOIL SURVEY STAFF. Keys to Soil Taxonomy. 12. ed. Soil Survey Laboratory. National Soil Survey Center. USDA-NRCS, Lincoln, NE. 2014.
THOMAS, G.W. Exchangeable cations. In: PAGE, A.L. et al. (Eds.), Methods
of soil analysis: Chemical methods. Part 2: Chemical and Microbiological Properties. American Society of Agronomy, Madison, 1982. pp.159–165.