Paula Alexandra Rodrigues e Araújo Guedes
Licenciada em Química
Mestre em Química (Ramo Cientifico)
Electrokinetic treatment of environmental
matrices. Contaminants removal and
phosphorus recovery.
Dissertação para obtenção do Grau de Doutor em
Ambiente
Orientador: Professora Doutora Alexandra de Jesus Branco Ribeiro,
Professora Associada com Agregação, Faculdade de
Ciências e Tecnologia da Universidade Nova de Lisboa
Co-orientador:
Doutor Eduardo Manuel Hipólito Pires Mateus,
Investigador, CENSE; Técnico Superior, Faculdade de
Ciências e Tecnologia da Universidade Nova de Lisboa
Presidente: Prof. Doutora Maria Rosa Santos de Paiva Arguente(s): Prof. Doutora Sibel Pamukcu
Doutora Célia Maria Dias Ferreira
Vogais: Prof. Doutora Cristina Maria Barrocas Dias
Prof. Doutora Maria Margarida da Cruz Godinho Ribau Teixeira Prof. Doutor António Manuel Fernandes Rodrigues
Electrokinetic treatment of environmental matrices. Contaminants removal and phosphorus recovery.
Copyright © Paula Alexandra Rodrigues e Araújo Guedes, Faculdade de Ciências e Tecnologia, Universidade Nova de Lisboa.
“No profit grows where is no pleasure ta'en. In brief, sir, study what you most affect.”
PREFACE
This dissertation is submitted as partial fulfilment of the requirements for the Doctoral Degree in
Environment and includes the results of my Ph.D. study carried out from March 2012 to July 2015 in the
Faculty of Sciences and Technology, Universidade NOVA de Lisboa, with stays abroad as visiting
researcher in the Department of Civil Engineering, Technical University of Denmark (DTU), Lyngby,
Denmark (June-September 2012), in the Key Laboratory of Soil Environment and Pollution Remediation,
Institute of Soil Science, Chinese Academy of Sciences, Nanjing, China (October 2012-February 2013)
and in the Department of Chemical Engineering, Málaga University, Málaga, Spain (May-September
2014).
The dissertation is organized as follows:
Part I includes:
Section I - provides all the summarized information regarding the problem statement, motivation and the objectives of the work.
Section II - includes the description of material as methods used during this Ph.D.
Section III - compiles the major findings of the experimental work and examines some limitations.
Section IV - outlines the main conclusions and identifies future areas of research.
Appendices
Part II includes all the papers (organized by matrix) published or submitted during this Ph.D. study:
o Couto N, Guedes P, Zhou D-M, Ribeiro AB (2015)Integrated perspectives of a greenhouse
study to upgrade an antimony and arsenic mine soil – potential of enhanced phytotechnologies,
Chemical Engineering Journal, 262, pp. 563-570, DOI: 10.1016/j.cej.2014.09.021.
o Guedes P, Mateus EP, Couto N, Rodríguez Y, Ribeiro AB (2014) Electrokinetic remediation of six emerging organic contaminants from soil, Chemosphere, pp. 117, pp. 124–131, DOI: 10.1016/j.chemosphere.2014.06.017.
o Couto N, Guedes P, Mateus EP, Santos C, Teixeira MR, Nunes LM, Hansen HK, Gutierrez C,
Ottosen LM, Ribeiro AB (2013) Phosphorus recovery from a water reservoir - potential of
nanofiltration coupled to electrodialytic process, Waste and Biomass Valorization, 4(3), pp.
o Couto N, Guedes P, Ferreira AR, Teixeira MR, Mateus EP, Ribeiro AB (2015) Electrodialytic
process of nanofiltration concentrates - phosphorus recovery and microcystins removal,
Electrochimica Acta, 181, pp. 200-207, DOI: 10.1016/j.electacta.2015.04.081.
o Guedes P, Couto N, Ottosen LM, Ribeiro AB (2014) Phosphorus recovery from sewage sludge
ash through an electrodialytic process, Waste Management, 34(5), pp. 886-892, DOI:
10.1016/j.wasman.2014.02.021.
o Guedes P, Couto N, Ottosen LM, Kirkelund GM, Ribeiro AB (submitted) Valorization of ferric sewage sludge ashes: potential as a phosphorus source.
o Guedes P, Magro C, Couto N, Mosca A, Mateus EP, Ribeiro AB (2015) Potential of the
electrodialytic process for emerging organic contaminants remediation and phosphorus
separation from sewage sludge, Electrochimica Acta, 181, pp. 109-117, DOI:
10.1016/j.electacta.2015.03.167.
o Guedes P, Mateus EP, Almeida J, Ferreira AR, Couto N, Ribeiro AB (submitted) Electrodialytic treatment of fresh sewage sludge: current intensity influence on phosphorus recovery and
organic contaminants removal.
I hereby declare that, as the first or second author of the above mentioned manuscripts, I provided the
major contribution to the research and experimental work developed, to the results interpretation and
the preparation of these publications submitted during the Ph.D. project. The copyright of the
publications was transferred to the editors, and these articles are reproduced with permission of the
original publishers and subject to copy restrictions imposed by them.
The following papers are under preparation for submission:
o Couto N, Guedes P, Fan G, Zhou D-M, Ribeiro AB, Enhanced-electrokinetic remediation of arsenic-antimony co-contaminated soil – suitability of phosphate amendment and pH control
o Guedes P, Rodrigues A, Almeida J, Couto N, Mateus EP, Ribeiro AB, Electrodialytic treatment
ACKNOWLEDGMENTS
I would like to express my deepest gratitude to my advisors, Alexandra Ribeiro and Eduardo Mateus for
their excellent guidance, patience, continuous support and for providing me with an excellent
atmosphere for doing research. Thank you so much!
I had the opportunity to work with top research groups around the world and I would like to thank:
o Lisbeth M. Ottosen, Gunvor Kirkelund, Ebba Schnell, Sabrina Madsen and Christina W. Dufke
from the Department of Civil Engineering, Technical University of Denmark (DTU), Denmark;
o Dong-Mei Zhou, Yujun Wang, Wenxiu Qin, Xiaodan Cui, Chengcheng Li and Guangping Fan
from the Key Laboratory of Soil Environment and Pollution Remediation, Institute of Soil
Science, Chinese Academy of Sciences (ISSCAS), China;
o José Miguel Rodríguez-Maroto, Francisco García Herruzo, César Goméz-Lahoz from the
Department of Chemical Engineering, Málaga University, Spain;
for being so welcoming and friendly, for providing me good conditions to carry my work and for sharing
their experience and knowledge. I want to express my sincere appreciation for their help and availability.
It was my pleasure to meet you and work with you all!
I am very grateful to Professor António Rodrigues who took his time to introduce me to the
microbiological world, and all the enthusiasm, patience and help during the analysis of the sewage
sludge microbial community. A special thanks goes also to Professor Conceição Santos and Maria Luísa
Caldeira for all their help with phosphorus colorimetric analysis.
To Nazaré Couto for the stimulating discussions during a cup of coffee, the sleepless nights working
together before deadlines, and for all the fun we had while working around the world in the last (almost)
four years.
Many thanks to Ana Rita Ferreira for her friendship and help during the work with the membrane
concentrate and for being always present and helping whenever it was needed! I would also like to thank
Cátia Magro for the friendship and help during the sewage sludge initial experiments. My thanks go also
to Joana Almeida that in the ambit of her Master Thesis (Enviromental Engineering, FCT/UNL)
participated in the last sewage sludge experiments. Indeed the good mood helped throughout this work!
I am also grateful to Alice Mosca for all the help during the HPLC method development and for sharing
her knowledge on methods validation. I would also like to thank María Villén Guzmán and Yadira
Rodríguez from the Department of Chemical Engineering, Málaga University, Spain, for their enthusiasm
and availability during their exchange program in Portugal. To all my laboratory colleagues Helena
Gomes, Joana Pinto, Davide Mendes, Sofia Branco, Mónica Almeida and Hugo Ferreira for the excellent
I would also like to thank Rosa Paiva, Marco Silva, Margarida Gonçalves, Ana Luísa Fernando, Maria
José Correia, Nuno Lapa, João Lima and Luís Cabrita for granting me access to their laboratories and
equipments whenever it was needed. EPAL, namely Eng. Alexandre Rodrigues, is acknowledged for
giving me the opportunity to do some experimental LC/MS analyses in their facilities.
The Associação Nacional de Farmácias (ANF), Portugal, is also acknowledged for giving the HPLC.
I am also thankful to Margarida Ribau Teixeira and her team from the Universidade do Algarve for their
availability and for providing the membrane concentrate. Lynettefællesskabet, S.A. in Copenhagen,
Denmark is acknowledge for providing the ash samples. I would like to thank EPAL, S.A. and Eng. Olga
Paredes for providing the sewage sludge samples and for the samples characterization on the
Laboratory of Control and Processes and to all Quinta do Conde wastewater treatment plant technicians
who collected the samples.
The Department of Civil Engineering from the Technical University of Denmark (DTU) is acknowledged
for the funding of the study of the heavy metals removal from sewage sludge ashes. The Key Laboratory
of Soil Environment and Pollution Remediation, Institute of Soil Science, Chinese Academy of Sciences
(ISSCAS) and the National Natural Science Foundation of China (21177135) for the funding of the study
aiming metalloids removal from a mine soil. Also the Department of Chemical Engineering from Málaga
University are acknowledged for receiving me and providing all the conditions needed for my research.
This work has been funded by the Portuguese National funds through the “FCT - Fundação para a
Ciência e a Tecnologia” under project PTDC/ECM/111860/2009 - Electrokinetic treatment of sewage sludge and membrane concentrate: Phosphorus recovery and dewatering and by
FP7-PEOPLE-IRSES-2010-269289-ELECTROACROSS.
I have no words to thank Nuno for all the support, encouragement and patience in these last years. I
would also like to thank all my friends, for being by my side and accompany me in this journey. And last
but not the least, I would like to thank my family: my parents, brother and sister for the constant
ABSTRACT
There is a need to develop viable techniques for removal and recovery organic and inorganic
compounds from environmental matrices, due to their ecotoxicity, regulatory obligations or potential
supplies as secondary materials.
In this dissertation, electro –removal and –recovery techniques were applied to five different
contaminated environmental matrices aiming phosphorus (P) recovery and/or contaminants removal. In
a first phase, the electrokinetic process (EK) was carried out in soils for (i) metalloids and (ii) organic
contaminants (OCs) removal. In the case of As and Sb mine contaminated soil, the EK process was
additionally coupled with phytotechnologies. In a second phase, the electrodialytic process (ED) was
applied to wastes aiming P recovery and simultaneous removal of (iii) toxins from membrane
concentrate, (iv) heavy metals from sewage sludge ash (SSA), and (v) OCs from sewage sludge (SS).
EK enhanced phytoremediation showed to be viable for the remediation of soils contaminated with
metalloids, as although remediation was low, it combines advantages of both technologies while
allowing site management. EK also proved to be an effective remediation technology for the removal
and degradation of emerging OCs from two types of soil.
Aiming P recovery and contaminants removal, different ED cell set-ups were tested. For the membrane
concentrates, the best P recovery was achieved in a three compartment (3c) cell, but the highest toxin
removal was obtained in a two compartment (2c) cell, placing the matrix in the cathode end. In the case
of SSA the best approach for simultaneous P recovery and heavy metals removal was to use a 2c-cell
placing the matrix in the anode end. However, for simultaneous P recovery and OCs removal, SS should
be placed in the cathode end, in a 2c-cell.
Overall, the data support that the selection of the cell design should be done case-by-case.
RESUMO
Há uma necessidade de desenvolver técnicas viáveis para a remoção e recuperação de compostos
orgânicos e inorgânicos de matrizes ambientais, devido à sua ecotoxicidade, às obrigações
regulamentares ou ao seu potencial como recurso secundário.
Nesta dissertação foram aplicadas técnicas de electro -remoção e -recuperação em cinco matrizes
ambientais contaminadas, visando a recuperação de fósforo e/ou remoção de contaminantes. Numa
primeira fase, o processo eletrocinético (EK) foi aplicado a solos contaminados com (i) metaloides e (ii)
compostos orgânicos (COs). No caso do solo contaminado com metaloides, o processo EK foi acoplado
a fitotecnologias. Numa segunda fase, o processo eletrodialítico (ED) foi aplicado a resíduos para
recuperação de fósforo (P) e remoção simultânea de: (iii) toxinas de concentrados de membrana; (iv)
metais pesados de cinzas de lamas (CL) e (v) COs de lamas de estações de tratamento de águas
residuais.
Demonstrou-se que o processo EK acoplado a fitorremediação é viável para a remediação de solos
contaminados com metaloides pois, apesar de baixas remoções, a técnica combina as vantagens de
ambas as tecnologias permitido ainda uma gestão sustentável do local. O processo EK também se
demonstrou uma tecnologia de remediação eficiente, uma vez que promoveu a remoção e degradação
de COs emergentes em dois tipos de solo.
Com o objetivo de recuperação de P e remoção de contaminantes foram testados diferentes modelos
de célula ED. Para o concentrado de membrana, a melhor recuperação de P foi obtida numa célula de
três compartimentos (3c), mas a maior remoção de toxinas foi obtida na célula de dois compartimentos
(2c), com a matriz no compartimento do cátodo. No caso das CL a melhor abordagem para a
recuperação simultânea de P e remoção de metais pesados foi a utilização de uma célula 2c com a
matriz no compartimento do ânodo. No entanto, para a recuperação de P e remoção simultânea de
COs as lamas devem ser colocadas no compartimento do cátodo, na célula 2c.
No geral, os dados confirmam que a seleção do desenho da célula deve ser definida caso-a-caso.
INDEX
PREFACE ... i
ACKNOWLEDGMENTS ... iii
ABSTRACT ... v
RESUMO ... vii
INDEX ... ix
LIST OF FIGURES ... xiii
LIST OF TABLES ... xv
P A R T I ... 1
SE C T I O N I ... 3
1. INTRODUCTION ... 5
1.1. Soil pollution ... 5
1.1.1. Background ... 5
1.1.2. Mining areas ... 7
1.1.3. Agricultural Areas ... 8
1.2. Phosphorus... 10
1.2.1. Wastewater treatment plants as phosphorus sources ... 11
1.2.2. Phosphorus as a contaminant ... 13
1.3. Electrokinetic process ... 15
1.3.1. Principles overview ... 15
1.3.2. Electrodialytic process ... 17
1.3.3. Application of electrokinetic processes ... 18
1.3.3.1. EK process alone and coupled with phytoremediation... 18
1.3.3.2. Nutrient recovery from WWTP ... 21
1.4. Analytical methodologies ... 22
1.4.1. Microwave-assisted acid extraction ... 23
1.4.2. Ultrasound-assisted extraction ... 24
1.4.3. Solid phase extraction ... 25
1.4.4. Quechers method ... 26
1.4.5. Chromatography ... 28
1.4.5.1. Basic terms and concepts ... 28
1.4.5.2. High-performance liquid chromatography (HPLC) ... 30
1.5. Motivation and Objectives ... 32
1.6. Original contribution ... 35
1.7. Dissertation outline and content ... 36
SE C T I O N I I ...37
2. MATERIALS AND METHODS...39
2.1. Contaminated Matrices ... 39
2.1.1. Mine Soil ... 39
2.1.2. Agricultural Soil ... 39
2.1.3. Membrane concentrates ... 39
2.1.4. Sewage sludge ash ... 40
2.1.5. Sewage sludge ... 40
2.2. Experimental design ... 41
2.2.1. Metalloids removal from mine soil ... 41
2.2.1.1. Ph desorption tests ... 41
2.2.1.2. Electrokinetic experiments ... 41
2.2.1.3. Electrokinetic-assisted phytoremediation ... 43
2.2.2. Organic contaminants removal from agricultural soil ... 44
2.2.2.1. Electrokinetic laboratory cell ... 44
2.2.2.2. Electrokinetic experimental conditions ... 45
2.2.2.3. Photo and electrodegradation experiments ... 45
2.2.3. Microcystins removal and phosphorus recovery from membrane concentrate ... 46
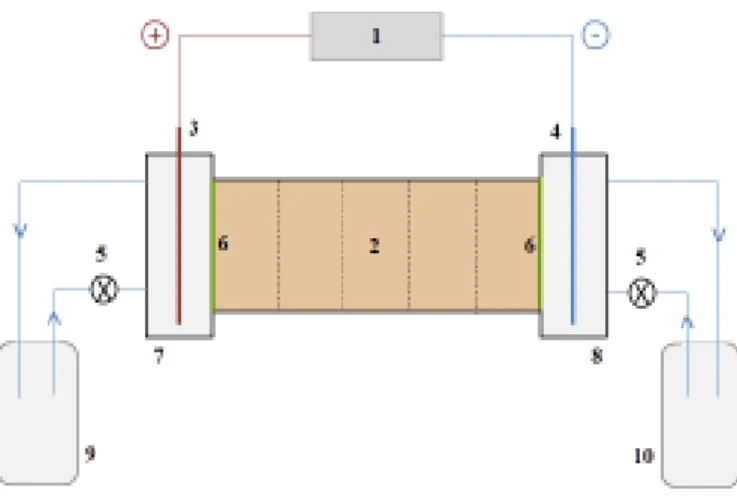
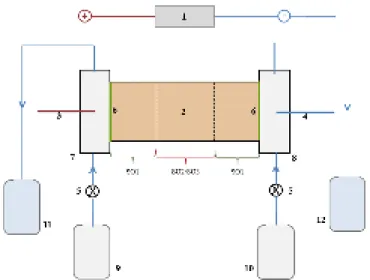
2.2.3.1. Electrodialytic laboratory cell ... 46
2.2.4. Heavy metals removal and phosphorus recovery from sewage sludge ashes ... 48
2.2.4.1. Electrodialytic experiments ... 48
2.2.5. Organic contaminants removal and phosphorus recovery from sewage sludge ... 50
2.2.5.1. Electrodialytic laboratory cell ... 50
2.2.5.2. Electrodialytic experimental conditions... 51
2.2.5.3. Electrodegradation experiments ... 53
2.3. Analytical methodologies ... 54
2.3.1. Chemicals and solvents ... 54
2.3.2. Mine soil ... 55
2.3.2.1. Mine soil characterization ... 55
2.3.2.2. Determination of metalloids and phosphorus ... 55
2.3.2.3. Mobile and mobilizable metalloids fraction ... 55
2.3.2.4. Available nutrients and enzymatic activities ... 55
2.3.3. Agricultural soil characterization ... 56
2.3.4. Membrane concentrate ... 56
2.3.4.1. Membrane concentrate characterization ... 56
2.3.5. Sewage sludge ash ... 57
2.3.5.1. Sewage sludge ash characterization ... 57
2.3.5.2. Acid washing ... 57
2.3.6. Sewage sludge ... 57
2.3.6.1. Sewage sludge biological characterization ... 57
2.3.7. Phosphorus and heavy metals extraction and determination ... 58
2.3.7.1. Sewage sludge ashes ... 58
2.3.7.2. Sewage sludge ... 58
2.3.7.3. Phosphorus colorimetric analysis ... 58
2.3.8. Organic compounds extraction and analysis ... 59
2.3.8.1. HPLC-DAD conditions ... 59
2.3.8.2. Extraction ... 60
2.4. Statistical analysis ... 61
2.5. Minteq calculations ... 61
SE C T I O N I I I ...63
3. RESULTS AND DISCUSSION ...65
3.1. Analytical methods development for organic contaminants determination ... 65
3.1.1. HPLC method development ... 65
3.1.2. Solid Phase extraction (SPE) ... 68
3.1.3. Ultrasonic assisted extraction (UAE) ... 71
3.1.4. Quick Easy Cheap Effective Rugged Safe extraction (quechers) ... 72
3.2. Metalloids removal from mine soil ... 73
3.2.1. Soil characterization and ph desorption tests ... 73
3.2.2. Electrokinetic remediation ... 74
3.2.2.1. Mobile and mobilizable fractions ... 75
3.2.3. Electrokinetic enhanced phytoremediation ... 76
3.3. Organic contaminants removal from soil ... 79
3.3.1. Soil characterization ... 79
3.3.2. General results ... 80
3.3.3. Organic contaminants remediation ... 81
3.3.3.1. Electrokinetic mobilization ... 83
3.4. Microcystins removal and phosphorus recovery from membrane concentrate ... 85
3.4.1. Membrane concentrate characteristics ... 85
3.4.2. Phosphorus recovery ... 85
3.4.3. Phosphorus and microcystin separation ... 89
3.5. Phosphorus recovery and heavy metals removal from sewage sludge ashes ... 91
3.5.1. Chemical characterization of different Danish SSA ... 91
3.5.3. Acid washing of ash ... 94
3.5.4. Electrodialytic separation ... 95
3.5.4.1. Mobilization of phosphorus and heavy metals ... 95
3.5.4.2. Influence of cell design and acid concentration ... 98
3.6. Phosphorus recovery and organic contaminants removal from sewage sludge ... 100
3.6.1. Test of different cell designs ... 100
3.6.1.1. General results ... 100
3.6.1.2. Phosphorus separation ... 102
3.6.1.3. Organic contaminants profile ... 103
3.6.2. Influence of current intensities ... 106
3.6.2.1. General results ... 106
3.6.2.2. Microbiological changes ... 108
3.6.2.3. Biodiversity and abundance ... 110
3.6.2.4. Organic contaminants degradation and profile ... 113
3.6.2.5. Phosphorus separation ... 116
SE C T I O N I V ...119
4. CONCLUSIONS ...121
5. FUTURE DEVELOPMENTS ...125
REFERENCES ...129
A P P E N D I C E S ...143
P A R T I I ...155
P ap er I Integrated perspectives of a greenhouse study to upgrade an antimony and arsenic mine soil – potential of enhanced phytotechnologies ...157
P ap er II Electrokinetic remediation of six emerging organic contaminants from soil ...167
P ap er I II Phosphorus recovery from a water reservoir - potential of nanofiltration coupled to electrodialytic process ...177
P ap er I V Electrodialytic process of nanofiltration concentrates - phosphorus recovery and microcystins removal ...187
P ap er V Phosphorus recovery from sewage sludge ash through an electrodialytic process ...197
P ap er VI Valorisation of ferric sewage sludge ashes: potential as a phosphorus source ...207
P ap er V II Potential of the electrodialytic process for emerging organic contaminants remediation and phosphorus separation from sewage sludge...227
LIST OF FIGURES
Figure 1.1. Average of key sources of soil contamination, based on 22 countries/regions. ... 6
Figure 1.2. Contaminants affecting the solid matrix (soil, sludge, sediment) reported in 2011. ... 6
Figure 1.3. Phosphorus problem scheme. ... 11
Figure 1.4. Different recovery possibilities, the recovery potential and typical concentrations of P in a wastewater treatment plant of P (related to the concentration present in the influent). ... 12
Figure 1.5. Average of total P inputs and outputs in agriculture in Portugal (2005-2008). ... 14
Figure 1.6. Schematic representation of the electrokinetic process. ... 15
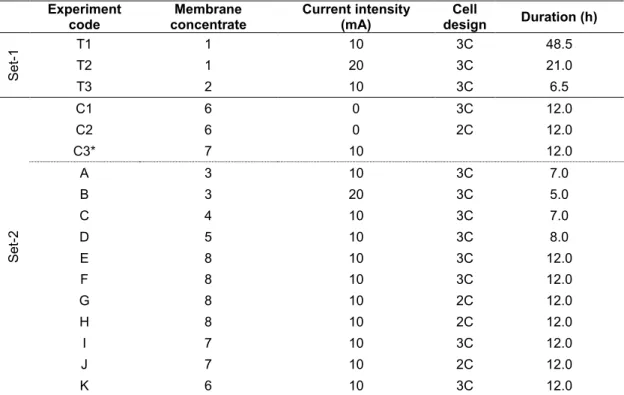
Figure 1.7. Principles of the EK (a) and ED (b) process in a 3c-cell. ... 17
Figure 1.8. Schematic representation of in situ electrokinetic enhanced phytoremediation. ... 20
Figure 1.9. The analytical process. ... 23
Figure 1.10. Schematic view of devices for (a) pressurized and (b) focused MAE... 24
Figure 1.11. Schematic representation of SPE method. ... 26
Figure 1.12. QuEChERS procedure. ... 27
Figure 1.13. A chromatogram showing retention time (tR), void time (tM), peak width (wb), and peak height (h)... 28
Figure 1.14. A diagram showing the calculation of peak asymmetry (As). ... 29
Figure 1.15. Representation of chromatographic resolution. ... 30
Figure 1.16. Schematic view of the different components of a HPLC system. ... 30
Figure 1.17. Scheme of the principles of the reversed-phase chromatography. ... 31
Figure 1.18. Experimental work flow diagram. ... 32
Figure 1.19. Schematic representation of the concept for electrodialytical phosphorus recovery and MC-LR removal from NF membrane concentrates. ... 34
m Figure 2.1. Schematic view of the electrokinetic cell set-up used with the mine soil. ... 42
Figure 2.2. Experimental scheme of the electrokinetic-assisted phytoremediation set-up used with the mine soil... 43
Figure 2.3. Schematic view of the electrokinetic cell set-up used with the agricultural soil. ... 44
Figure 2.4. Electrodialytic cell designs used with the membrane concentrates. ... 46
Figure 2.5. Scheme of the laboratory cell for the electrodegradation experiments. ... 48
Figure 2.6. Schematic view of a 3c (a) and a 2c (b) electrodialytic cell used with the sewage sludge ashes. ... 49
Figure 2.7. Schematic design of the three laboratory cell set-ups used with the sewage sludge. ... 51
Figure 2.8. Scheme of the laboratory cell used for the electrodegradation experiments. ... 54
m Figure 3.1. UV spectra of all compounds at 1 mg/L. ... 66
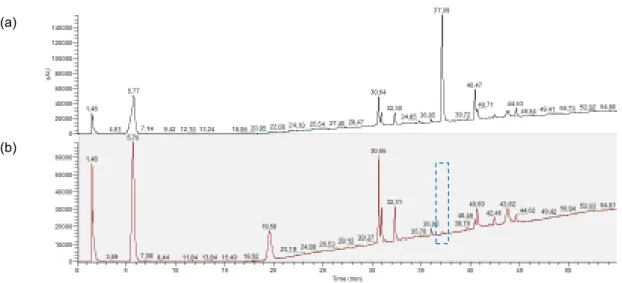
Figure 3.3. HPLC-DAD chromatogram of the organic compounds in aqueous solution using (a) Oasis
HLB and (b) Strata-X. ... 69
Figure 3.4. Scheme for Strata-X control experiments and chromatograms obtained by HPLC-DAD. .. 70
Figure 3.5. Concentration of as and sb extracted as a function of ph in batch extraction experiments for soil with P-ammedment and soil without amendment. ... 73
Figure 3.6. Soil sections pH after the electrokinetic process. ... 74
Figure 3.7. Fraction results for arsenic and antimony mobile and mobilizable fractions for the soil before and after EK. ... 76
Figure 3.8. Boxes with contaminated soil and EK treatment: (a) experiment overview and (b) details of experimental boxes with ryegrass at left and Indian mustard at right. ... 77
Figure 3.9. Experiment D (a) cumulative mas of organic contaminants found in the catholyte and (b) relation between the percentages of organic contaminants found in the catholyte and the logarithm of octanol-water partition coefficient. ... 84
Figure 3.10. Total P present in membrane concentrate at the beginning and at the end of the electrodialytic experiments from set-1. ... 86
Figure 3.11. Total P measured in electrolyte solutions collected during experiment T3. ... 86
Figure 3.12. Cumulative mass of P during the ED process. ... 88
Figure 3.13. Cumulative mass of P in two ED cell designs. ... 89
Figure 3.14. Structure of microcystin-LR. ... 90
Figure 3.15. SEM micrographs of (a) fresh Lynetten SSA 2012 (b) deposited Lynetten SSA 2012... 93
Figure 3.16. XRD diffractograms of (a) fresh Lynetten SSA 2012 (b) deposited Lynetten SSA 2012.. 94
Figure 3.17. Phosphorus extraction as a function of pH in batch extraction experiments using HNO3 on (a) fresh and (b) deposited Lynetten SSA of 2012. ... 95
Figure 3.18. Percentage of heavy metals and P in the ED cell sections at the end of the experiments of 3 (S1), 7 (S2) and 14 (S2) days for the fresh and deposited SSA. ... 96
Figure 3.19. Percentage of heavy metals and P in the different matrices after the electrodialytic treatments in the 3c and 2c-cell design. ... 99
Figure 3.20. The development of (a) pH in the SS compartment during ED and (b) voltage drop between the working electrodes for set-1 experiments ... 101
Figure 3.21. Distribution of P at the end of the electrodialytic experiments of set-1. ... 103
Figure 3.22. Amount of individuals normalized to the initial amount counted in the SS samples. ... 109
Figure 3.23. Biodiversity indexes (a) Simpson diversity index and richness and (b) evenness for the sewage sludge samples. ... 110
Figure 3.24. Percentage of each microbiological group in relation to the total amount of organism counted in each the sample... 112
Figure 3.25. Microscope photograph of (a) Epistylis spp. colony (100x), (b) Vorticella spp.(400x), (c) Arcella gibbosa (400x). ... 112
Figure 3.26. Percentage of organic contaminants degraded in the electrodialytic separation experiments comparing to Control-3. ... 114
LIST OF TABLES
Table 1.1. Ranges of heavy metal contents (aqua regia basis) within the soil texture classes. ... 8
Table 1.2. Limit values proposed for concentration of organic compounds and heavy metals in sludge for use on land. ... 9
Table 1.3. Advantages and limitations of electrokinetic remediation. ... 18
Table 1.4. Advantages and limitations of phytoremediation. ... 19
Table 1.5. Chemical structure and properties of the emerging organic contaminants. ... 33
m Table 2.1. Sewage sludge samples used in the experiments. ... 41
Table 2.2. Experimental design of electrokinetic treatments alone and coupled to phytoremediation for metalloids removal from the mine soil. ... 42
Table 2.3. Experimental conditions used in the experiments with agricultural soil. ... 45
Table 2.4. Experimental conditions of the electrodialytic process applied to membrane concentrates.47 Table 2.5. Design of the experiments with the sewage sludge ashes collected from Lynetten 2012. .. 50
Table 2.6. Experimental design of the sewage sludge experiments. ... 52
m Table 3.1. HPLC method parameters for the soil experiments. ... 67
Table 3.2. SPE extraction recoveries and method limits for the soil and sewage sludge experiments. 71 Table 3.3. UAE extraction recoveries and method limits for the agricultural soil samples. ... 71
Table 3.4. QuEChERS extraction recoveries and validation parameters for the sewage sludge samples. ... 72
Table 3.5. Characterization of the soil (Lengshuijiang soil) used in the experiments. ... 73
Table 3.6. Soil pH and EC and metalloids content after application of electrokinetic remediation. ... 74
Table 3.7. pH values and As and Sb levels in ryegrass and Indian mustard after the different applied treatment... 78
Table 3.8. Physical and chemical characteristics of the soils used in the experiments. ... 79
Table 3.9. Soil sections and electrolytes pH means; accumulated volume for the electrokinetic experiments. ... 81
Table 3.10. Percentage of each organic contaminant remaining, removed and degraded from the soil through the electrokinetic process carried out in experiments B, C, D and F. ... 82
Table 3.11. Mass of organic contaminants found in the different parts of the cell at the end of the electrokinetic process for experiment D and mobilization rate. ... 84
Table 3.12. Characteristics of the membrane concentrates used in the experiments. ... 85
Table 3.13. pH, conductivity and voltage drop between working electrodes obtained in the electrodialytic experiments of set-1. ... 86
Table 3.14. Final values of pH and conductivity for the experiments of set-2. ... 87
Table 3.16. Characteristics of the Danish sewage sludge ash studied, including heavy metal
concentrations in relation to the total dry mass (mean ± STD) and limiting values for
spreading at agricultural land. ... 92
Table 3.17. Concentration of elements present in the anode end after 14 days of electrodialytic
treatment... 97
Table 3.18. Parameters measured at the beginning and at the end of the electrodialytic experiments.
... 98
Table 3.19. MINTEQ calculation of major species of phosphate ions for the anolyte concentrations at
the end of the treatments... 100
Table 3.20. Percentage of contaminant detected in the sewage, effluent and electrolyte at the end of
the experiments in relation to the initial amount for the experiments of set-1. ... 104
Table 3.21. Degradation percentage* for the experiments of set-1. ... 105
Table 3. 22. Parameters measured at the beginning and at the end of the electrodialytic experiments
of set-2. ... 107
Table 3.23. Groups and species counted and identified in the SS samples. ... 108
Table 3.24. Minimum and maximum number of individuals per gram of SS ... 109 Table 3.25. Percentage of contaminant detected in the sewage, effluent, electrolyte and degraded at
the end of the experiments in relation to the initial amount for the set-2 experiments. ... 114
Table 3.26. Parameters measured at the beginning and at the end of the electrodialytic experiments of
ABBREVIATIONS
AC alternate current
ACN acetonitrile
AEM anion exchange membrane
AES atomic emission spectrometer
ALVT Águas de Lisboa e Vale do Tejo
AFS atomic fluorescence spectroscopy
AS asymmetry factor
BOD5 biochemical oxygen demand
BPA bisphenol A
Caf caffeine
CEC cation exchange capacity
C18E C18 endcapped sorbent
CEM cation exchange membrane
DAD diode array detector
DC direct current
DEHP di(2-ethylhexyl)phthalate
DM dry matter
dSPE dispersive solid-phase extraction
DTU Technical University of Denmark
EC electric conductivity
EC-JRC European Commission Joint Research Centre
ED electrodialytic
EDR electrodialytic remediation
EDS electrodialytic separation
EDX energy dispersive spectrometry
EK electrokinetic
EOF electroosmotic flux
EU European Union
E2 17β-estradiol
EE2 17α-ethinylestradiol
F flow rate
GCB graphitized carbon black
h peak height
HPLC high-performance liquid chromatography
Ibu Ibuprofen
INV invertase
ICP inductively coupled plasma
k retention factor or capacity factor
Kow octanol-water partition coefficient
LAS linear alkylbenzene sulphonates
LC liquid chromatography
LD limit of detection
LLE liquid-liquid extraction
LOI loss on ignition
LQ limit of quantification
MAE microwave-assisted extraction
MAAD microwave-assisted acid digestion
MBPh oxybenzone
MC-LR microcystin-LR
MLD method limit of detection
MLQ method limit of quantification
MS mass spectrometer
NF nanofiltration
NP 4-nonylphenol
NPC normal phase chromatography
NPH neutral phosphatase
PVC polyvinyl chloride
OCs organic contaminants
OES optical emission spectrometer
OP 4-octylphenol
P phosphorus
PAH polycyclic aromatic hydrocarbons
PBDEs polybrominated diphenyl ethers
PCB polychlorinated biphenyls
PCDD/F polychlorinated dibenzo-p-dioxins and dibenzo-p-furans
PDA photo-diode array detector
PFCs perfluorochemicals
PM passive membranes
PSA primary and secondary amine
PTFE polytetrafluoroethylene
PVC polyvinyl chloride
QuEChERS quick easy cheap effective rugged safe
RPC reversed-phase chromatography
RS resolution
SEM scanning electron microscopy
SOC soil organic content
SPE solid-phase extraction
SS sewage sludge
SSA sewage sludge ash
SVI sludge volumetric index
TCC triclocarban
TCS triclosan
TOCs trace organic contaminants
tR retention time
tM void time
UAE ultrasound-assisted extraction
URE urease
USA United States of America
USEPA United States Environmental Protection Agency
UV ultraviolet
Vis visible
VR retention volume
VM void volume
w peak width
wb peak width measured at the base
w½ peak half-height
WWTP wastewater treatment plant
XRD X-ray diffraction
2c two compartment
PART
I
“Everything is theoretically impossible, until it is done.”
1. INTRODUCTION
1.1. Soil pollution
1.1.1. Background
Soil is a complex and dynamic system that should be regarded as a non-renewable resource at a human
scale. Besides contributing to the maintenance of all forms of life that occur in the terrestrial surface, soil
has several others functions as providing biomass and raw materials; storing, filtering and transforming
substances; and acting as a carbon and biodiversity pool, as a platform for human activities and the
landscape, and heritage archive [1].
There are many threats to soil - erosion, sealing, compaction, landslides, loss of organic matter,
salinization, contamination and all these promote loss of biodiversity [1]. These have proven difficult to
tackle and continue to be a challenge, in line with expected future developments in urbanization,
intensive agriculture and industrialization. The long-awaited binding European Union (EU) Soil Directive
is still at the proposal level [2] (MEMO/13/833, 02/10/2013).
Soil contamination is defined by the European Commission Joint Research Centre (EC-JRC) as “the occurrence of pollutants in soil above a certain level causing a deterioration or loss of one or more soil functions” [3]. There are more than 3 000 000 potentially contaminated sites worldwide that represent a lost economic opportunity and threaten the health and ecosystem [4]. Only in Europe, there are 2.5
million potentially contaminated sites in 39 countries member of European Environment Agency of which
about 45% have been identified to date [5]. In the United States of America (USA), in 2014 there were
1 739 Superfund sites [6] and more than 450 000 brownfields [7]. Developing countries like China and
India have also to deal with this environmental problem, due to rapid industrialization and economic
growth [8-13].
Soil contamination is a result of anthropogenic activities. In Europe the production sectors contribute
more to local soil contamination than the service sectors (an average of 60% compared to 32%) [14]
with waste disposal/treatment and industrial/commercial activities accounting for an average of 38 and
34%, respectively (Figure 1.1). The main sources of soil contaminants are mining and smelting, fossil
fuel combustion, process and manufacturing industries (specifically metallurgical, electronics and
chemical), waste disposal, land spreading of fertilizers, fungicides and other agricultural materials,
atmospheric deposition from traffic and waste incineration, the spillage of liquids such as solvents or oil
Figure 1.1. Average of key sources of soil contamination, based on 22 countries/regions [5].
The most frequent contaminants in EU affecting the solid matrix are heavy metals and mineral oils (total
of 59%) (Figure 1.2). Contaminated soils can be simultaneously source and sink for pollution where,
once introduced, may accumulate for a long time. Although soil contamination has been recognized as
a worldwide problem, less than a tenth of the potentially contaminated sites have been remediated. This
is due to the complex and challenging nature of both surface and subsurface contamination, as well as
the cost and technical difficulty of dealing with contaminant mixtures, recalcitrant and persistent
pollutants [16].
Figure 1.2. Contaminants affecting the solid matrix (soil, sludge, sediment) reported in 2011 [5].
For China, for example, a survey conducted by the Ministry of Environmental Protection and the Ministry
of Land and Resources found that 16% of China’s soil was polluted beyond acceptable standards, and 19.4% of China’s total arable land was highly contaminated by heavy metals (2005-2013). The Environmental Protection Ministry of China reported Cd, Ni and As as the top pollutants [17, 18].
Contaminated soil continues to be commonly managed using “traditional” techniques (e.g. excavation and off-site disposal) which accounts for about one third of management practices [14]. The most
common remediation technique has been the excavation of contaminated soil and its disposal in landfill
(sometimes referred to as ‘dig and dump’). However, increasing regulatory control of landfill operations Waste disposal & treatment
Industrial & commercial activities Storage Others Transport spills on land Military Nuclear operation
35%
24% 11%
10% 8%
1%1% 10%
Heavy metals Mineral oil
Polycyclic aromatic hydrocarbons Aromatic hydrocarbons
Chlorinated hydrocarbons Phenols
Cyanides Others
0.1 3.4
7.9
8.1
10.7
34.0
and associated rising costs, combined with the development of improved ex-situ and in-situ remediation techniques, is altering the pattern of remediation practices [14].
1.1.2. Mining areas
As a consequence of the technological development and global population growth, agriculture and
industrial activities have intensified, leading to a considerable increase of metals in the different
compartments of the environment. Open-pit mining involves the excavation of large quantities of waste
rock (material not containing the target mineral) in order to extract the desired mineral ore. The ore is
then crushed into finely ground tailings for processing with various chemicals and separating processes
to extract the final product. In Canada on average for every ton of Cu extracted 99 t of waste material
are produced (made up of soil, waste rock and the finely ground “tailings”) and must also be removed
[19].
Mining industries produces tons of wastes and tailings that needs to be disposed of until further possible
economically viable recovery of elements or, alternatively, gets deposited at the surface. This represents
pollution sources that may directly affect loss of cultivated land, forest or grazing land, and the overall
loss of production [20] and indirectly promote water pollution and siltation of rivers that will eventually
lead to the loss of biodiversity, amenity and economic wealth [21]. One intrinsic problem of mining
contamination is that pollution may persist for hundreds of years after the cessation of mining operations
[22]. Abandoned mines are one of the most serious environmental issues faced by many European
countries and Portugal is not an exception [23, 24]. In Portugal, pyrite extraction has a long tradition and
represents an important industry, which has given rise to several pollution problems. Large volume of
mine wastes occurs in Iberian Pyrite Belt as a result of ore extracted from metalliferous mining works
during the last 100 years [25].
Soil heavy metal pollution has become a severe problem in many parts of the world [26, 27]. Unlike
organic pollutants, the toxicity of metals is intrinsic to their atomic structure and they cannot be
transmuted/mineralized to a total innocuous form [28]. This pollution not only degrades the quality of the
atmosphere, water bodies, and food crops, but also threatens the health and well-being of other animals
and human beings through the food chain [29-31]. High concentrations of heavy metal(loid)s, such as
As, Cd, Cu, Pb, and Zn in soils have often been reported in a number of countries. For example,
significant adverse impacts of As on human health have been recorded in Bangladesh, India, and China
and it is claimed that millions of people are potentially at risk from As poisoning [32].
The geochemical baseline concentration and background level of different heavy metals in soils have
been studied in various countries [33-36], being widely accepted that they represent the best
approaches to establish the levels of non-contaminated soils. Different approaches have also been
taken by establishing the geochemical baseline concentration of trace elements in Mediterranean soils
[34, 35, 37, 38]. Most have focused on the total heavy metal content without considering the
bioavailability of the different elements involved [39], even though, bioavailability constitutes the best
The establishment of heavy metals limit or guidance values upon the existing data base for the European
soils has been heavily discussed by the EC-JRC where pros and cons have been raised, which include
not only sheer scientific arguments, but also economic or political aspects. At the end, the EC-JRC
proposed values according to soil pH or soil texture (Table 1.1) as a starting point for further discussion
[41].
Table 1.1. Ranges of heavy metal contents (aqua regia basis) within the soil texture classes [41]. Concentrations are expressed in mg/kg DM.
Element Percentile* Course Medium Medium Fine Fine Very Fine
Cd 50 P. 0.2 – 0.8 0.2 - 0.8 0.1 - 0.8 0.2 - 0.8 0.2 - 1.1
90 P. 0.4 – 2.1 0.4 - 2.1 0.3 - 1.2 0.4 - 1.7 0.4 - 0.6
Cr 50 P. 7 - 30 17 – 35 17 - 39 19 - 58 21 - 60
90 P. 13 - 73 26 - 124 28 - 66 27 - 85 31 - 59
Cu 50 P. 5 - 21 9 - 30 9 - 50 9 - 55 12 - 60
90 P. 13 - 50 20 - 78 18 - 10 22 - 119 26 - 44
Hg 50 P. 0.02 - 0.10 0.04 - 0.13 0.03 - 0.17 0.04 - 0.14 0.03 - 0.13
90 P. 0.05 - 0.40 0.06 - 0.43 0.05 - 0.35 0.07 - 0.34 0.08 - 0.27
Ni 50 P. 4 - 22 12 - 32 11 - 25 10 - 43 22 - 50
90 P. 11 - 68 26 - 67 34 - 53 18 - 68 31 - 54
Pb 50 P. 8 - 24 10 - 42 12 - 48 14 - 45 12 - 61
90 P. 17 - 77 19 - 124 21 - 121 21 - 116 25 - 53
Zn 50 P. 21 - 57 25 - 75 40 - 77 36 - 98 33 - 127
90 P. 47 - 141 65 - 159 62 - 135 58 - 191 68 - 144
* stablished based on the observed 50 and 90 percentiles presented in Annex 1 of Part 2 of the report.
The significance of the chosen bases of reference has to be valued differently. It seems little
target-orientated to draw conclusions about usual contents of heavy metals solely by means of pH or soil
texture. Whereas the evaluation approach regarding parent material and land use points the right way
[41].
1.1.3. Agricultural Areas
Sludge is the residue originated from the wastewater treatment. The EU encourages the use of sewage
sludge (SS) in agriculture through the Directive 86/278/EEC as they are rich in organic matter and
present other essential elements such as nitrogen and phosphorus (P) [42]. Although the nutrients in
the treated sludge can improve soil fertility in the short term where nutrients are in short supply, there is
a risk on the heavy metals accumulation, potentially damaging long-term fertility of the soil, as well as
the risk associated with other types of contaminants e.g. organics and prions, that can endanger public
health. Less than 5% of EU farmland is currently treated with SS. However, the requirements of EU
legislation such as the urban waste water treatment directive and the landfill directive, which limit other
The SS directive requires the pre-treatment of sludge before its discharge to agricultural soil to provide
protection to potential receptors (soil, vegetation, animal and human) against pathogens. Without any
other specifications, the directive requires biological, chemical or thermal treatment. The
pre-treatment must be efficient enough to prevent the application of sludge to soil from being hazardous. It
requires concentration limits for certain heavy metals (Cd, Cu, Hg, Ni, Pb and Zn), and also limits the
rates and longevity of application of treated sludge in areas where fruit and vegetable crops are grown
and where animals are grazing.
When the sewage directive was adopted, it was based on the existing knowledge of that time. Currently,
the EU recognizes the need for its revision in light of new scientific evidence about potential risks to
human health, the environment and soil quality. The proposal for the revision of the directive in the “3rd draft of the working document on sludge” sets stricter limits on heavy metals depending on the pH of
the soil (Table 1.2) and includes chromium in the analysis [44]. The draft suggests that each treatment
plant carry out a minimum number of chemical and biological analyses regarding the quantity of sludge
produced per year. The proposal also includes an analysis of some organic contaminants (OCs) that
were not included in the original directive [44]. Moreover, the EU is currently reviewing the possibility of
analysing halogenated organic compounds (AOX), nonylphenol (NP), linear alkylbenzene sulphonates
(LAS), di(2-ethylhexyl)phthalate (DEHP), polycyclic aromatic hydrocarbons (PAH), polychlorinated
biphenyls (PCB) and polychlorinated dibenzo-p-dioxins and dibenzo-p-furans (PCDD/F) in sludge applied to agricultural land (Table 1.2). It should be stated that Portugal has tight legislation (Decreto
Lei 276/2009, October 2) as well as several other Member States.
Table 1.2. Limit values proposed for concentration of organic compounds and heavy metals in sludge for use on land (European Commission, 2000).
Heavy metals Limit values
(mg/kg DM)
Organic compounds & Dioxins
Limit values (mg/kg DM)
Cd 10 AOX1 500
Cr 1 000 LAS2 2 600
Cu 1 000 DEHP3 100
Hg 10 NP/NPE4 50
Ni 300 PAH5 6
Pb 750 PCB6 0.8
Zn 2 500 PCDD/F7 100 (ng TE/kgDM)
1 Sum of halogenated organic compounds; 2 Linear alkylbenzene sulphonates; 3 Di(2-ethylhexyl)phthalate; 4 It comprises the substances nonylphenol and nonylphenol ethoxylates with 1 or 2 ethoxy groups; 5 Sum of the following polycyclic aromatic hydrocarbons: acenapthene, phenanthrene, fluorene, flouranthene, pyrene, benzo(b+j+k)fluoranthene, benzo(a)pyrene, benzo(ghi)perylene, indeno(1, 2, 3-c,d)pyren; 6 Sum of the polychlorinated byphenils components number 28, 52, 101, 118, 138, 153, 180; 7 Polychlorinated dibenzodioxins/ dibenzofuranes.
Regardless of the debate on the type of organic compounds and their limits in different countries, no
current European guidelines exist for these compounds. Similarly, no regulation takes into account an
analysis of new emerging contaminants in SS. Degradation and attenuation during wastewater and
be present in residual concentrations in the dry solids depending on the initial amounts, their lipophilicity
and the extent of destruction during wastewater and sludge treatment [45]. Despite increasing concerns
related to potential human toxicity, evidence of adverse effects to the environment and
endocrine-disrupting properties, more knowledge is required about the occurrence and detection of emerging
contaminants in sludge as well as their degradability and actual risk.
During the last decades, many research projects have focused on the presence of these trace organic
contaminants (TOCs) in raw sewage, treated water, and various environmental matrices [46, 47]; and
in the evaluation of conventional wastewater and upgraded processes to remove some priority and
emerging TOCs [48, 49]. These contaminants can be found in low concentrations in the environment,
TOCs, and they often accumulate by biomagnification and bioaccumulation into biological organisms
[50]. Increasing evidence indicates possible adverse impacts to the target organisms due to long-term
and low-dosed exposures to pharmaceuticals in the environment, including chronic toxicity, endocrine
disruption, antibiotic resistance, as well as toxic effects on reproduction of terrestrial and aquatic
organisms [51, 52]. For example, it was reported that the removal of triclosan (TCS;
5-chloro-2-(2,4-dichlorophenoxy)-phenol) and triclocarban (TCC; 3,4,4′-trichlorocarbanilide) in wastewater treatment
plant (WWTP) is incomplete (through mass balance studies) [53]. Consequently, TCS and TCC can be
released into the environment in WWTP effluents and by land application of biosolids being regularly
detected in surface waters receiving WWTP inputs [54-56], and also found in vegetables tissues
(pumpkin and zucchini) [57].
The most common endocrine disrupters found in groundwater, surface water, wastewater effluents and
SS are TCS; tributyltin; 17β-estradiol (E2); bisphenol A (BPA); nonylphenol (NP); the synthetic musks galaxolide and tonalide; the pharmaceuticals paracetamol, ibuprofen (Ibu), naproxen, diclofenac and
fluoxetine; polybrominated diphenyl ethers (PBDEs); and perfluorinated compounds (PFCs) [45, 58-60].
Other compounds like the estrogens E2 and 17-α-ethynylestradiol (EE2) and the central nervous system
active compound caffeine (Caf), have also frequently been detected at the effluents of the WWTPs [61,
62].
1.2. Phosphorus
Current population growth rates require an increased supply of staple foods and to guarantee it, a
sufficient nutrient level of agricultural soils needs to be maintained by application of soil fertilizers. One
indispensable nutrient for plant growth is P and phosphate rock, its primary source, is becoming
progressively limited [63]. Independently of the “P peak” occurring in 50 years or in 250 years, there is
general consensus that the quality of remaining reserves is in decline (both in terms of P2O5 content and
the presence of heavy metals and other contaminants). Additionally, the phosphate layers are becoming
more physically difficult to access meaning that more waste is being generated and that exploration
costs are increasing [64]. For all these reasons, phosphate rock is included in the EU list of 20 Critical
The EU is almost entirely dependent upon phosphate imports, with China, Jordan, Morocco, South
Africa and USA controlling 85% of global phosphate reserves [65]. As a consequence, EU is vulnerable
to geopolitical tensions in the countries that export phosphate and to its volatile prices (as demonstrated
during the 800% spike in the price of phosphate rock in 2008) [64]
Currently, 178.5 Mt of phosphate rock, equivalent to 23 Mt of P, is being mined every year [66], 90% of
which is used for food production as fertilizer (approx. 82%) and feed additives (approx. 7%) [63]. Within
the whole process, there are substantial losses at all stages: mining and fertilizer processing, transport
and storage, application, harvest, food processing and retailing, and food consumption that can cause
diverse problems such as toxic algal blooms which reduces the suitability of aquatic systems for drinking
water, and recreation and thus requiring expensive treatment processes [67]. A schematic
representation of the problem is presented in Figure 1.3.
Figure 1.3. Phosphorus problem scheme (adapted from [68]).
The use of P must be sustainable as it ”must ensure that all the world’s farmers have sufficient access to phosphorus in the long run to produce enough food to feed humanity, whilst minimizing adverse environmental and social impacts” [64]. This will make the full recycling of P a condition sine qua non
for global and European food security [64].
1.2.1. Wastewater treatment plants as phosphorus sources
The water and sewage industry is at a transformation point. There is a challenge to develop and extend
conventional centralized water and sewage systems on the existing planning parameters [69]. Factors
including climate change impacts, changing of hydrological conditions, population growth, resource
scarcity, aging infrastructure, energy constraints, economic limitations in financing large scale systems,
and changing expectations for water quality (e.g. EU water directives) contribute for the need of the
plants to adapt to these uncertainties. This approach is based on the idea that an environmentally,
economically and socially sustainable sanitation system requires sewage to be viewed as a set of
resources to be recovered, recycled and reused (water, energy, nutrients) rather than a waste product
to be treated to successively higher standards before released to the environment [69].
It has been estimated that humans consume approximately 3 million t P globally [70]. So, every year,
Australia 8 000 t of P are discharged annually with human excreta, and 40–50% of the P that reach a
treatment plant is applied to agricultural soils as biosolids [71]. In Europe, the potential production of P
from urine has been estimated in 0.3 kg P per person per year [72]. The available P from human excreta is reported to also be split near equally between rural and urban areas (i.e., 1.6 million t excreted in
urban environments, 1.7 million t excreted in rural environments) [73]. This split is likely to become more
urban in the future because an estimated 70% of the world’s population is expected to live in cities by
the year 2050 [74]. If collected, the P available from human excreta could account for 22% of the global
P fertilizer demand [75]. In EU, the P-content in SS from WWTP is estimated to be 400 000 tP/y from
which 240 000 tP/y are not used in land spreading. If P-recycling was enforced by law the market may
potentially generate 1 200 M€/y [76].
Nowadays, concepts to recover P within the wastewater treatment scheme are particularly attractive, if
they promise to obtain a product which is free from contaminants and with a high quality as fertilizer
[77].
The effluent of WWTPs has a large quantity of phosphate [67] and, to limit eutrophication potential of
wastewaters, P removal has been in the toolbox of wastewater-treatment engineers for several decades
[78], e.g. chemical or biological P precipitation. But these approaches do not recycle it as a truly
sustainable product, as it is removed from the liquid phase together with various other waste products
like organic chemicals [45, 79], metals [80] or even pathogens [81-83].
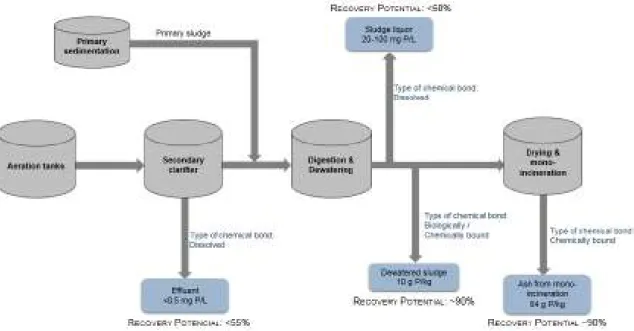
In a common WWTP there are several potential locations for P recovery from the liquid phase: the
effluent, the supernatant liquor from side-stream treatment and the sludge liquor [84]. The theoretical
recovery potential from liquid phase in common activated sludge plants is limited to <55% (Figure 1.4).
In WWTPs without P removal, 90–95% of the incoming P load is contained in the SS [77, 84]. However,
direct application of treated SS is difficult not only due to the presence of heavy metals and OCs but
also to the risk associated with the presence of pathogens [85], public perception, odours and/or
difficulties of transport and storage. To avoid direct use of treated SS as fertilizer, a side recovery
technology may be the answer and there are several potential applications aiming P recovery from SS,
i.e. primary, excess and raw sludge, stabilized sludge before and after dewatering [84]. In these cases
the theoretical recovery potential is significantly higher than with separation processes from the aqueous
phase, approx. more 40% (Figure 1.4).
Another option is P recovery from sewage sludge ashes (SSA). These ashes are generally considered
a waste material to be disposed into landfill [86] but they can also be reused as adsorbents [87], in
geotechnical applications or in construction materials [88-90]. However, none of the above applications
make use of the valuable P present in the SSA. The application of SSA in soils is still a controversial
subject as it raises questions of toxicity that must be carefully addressed, prior to its application, due to
the high levels of contaminants. Major concerns are generally about the heavy metals, which can
accumulate in the soil over time, and enter the food chain or groundwater systems. These occurrences
depend primarily on metal concentrations in SSA, their antecedent concentrations in the soil, their
mobility from the SSA and subsequently from the soil, and their uptake by plants.
Phosphorus recovery from SSA first involves the re-dissolution of the bound P followed by its separation.
The advantage of treating SSA is their high inorganic formation, which, in contrast to SS facilitates P
recovery. Furthermore, the incineration of organic matter causes the enrichment of P in the ashes [84].
In this case, P recovery potential from the SSA is the same as from the SS, approx. 90% (Figure 1.4).
Taking into consideration that the increased utilization of secondary resources is an important issue,
e.g. in the EU waste strategies, it makes sense to search for the upgrade of these waste matrices while
recycling P. This offers the immediate advantage of avoiding the environmental impacts associated with
primary production from phosphate rock, complemented with the re-use of an essential nutrient that is
being wasted. For these reasons, the technologies that promote P re-use within the wastewater
treatment scheme are particularly attractive.
There are already different approaches (see reviews [63, 78, 91]) which vary on the origin of the used
matter (e.g. wastewater, SS and its ashes) and the type of process (e.g. precipitation, wet chemical
extraction, and thermal treatment). The electrokinetic (EK) process can also be an effective technique
for P recovery from these waste streams.
1.2.2. Phosphorus as a contaminant
Contaminations resultant of the inputs of P from point sources (e.g. sewage outfalls) and diffuse sources
(e.g. leaching from agricultural fields) into aquatic ecosystems, cause diverse problems such as toxic
algal blooms which reduces the suitability of aquatic systems for drinking water and recreation may have
a negative impact on public health demanding expensive treatment processes [67]. One fundamental
by the crop, most of the surplus will remain in the soil being added to its P reserve [92]. Soils with
excessive P reserves in turn pose the highest risk to the environment [93], mainly linked to the
hydrological cycle, where rain events can erode the soil enriched with this element into water bodies.
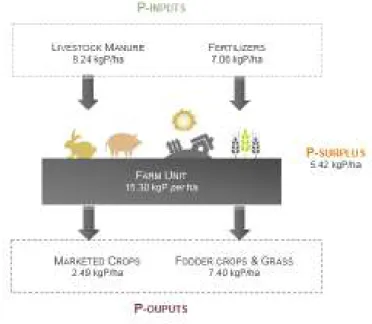
The P balance (inputs and outputs) in Portugal [94] is presented in Figure 1.5 where the difference
between the total annual quantity of P entering the soil and the quantity of P leaving it, based on the
cycle, is showed.
Figure 1.5. Average of total P inputs and outputs in agriculture in Portugal (2005-2008).
The analysis of the P balance in Portugal for the years between 2005 and 2008 shows a surplus of 5.42
kg P/ha. Part of this P-surplus is lost into groundwater due to leaching process or into surface water by
run-off. The resultant of P-inputs from these non-point sources in the freshwater bodies may lead into
an excessive algal growth in dams, lakes and rivers, reducing their suitability for drinking water,
recreation use, requiring expensive treatment processes [67].
Already in 2001, it was determined that, although the trophic status is only known to 55% of the larger
reservoirs in Portugal, 4% proved to be oligotrophic (total P < 10 mg P/m3), 28% mesotrophic (10 mg P/m3 < total P < 35 mgP/m3) and 23% eutrophic (total P > 35 mgP/m3) [95]. In the case of Portuguese Azores islands, from their 24 lakes, almost 50% are eutrophic, nine mesotrophic and four oligotrophic
[96]. Considering that most lakes indicate a consistent increase in the level of the trophic state, the ability
to succeed in combating lake eutrophication by the involvement and cooperation of local inhabitants,
small factories, and farmers in reducing P discharges is very important. Also, to deal with the future
economic and environmental problem of the lack of P sources, it is important to access the possibility
1.3. Electrokinetic process
1.3.1. Principles overview
The electrokinetic (EK) process is based on the application of a low level current (direct or alternate; DC
or AC) density, in the order of a few mA/cm and low potential gradient, in the order of V/cm [97], between
suitably located electrodes (Figure 1.6). The contaminants are moved out of the matrix towards one of
the electrode compartments by three main transport processes: electromigration, electroosmosis and
electrophoresis. Other types of mass transport, like diffusion and fluid advection, are also present to
some extent.
Figure 1.6. Schematic representation of the electrokinetic process (adapted from [98]).
Electromigration is the movement of ions under an applied electric field and is the main transport mechanism for soluble charged species where zeta potential may be small or even absent [99, 100].
Negative ions will move towards the anode whereas positive ions move towards the cathode, from where
ions can be separated by ion exchange or chemical and electrochemical precipitation. The current
efficiency of electromigration of specific ionic species is expressed as the proportion of electrical charge
carried by the species of interest, relative to the amount of charge carried by all charged species in
solution [100].
Electroosmosis is the mass flux of pore fluid relative to soil particles. The electroosmotic flux (EOF) normally goes from the anode to cathode because the species in the diffusive double layer are often
positively charged [99]. It can be from cathode to anode when electrolyte concentration is high and the
pH of pore fluid is low reversing the polarity of the surface charge [97, 101, 102]. Electroosmosis is the
main mechanism for the removal of uncharged or weakly dissociated OCs [103]. The EOF component
will be almost negligent in coarse sands and high plasticity clays at low water contents (electromigration
will dominate). In fine sands, silts and low activity clays, at high water contents and low conductivities,
electroosmotic transport would be as significant as electromigration.
solid phase is stationary (soil systems) [105] but it is very important in unconsolidated soils. If the electric
current is applied to slurry, the role of electrophoresis is significant [106].
Diffusion is the movement of species under a chemical concentration gradient. In general, this is a secondary transport being only significant in some areas of soil where gradients are especially high (like
areas where acid and basic fronts, or metal cations and hydroxyl ions are met).
Generally, fluid advection, the transport mechanism of a substance or conserved property by a fluid due to the fluid's bulk motion, resulting from head hydraulic gradients is an important contribution to global
transport. In some cases, for example, when EK is applied to act as a barrier in order to avoid
groundwater contamination. In this case, hydraulic gradient is an important driving force to the
movement of water and, consequently, of the solved contaminants across the electrical barriers.
Electrokinetic treatment relies on several interacting mechanisms but the dominant and most important
electron transfer reactions that occur at electrodes during the process is the electrolysis of water
(equations 1.1 and 1.2):
H2O → 2 H+ + ½ O2 (g) + 2 e- (anode) (1.1)
2 H2O + 2 e-→ 2 OH- + H2 (g) (cathode) (1.2)
Due to the formation of hydrogen ions in the anode an acid front is carried towards the cathode by
electrical migration, diffusion, advection and pore fluid flow / hydraulic potential difference [97, 107].
Consequently there is a pH decrease near the anode and, at the same time, an increase in the pH near
the cathode due to the formation of hydroxide ions [108]. The hydroxide ions are mobilized towards the
anode by electromigration and diffusion. However, the transport of hydroxide ions is overshadowed by
electroosmotic, advection and neutralization by the hydrogen ions (water is generated at the meeting
point) [97, 101]. The development of an acid and basic front can have significant effects on the
magnitude of electroosmosis as well as on contaminants solubility, ionic state and charge, and level of
adsorption [104].
When the concentration of ions in the electrolytes is increased, other electrode processes may occur at
the surface of the inert electrodes. For example, in the case were Men+ is a metal ion with n positive
charges, it may get deposited at the cathode surface (equation 1.3) or precipitate as oxide, carbonate
and phosphates, depending pH, chemical constituents of the pore water and current flow (equation 1.4)
[104].
Men+ + ne-→ Me (cathode) (1.3)
Me(OH)n + ne-→ Me + nOH- (cathode) (1.4)
If chlorides occur in the solution, chlorine gas can be produced (equation 1.5):
![Figure 1.1. Average of key sources of soil contamination, based on 22 countries/regions [5]](https://thumb-eu.123doks.com/thumbv2/123dok_br/16656004.741992/32.892.110.774.106.342/figure-average-sources-soil-contamination-based-countries-regions.webp)
![Table 1.1. Ranges of heavy metal contents (aqua regia basis) within the soil texture classes [41]](https://thumb-eu.123doks.com/thumbv2/123dok_br/16656004.741992/34.892.143.753.322.642/table-ranges-heavy-metal-contents-regia-texture-classes.webp)
![Figure 1.16. Schematic view of the different components of a HPLC system (from Waters [178])](https://thumb-eu.123doks.com/thumbv2/123dok_br/16656004.741992/56.892.204.683.848.1111/figure-schematic-view-different-components-hplc-waters.webp)