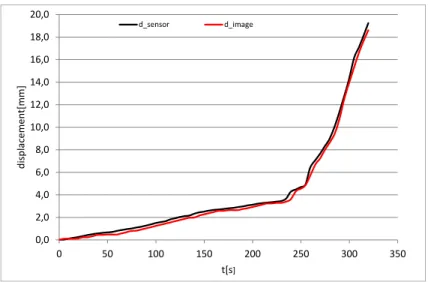
Image Processing for Displacement Measurements
Texto
Imagem


Documentos relacionados
Esta atividade tinha como objetivo estimular a organização espacial e simbólica (através do corte e da colagem), estimulação da perceção visual, orientação
Desta forma a utilização do mesocarpo do coco e do bagaço da cana de açúcar pode se consumar como uma saída para poluições de efluentes líquidos, apesar
Ao analisar os dados obtidos pela citometria de fluxo quanto ao parâmetro (IP negativo/PNA positivo), porcentagem de células que sofreram reação acrossomal sem
7 Furthermore, at 1 year, less than half of UC patients who require steroids have a sustained response, nearly onethird of patients require colectomy, and approximately a quarter
A cáscara sagrada (Rhamnus purshiana) foi descoberta na região oeste da América, mas se adaptou bem no Brasil, sua propriedade é caracterizada como relaxante
Os principais objetivos do presente estudo foram caracterizar a população de recém-nascidos rastrea- dos num hospital nacional do grupo I entre janeiro de 2010 e
Este trabalho consiste na avaliação quantitativa da relação entre a capacidade daqueles buff ers, a taxa de injeção de pacotes na rede e a taxa de sucesso no tráfego numa rede
This is the case of Moiré Interferometry, which is used for many optoelectronic applications as displacement measurements (Wronkowski L., 1995), evaluation of microelectronics
