A Work Project, presented as part of the requirements for the Award of a Masters Degree in Finance from the Faculdade de Economia da Universidade Nova de Lisboa.
CORPORATE CREDIT RATING REPORT - RYANAIR
RAQUEL DE MATOS PEREIRA 2300
A Project carried out on the Masters in Finance course, with the supervision of: Professor Miguel Ferreira
2 CONTENT
INTRODUCTION ... 3
COMPANY PROFILE ... 4
BUSINESS RISK ANALYSIS ... 5
Country and Macroeconomic Risk ... 5
Industry Risk ... 5
Competitive Position ... 7
Profitability/Peer Comparisons ... 10
FINANCIAL RISK ANALYSIS ... 12
Accounting Characteristics ... 12
Financial Governance/Policies and Risk Tolerance ... 13
Cash Flow Adequacy ... 14
Capital Structure and Leverage ... 17
Liquidity/Short-term Factors ... 19
AER LINGUS ANALYSIS ... 21
PROBABILITY OF DEFAULT ... 22
CONCLUSION ... 26
Corporate Credit Rating ... 26
REFERENCES ... 27
3 INTRODUCTION
The purpose of the corporate credit rating report is to provide an independent overview of the company that is being analyzed for investors. This report intends to evaluate several factors in order to assess the credit risk of the company. Thus, the main goal of a credit rating report is to evaluate the likelihood of the analyzed company to fulfill its obligations.
This credit rating report is composed by seven main sections, Introductions, Company Profile, Business Risk Analysis, Financial Risk Analysis, Aer Lingus Analysis, Probability of Default and Conclusion. The Company Profile is a brief explanation of the company in general, an overview of the company’s operations and its position in the market.
Regarding the evaluation of the company’s risk, it is divided into two analyses, the Business Risk Analysis and the Financial Risk Analysis. The Business Risk Analysis is divided into four categories, Country and Macroeconomic Risk, Industry Risk, Competitive Position and Profitability/Peer Comparison. The main goal of this analysis is to understand the company’s environment, mainly the uncertainty that is related with the firm’s business operations given that each business is characterized by particular factors and its evaluation is fundamental to determine the degree of operating risk. Therefore, the score that is attributed to a certain company includes the context in which it operates because there are businesses that are more volatile than others. The factors that need to be evaluated are business’ growth, its stability and the business cycle. After evaluating each category individually, a score for the overall Business Risk is attributed. This evaluation could determine the following score: Excellent, Strong, Satisfactory, Fair, Weak or Vulnerable. The Financial Risk Analysis is divided into five categories, Accounting Characteristics which allows readers to understand how aircrafts are financed (leasing) and the retirement benefits paid by Ryanair, Financial Governance/Policies and Risk Tolerance, Cash Flow Adequacy, Capital Structure and Leverage
4
and Liquidity/Short-term Factors. As in the previous analysis, after the assessment of the risk, a score of the overall Financial Risk is attributed. The score attributed can be the following: Minimal, Modest, Intermediate, Significant, Aggressive or Highly Leverage.
Besides that, there are several aspects that could modify readers’ opinion and, because of that should be mention in the report. The Aer Lingus is particular relevant given that fluctuations in Aer Lingus’s share price exposes Ryanair to credit risk, impacting Ryanair’s results. Given that Ryanair does not exercise any influence over Aer Lingus, this investment is classified as available for sale at its fair value, meaning that variations are recognized in other comprehensive income. The section which includes the Probability of Default measures the likelihood of bankruptcy. Finally, the last section of this report concludes about the credit rating attributed to Ryanair. After reading a credit rating report, the reader should be aware about the company’s risk exposure, its position in the market and factors that represent a risk to the company and could impact its results.
COMPANY PROFILE
Ryanair is an Irish low cost airline founded in 1984 in Swords, Dublin. Ryanair offers low fares, being considered the lowest cost carrier in Europe. The company is also a leader in punctuality and customer service. In the 2015 fiscal year, Ryanair reported total operating revenues of €5,654.0 million and a net profit after tax of €866.7 million. The basic earnings per ordinary shares were €62.59 and the diluted earnings per ordinary shares were €62.46. The company operates on short haul flights and point to point routes and is mainly present across Europe, with 72 bases. On average, the airline provides 1 600 short haul flights per day in roughly 190 airports. Ryanair’s fleet is composed by more than 315 Boeing 737-800 aircraft and six additional aircrafts were acquired on short term as a lease to overcome the increase demand during summer of 2015. Ryanair also owns Aer Lingus Group plc, holding 29.8%.
5 BUSINESS RISK ANALYSIS
Country and Macroeconomic Risk: Ryanair is established in Ireland and the future of the
Eurozone has been subject to speculation, including the future of Ireland. Ireland has considerably improved however the risk of contamination continues present. Additionally, the referendum related with the continuation of U.K. as a member of the Eurozone could affect negatively company’s profitability given that most of its operations are performed in U.K. As a consequence, even though its revenues and operating expenses are denominated in U.K. pound sterling, significant costs, such as fuel, aircraft and insurance are denominated in U.S. dollars, exposing the company to currency risk. A day after the referendum results were announced, U.K. pound sterling suffered a devaluation which negatively impacts Ryanair because the company’s revenues are not denominated in U.S. dollars. Given Ryanair’s financial and operating exposure to the Eurozone, its operating results can be significantly affected by the Eurozone’s condition.
Industry Risk: The main profitability drivers are labor costs, fuel costs and aircraft costs.
Labor costs represent around 35% of operating expense. To overcome this cost Ryanair conducts collective bargaining negotiations with Employee Representative Committees (ERC) through the discussion of labor conditions (salary level and productivity payments) and employees’ interests, aiming to avoid additional costs due to strikes. Besides that, social insurance also represents a relevant cost that should be considered, particularly since Ryanair operates in some jurisdictions with payroll taxes and employee related social insurance costs above average which impacts Ryanair’s results. Thus, employee social insurance contributions vary from jurisdictions and could affect Ryanair’s decision to operate in those jurisdictions with higher social insurance costs.
6
Fuel costs represented 43% of Ryanair’s total operating expenses in the 2015 full year, reason why changes in the fuel price considerable impact the airline’ profitability. To provide protection against fluctuations in fuel prices, Ryanair establishes arrangements such as forward contracts covering periods of up to 18 months of anticipated jet fuel requirements which cover a percentage of its estimated requirements for the fiscal year. Even though hedging activities allow the company to reduce the negative impact of a fuel price increase, this impact cannot be fully eliminated. Historically, Ryanair has been able to hedge around 70% to 90% of its forecast annual volumes. The fuel price is uncertain and difficult to predict because it depends on the crude price which is quoted in U.S. dollars, representing an additional risk, currency risk due to fluctuations in currency exchange rates. The engagement in foreign currency hedging transactions (foreign currency forward contracts) between the euro and the U.S. dollar is expected to reduce currency risk.
The acquisition of aircrafts is extremely costly for airlines leading to high operating leverage. In 2003, Ryanair ordered 200 Boeing 737-MAX-200 (100 firm and 100 options) which are expected to be delivered between 2019 and 2023 and to bring competitive advantage given that have eight more seats and are equipped with the most advanced technology winglets. Ryanair benefited from discounts as well as low cost financing through the issue of two unsecured Eurobonds. In June 2014 the company issued an €850 million seven year, unsecured, Eurobond at a coupon of 1.875% and in March 2015 the company issued the second Eurobond, an €850 million eight year, unsecured, Eurobond at a coupon of 1.125%. Ryanair is investing in more efficient aircraft, equipped with advanced technology, capable to reduce fuel consumption by approximately 18% per seat and the additional eight seats allow the airline to reduce fares by 4% for all customers. Even though the amount spent in aircraft, Ryanair is taking advantage of that by reducing other costs.
7
The Airline Industry is extremely sensitive to changes in economic conditions such as government austerity measures, economic downturns, capital market conditions, unemployment rates and increased business operation costs and changes in jet fuel mostly due to changes in the oil price. Moreover, the airline industry is considered a high risk sector given that it is cyclical, seasonal and capital intensive. The business risk also comprises the industry’s exposure to exogenous events, such as terrorism, war, disease pandemics, weather and volcanic ash emissions. The Airline Industry also suffers from a lack of barriers to entry and there is no customer shifting costs. Some government taxes have been introduced on travel, impacting negatively the volume of passengers. In 2016 it is expected a reduction of the Air Passenger Duty (“APD”) for persons under the age of 16 years.
Demand is mostly driven by GDP Growth, unemployment rate, disposable income and consumer confidence. Thus, reputation represents an important factor during the decision process and low fares airlines have been harmed since their safety is questionable.
The Airline Industry is characterized by high fixed costs, high profit margin pressure, high volatility of earnings, high operating leverage, high labor costs and high sensitivity to interest rates, exchange rates, fuel prices and economic conditions.
Competitive Position: The market position is related with the presence of the airline in
primary or secondary airports. Its presence in primary markets, even with higher operating costs, seems to present higher benefits for the airlines. However, considering a low cost airline and its concern about cost advantage, the market position is not one of the most factors that are important to evaluate when analyzing competitive position as when considering general airlines. Thus, low cost airlines should be focus on its operating efficiency in order to offer the lowest possible cost.
8
Ryanair is the leading low fare airline in Europe, being considered the only true ultra low cost carrier in the European market. It has focused on costs, allowing the company to operate at lower cost per passenger and per available seat when compared with its peers which represents a significant cost advantage. Given that the company operates at lower cost than its competitors, it is possible to explore routes that are considered unprofitable for them and provide the lowest fares on each route. Nonetheless, as a result of the business model adopted by Ryanair its passengers are more sensitive to changes in ticket prices, meaning that, on average, Ryanair’s ticket prices are lower than its peers. Ryanair’s market position is strong given its presence in many secondary airports in Europe and its intention to expand for primary airport due to the growing trend of primary airports in Europe. The company also provides ancillary services including the sale of bus and rail tickets, accommodation services, car parking and attractions which foster diversity. In order to be more competitive and provide low fares, the airline prefers to provide point to point flights, avoiding additional costs (baggage transfer, transit passenger assistance, reimbursement given deals) however this strategy leads to a lack of geographic diversity outside Europe. This fact is particular relevant given the nature of the industry (sensitivity to changes in economic conditions) and the state of the EU economy.
Customer satisfaction and brand reputation has been improving since Ryanair implemented the “Always Getting Better” (AGB) Program, which aims to listen customers, improve in-flight experience and introduce new services. AGB allows Ryanair to understand customers’ needs and desires and improve its services and customer experience. Due to this program, penalty fees were lowered, added the possibility to allocate seats, introduced a free second carry-on bag, three products were introduced which create more offers to customers and new bases at primary airports were opened. Ryanair is also improving customer service by
9
being more punctual, losing less bags and canceling less flight than its peers. These improvements resulted in 90.6 million customers as load factors increased from 83% to 88% from 2014 to 2015, which represents a traffic growth of 11%.
As a low cost airline Ryanair’s competitive advantage rely on its ability to be operating efficient through low operating costs. In order to reduce aircraft equipment costs the company operates in a single aircraft type which lower not only aircraft costs but also the costs associated with training and maintenance. Strikes represent a huge additional cost for airlines and in order to avoid it Ryanair keeps its employees motivated by compensating them based on their performance. Thus, it is possible not only improve profitability given that employees are motivated but also manage the personnel costs. Ryanair’s cost advantage is achieved by entering into contracts with certain suppliers such as external contractors at airports for ticketing and passenger and aircraft handling which allows the company to obtain competitive rates by negotiating fixed prices for several years.
Airport access and service changes have been controlled by Ryanair through the choice for less expensive gate locations as well as outdoor boarding stairs. The expansion to primary airport will represent higher costs since airport charges are higher than in secondary airport. Ryanair believes that its ability to constantly deliver high volume of passenger will benefit the company through the establishment of competitive contracts with those airports.
Ryanair mitigates industry risk through agreements established with Employee Representative Committees (ERC), allowing to maintain good relations with its employees, hedging activities which reduce the impact of fuel prices increases and changes in interest rates and exchange rates, however these risks are not totally eliminated. To be more competitive and offset the capacity decrease during winter months, Ryanair has seasonally grounding aircrafts which reduces variable costs (fuel costs) however this strategy does not allowed the company
10
to avoid fixed costs (aircraft ownership costs). Labor relations are also negatively impacted by this decision because the number and frequency of flights is reduced and Ryanair will not be able to attract flight personnel who are interested in year round employment.
As non fuel costs are lower than its peers, fuel costs as a percentage of overall costs are higher than its peers, around 43% of Ryanair’s total operating expenses in the fiscal year of 2015. Moreover, fuel costs are difficult to control given the uncertainty about the crude price. Therefore, to manage this risk and to reduce its impact on Ryanair’s results, the airline is protected against changes in the fuel price through hedging activities which are more extensive than its peers, covering approximately 90% of its estimated requirements for fiscal year of 2016. The company is also protected against currency fluctuations and changes in interest rates.
Ryanair generates high margins, mainly due to its low cost structure, competitive position in the market and its revenues generated from ancillary services which are an important factor for risk reduction because company’s ability to overcome constraint periods or support a fuel price increase. In 2015, Ryanair reported a profit after taxes increase of 66% to €866.7 million which was driven by an 11% increase in customers, a 5% increase in our load factor and strong cost discipline (11% fuel savings per passenger). This strategy also allowed Ryanair to improve operating revenue (scheduled revenue) by 12% to €5,654.0 million with a 1% increase in total revenue per passenger, increases its total operating expenses by 5% to €4,611.1 million and a fuel costs decrease of 1%. Therefore, operating margin increased to 18% and operating profit increased to €1,042.9 million, representing a 58% increase. Earnings per share increased from €36.96 to €62.59.
Profitability/Peer Comparisons: Peer comparison begins with the establishment of the peer
group which consists on a group of company with similar characteristics. Typically, the companies selected belong to the same industry and present similar size. After the companies’
11
selection, the performance of the company that is being evaluated is compared with the performance of the peer group and it is concluded the company’s performance comparing to the other companies.
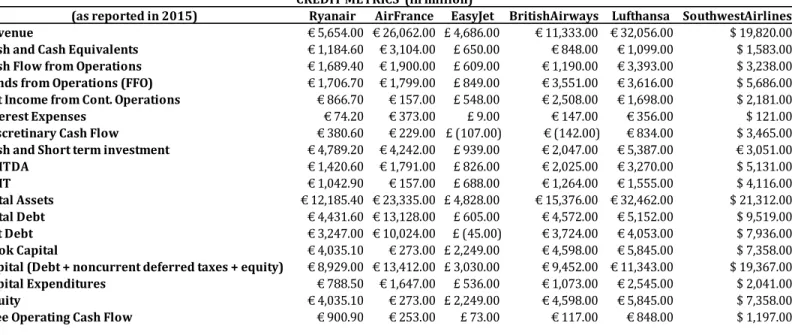
The peer group is Air France, EasyJet, British Airways, Lufthansa and Southwest Airlines. The selection of this group is based on the services offered as low cost airline because, even though they do not belong to the same region, it is a business which crosses boundaries and selecting a group restricted to the region could be ineffective.
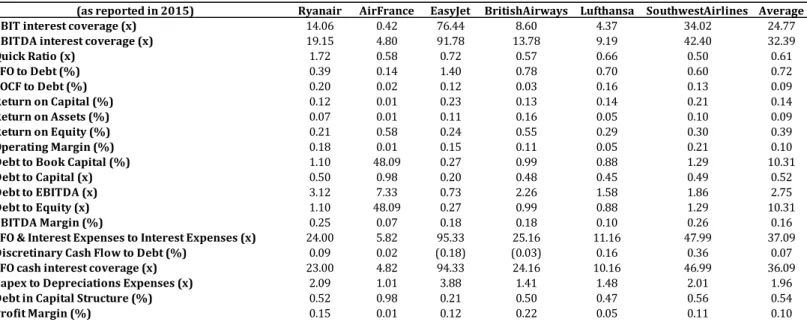
In order to evaluate Ryanair’s profitability, its ratios were compared with the ratios presented by its peers. Thus, as in this section the main goal is to evaluate Ryanair’s operating efficiency, operating margin, profit margin and EBITDA margin were taken into consideration. Comparing Ryanair with its peers, as can be observed in Table 5, the company was the second best performer considering the operating margin since, for the same period, Ryanair presented an operating margin of 18% while Southwest Airlines presented 21%, Air France, EasyJet, British Airways and Lufthansa presented 1%, 15%, 11% and 5%, respectively. Considering the Profit Margin, the best performer was British Airways with 22%, following by Ryanair with a profit margin of 15%. Finally, considering the EBITDA margin, Ryanair is once again the second best performer with an EBITDA margin of 25% and the best performer is Southwest Airlines with 25%.
A key ratio that is important to analyze when evaluating the profitability of a company is the return on equity (ROE), which measures profit generated with the money invested by shareholders. Considering this ratio, Ryanair has underperformed in relation to its peers, the company presented a ROE of 21% and the peers’ average was 39%.
By focusing the analysis on earnings, it is possible to conclude if a certain company is able to pay back its obligations, such as interest expenses. With respect to the EBIT and
12
EBITDA interest coverage, EasyJet and Southwest Airlines performed better than Ryanair because both airlines present high ratios than Ryanair, meaning that their margin of safety is higher. The margin of safety of a certain company is higher when this company is more solvent, in order words, when the company is able to cover its obligations. The principal Credit Metrics of each peer can be observed in Table 4.
FINANCIAL RISK ANALYSIS
Accounting Characteristics: Given the aircraft acquisition costs, Ryanair financed aircraft
with leases. In 2015, Ryanair had 51 operating lease aircraft in the fleet, having the possibility to acquire or not the aircraft at the end of the lease contract. 18 of these agreements are denominated in euro and the remaining 33 are denominated in U.S. dollars, obliging the airline to pay fixed rentals in U.S dollars and exposing Ryanair to currency fluctuations. On 31 of the 51 leases, the company has the option to expand the contract. In 2015, Ryanair leased six additional aircrafts on the short term to increase capacity for summer. Overall, aircraft rental totals €109.4 million in the 2015 which represent an increase of 7.9% from the amount reported in 2014 due to the six additional leases and offset by the reduction of leased aircraft, from 55 in 2014 to 51 in 2015. To reduce the impact of interest rate and currency fluctuations, the company converts a portion of its floating rate exposure into fixed rate exposure through interest rate swaps and cross currency interest rate swaps. Ryanair also has 30 finance leases to finance Boeing 737-800 aircrafts with 13 year and denominated in euro, called Japanese operating leases with call options. As a call option, Ryanair has the option to purchase Boeing 737-800 aircrafts at a predefined price after a period of 10.5 years.
Ryanair also has post retirement benefits that are paid in a form of pension which are fixed payments with no legal or constructive obligation to pay further amounts and post employment benefit plans. Regarding defined contribution benefit plans and other pension
13
arrangements, costs were €3.2 million in 2015 while costs associated with the defined benefit plans were €0.3 in 2015.
Financial Governance/Policies and Risk Tolerance: Since 2008, Ryanair returned around €3
billion to its shareholders through six share buybacks and three special dividends. The company has not a discretionary distribution policy, meaning that no further commitment was made to shareholders regarding the payment of dividends, share buybacks or other way of shareholders distributions. In fiscal 2015, Ryanair paid a special dividend of €520.3 million (€0.375 per share), in line with special dividends paid in past years and bought back 10.9 million order shares, totaling €112.0 million. The company also announced to pay €400 million through a share buyback program. The total amount spent in share buyback programs was €1,326.7 million which comprises 226.6 million ordinary shares, including ADRs (five ordinary shares). Given that the number of shares outstanding increases, earnings per share (EPS) also increases and an abnormal positive return is normally observed at the announcement date. This decision also impacts creditors given that this is a form of a company to return cash to its shareholders, meaning that its ability to payback its creditors is jeopardized.
To address the risk of changes in fuel price due to crude price fluctuations, currency and interest rate fluctuations, Ryanair entered into several hedging agreements, aiming to reduce its exposure to those risks. Hedging activities do not eliminate risks completely, they only provide protection against those risks. Regarding Ryanair’s protection against fuel price changes, the company entered into arrangements that cover approximately 90% of its forecasted requirements for 2016 at around $910 per metric ton. Generally, the company entered into forward contracts, anticipating 18 months prior to the jet fuel requirement. Besides that, Ryanair also hedged 90% of its estimated fuel related dollar purchase against the euro at $1.33
14
per euro for 90% because the crude price is quoted in U.S. dollars. To hedge against currency fluctuations, the airline entered into foreign currency forward contracts.
Since the airline industry requires airlines to be highly leverage mainly due to its fixed costs and the cost of aircraft acquisitions, Ryanair is exposed to interest fluctuations. To be protected against interest rate fluctuations, the company converts part of its floating rate debt into fixed rate debt through interest rate swaps. In this case, Ryanair also uses cross currency interest rate swaps because borrowings are denominated in several currencies.
Ryanair’s revenues are denominated in two currencies, euro and U.K. pound sterling, accounting 63% and 27% respectively, while its operating expenses are primarily denominated in euro, U.K. pound sterling and U.S. dollars (fuel costs) and Ryanair’s results are reported in euro, exposing the company to currency risks. Therefore, euro appreciation positively impacts Ryanair’s operating income because the euro equivalent of its U.S. dollar operating costs decreases while euro depreciation negatively impacts Ryanair’s results. In order to be protected against those events, Ryanair shortfalls in U.K pound sterling and hedge its operating surplus through euro/U.K. pound sterling forward contracts.
Cash Flow Adequacy: The main objective of this particular analysis is to understand the
company’s ability to generate sufficient cash from its operations to cover its debt or whether, on the contrary, it is required to borrow. Therefore the cash flow adequacy is considered a measure of sufficiency and liquidity because if there is the case that the company does not generate enough cash flow from its operations to cover its obligations, it is a signal that the company has liquidity problems. Airline Industry is characterized by a significant portion of fixed assets, primarily due to airlines’ fleet, as well as significant depreciation expenses. Thus, it is relevant to analyze the company’s ability to generate cash flows.
15
Ryanair presents a strong cash flow generation when compared with its peers with cash and liquid resources of €4,795.9 million in March 31, 2015. From the first quarter of the fiscal 2015 to the first quarter of the fiscal 2016, Ryanair increases operating revenues from €1,495.7 million to €1,652.7 million, as presented in Table 1, mainly due to a 16% increase in traffic, a 6 points increase of load factor and a 14% fuel saving per passenger. Thus, Ryanair’s operating profit in the first quarter of the fiscal 2015 was €231.8 million and in the first quarter of the fiscal 2016 its operating profit was €288.4 million, which was offset by an increase in operating expenses from €1,263.9 million in the first quarter of fiscal 2015 to €1,364.3 million in the first quarter of fiscal 2016 because the Ryanair’s growth implies higher costs. In the first quarter of fiscal 2016, the company reported cash and cash equivalents of €4,881.2 million.
The profit after tax in the fiscal 2015 was €866.7 million, as presented in Table 3, increasing 65.8% when compared with the result reported in the fiscal 2014, primarily due to the increase of average fares of 1.4%, the traffic increase of 10.9%, a 5 points increase of load factor and a 10.8% fuel saving per passenger. Furthermore, revenues from schedules passenger also increased in the 2015 fiscal year from €3,789.5 million in the 2014 fiscal year to €4,260.3 million, increasing 12.4%, which can be explained by an increase in the passenger volume on existing routes and in the new bases opened in 2015. The passenger volume increase is sustained by the increase of the number of aircrafts in the fleet. Ryanair´s ancillary services revenues also increased 11.7% from the 2014 fiscal year to 2015 fiscal year, €1,247.2 million and €1,393.7 million respectively. As a result, Ryanair’s total operating revenues in the 2015 fiscal year was €5,654.0 million, increasing roughly 12% from the 2014 fiscal year.
Car rental increased by 15.0%, in light sales increased by 9.2% and Internet related services decreased by 13.9%. Even though total operating expenses increased by 5.3%, Ryanair’s revenues increased at a faster rate, 12.3%. Per passenger, total expenses increased by
16
5.0%, mainly due to the increase in the airport and handling charges, route charges were also observed since Ryanair decided to open new routes at primary airports, where costs are expected to be higher. This result was offset by a fuel costs decrease of 10.8%. Regarding the staff costs, in absolute terms an increase of 8.5% was observed from the 2014 fiscal year to the 2015 fiscal year (from €463.6 million to €502.9 million), reflecting the overall growth of the airline. Nonetheless per passenger staff costs decreased 2.3%.
Ryanair’s growth was supported by a marketing campaign, representing an increase of 21.3% in Ryanair’s marketing and distribution costs, 9.3% increase per passenger. Maintenance, materials and repairs increased 4.9% per passenger (16.2% in absolute terms) due to the renegotiation of maintenance contracts, launch of new bases and the strength of U.K pound sterling to the euro. As a result, operating profit from 2014 fiscal year to 2015 fiscal year increased 42.8% per passenger, from €658.6 million to €1,042.9 million.
Finance expenses decreased 10.8% because interest rate decreased from 2014 fiscal year to 2015 fiscal year however this amount is expected to increase in the following years given the Ryanair’s desire to increase its fleet. The finance expenses decrease led to a finance profit increase of 8.5%, from €16.5 million in the 2014 fiscal year to €17.9 million in the 2015 fiscal year. In the 2015 fiscal year an appreciation of the U.S. dollars against euro was observed, leading to a foreign exchange loss of €4.2 million in the 2015 fiscal year.
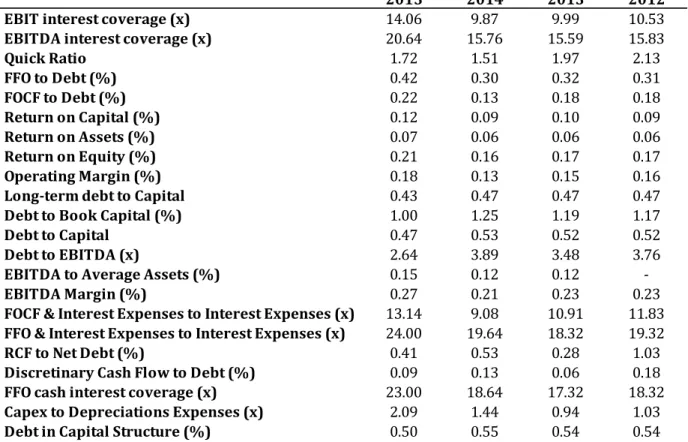
In the fiscal year 2015 the EBITDA was €1,531.80 million, an increase of €480.40 million relative to the fiscal year 2014, as observes in Table 1. As a result and presented in Table 2, EBITDA interest coverage in the fiscal year 2015 was 20.64 while in the fiscal year 2014 was 15.76, meaning that the company improved its ability to pay interest expenses. EBIT interest coverage was 14.06 in the fiscal year 2015 and 9.87 in the fiscal year 2014. Regarding the company´s ability to generate enough cash flows to cover its debt, in the fiscal year of
17
2015, funds from operation (FFO) to debt was 42% and free operating cash flow (FOCF) to debt was 22%. EBITDA margin was 27%. This interest coverage is considered sufficient to coverage the expected additional capital expenditure due to the willingness to increase Ryanair’s fleet.
Capital Structure and Leverage: In the 2015 fiscal year, Ryanair increases its leverage, to
finance the acquisitions of new Boeing 737 aircrafts and it is expected to continue increasing, in order to cover the aircraft delivers between September 2014 and November 2023. On average, Ryanair has financed its borrowings with an interest rate of 2.01%, however in order to avoid a downgrade, leading to higher financing costs, the company should prefer capital markets to issue additional debt, to finance its future aircraft delivers, for instance. By issue additional debt, the interest rate increases because the creditworthiness of company aggravates given that it is perceived by the market as a higher probability of default since the company has to payback its obligations. As the risk increases, there is a higher probability of default and a downgrade could occur.
Even though the strategy of growth adopted by Ryanair seems to be sustainable, there is no guarantee that Ryanair’s revenues and passenger traffic will growth as expected. In this case, Ryanair will suffer from overcapacity, negatively impacting company’s financial position given its debt obligations.
Even though the observed decrease of the interest rate charged from €83.2 million to €74.2 million in the 2014 fiscal year and in the 2015 fiscal year, respectively, corresponding to a 10.8% decrease, the amount charged is expected to increase in the following years given that the Ryanair’s willingness to expand to new routes and bases, mostly to primary airports which entails extra aircrafts to its fleet, increasing leverage. The company intends to finance new aircrafts through not only internal sources (cash flow generated from operations) but also
18
through external sources as commercial banks, capital markets (unsecured and secured), commercial debt and sale and operating leasebacks. The acquisition of aircrafts also led to the increase of capital expenditures from €505.8 million in the 2014 fiscal year to €788.5 million in the 2015 fiscal year.
The 348 contract to the acquisition of Boeing were financed with 66% US Export Import Bank loan guarantees and capital markets, 24% through sale and operating leaseback and 10% through Japanese operating leases with call options. The acquisition of aircrafts through US Export Import Bank loan guarantees became less attractive as before given the increase of the fee for the provision of loan guarantees, making this form of financing more expensive. Regarding operating leases, their advantage is to have the option to acquire or not the aircraft that is subject to these conditions at the end of the lease. At March 2015, Ryanair had 51 aircrafts in these conditions, 18 of them denominated in euro and the remaining 33 leases denominated in U.S. dollar. The company financed 30 of its aircraft through a Japanese operating leases denominated in euro with call option, being considered a finance leases.
At March 2015, Ryanair’s long term debt was €4,431.6 million, namely due to the two unsecured eurobond issued in June 2014 and March 2015. The aircrafts were mostly funded through loan facilities with a loan guarantees from Export Import Bank. Ryanair converted part of its floating rate debt into fixed rate debt to be protected against interest rate fluctuations through interest rate swaps. Additionally, the company also uses cross currency interest rate swaps since its debt is denominated in several currencies.
Debt to EBITDA ratio in the fiscal year 2015 was 2.64 (see Table 2). Given the industry characteristics, the Ryanair’s ability to service debt is adequate, having flexibility to increase debt in order to acquire aircrafts and explore new routes. Considering the retained cash flow
19
(RCF) to net debt, which represents the company’s ability to generate enough cash to pay debt after dividends have been paid, in the fiscal year 2015, RCF to net debt was 41%.
Liquidity/Short-term Factors: Ryanair’s cash requirements are mostly to acquire aircrafts,
including their payment in advance, payment of debt, corporate taxes, special dividends and share buyback. Ryanair’s working capital requirements are financed through cash generated from operations, debt capital market issuances and bank loans, for instance to acquire aircrafts. From June 2014 to March 2015, cash generated from operations increased from €1,689.4 million to €1,690.9 million, however the cash used also increased given that Ryanair increased its fleet, paid special dividends (€520.3 million), repaid borrowings (€419.7 million) and purchased ordinary shares (10.9 million) through share buyback (€112.0 million). Thus, net cash inflows from operations increased €644.8 million (from €1,044.6 million to €1,689.4 million), primarily due to an increase in profit after tax (€343.9 million), as well as, an increase in accrued expenses (€364.4 million) which is explained by cash received in advance for flights, other receivables and an increase in other payables balances, accounting €407.0 million. Cash generated from working capital increased 204%, given the increase in cash received in advance from bookings.
Ryanair has a strong liquidity position given the amount of cash and cash equivalents that holds every year, representing 21% of its revenues in the fiscal year of 2015. The amount of cash and short term investment is also considered reasonable, about €4,789.20 million which represents 85% of company’s revenues. Therefore, the company is more capable and suitable to address potential risk that can arise, such as crude price fluctuations. This position also allows the company to borrow at low rates.
Regarding debt capital market issuances, the company issued €850.0 million of unsecured eurobonds with a 7 year tenor in June 2014 at 1.875% and in March 2015 issued
20
€850.0 million of unsecured eurobonds with an 8 year tenor at 1.125% which combined with the cash generated from operations are the primary sources of cash requirements. Therefore, cash and liquid resources increased from €3,241.7 million to €4,795.9 million which comprises €6.7 million in restricted cash held on deposits as collateral and €13.3 million in other banking arrangements.
In the 2015 fiscal year, Ryanair used €2,888.2 million in net cash in investing activities because increased its investment of cash with maturities not exceeding three months. In the same period, the net cash from financing activities amounted €653.3 million given the two unsecured eurobonds issued (€850.0 million each issue), the payment of the special dividend (€520.3 million), the purchase of shares buyback (€112.0 million) and the repayment of borrowings (€419.7 million). Restricted cash accounts €6.7 million and are recorded on deposits as collateral that will be used in derivative financial instruments agreements.
As already mentioned, Ryanair acquired new Boeing 737 aircraft during the 2015 fiscal year, representing a capital expenditure of €788.5 million, higher than the amount spent in the 2014 fiscal year, €505.8 million. This acquisition was mostly financed through external sources, such as bank loans. At March 31, 2015, Ryanair’s fleet were composed by 308 Boeing 737-800 aircrafts, being 202 of those financed by Export Import Bank guaranteed financing, 26 funded through Japanese operating leases with call option, exposing the company to currency risk, 6 were financed with commercial debt financing, 51 through operating lease arrangement, 11 with own resources and 12 have no outstanding debt remaining. Ryanair has been capable to meet its working capital requirements and given the results reported, it is expected to be capable to meet its requirements for capital expenditures as well as other requirements for the 2016 fiscal year. Ryanair’s intention is to finance new aircrafts by combining internal sources
21
(cash flow generated from operations) with external sources (commercial banks, capital markets, commercial debt and sale and operating leasebacks).
In conclusion, Ryanair used cash and cash equivalents to finance its operations while uses derivative financial instruments to manage its risks. The company has been shown a strong capital base, primarily given its concern about investors’, creditors’ and market confidence and to preserve its financial resources, which could be sufficient to cover risks faced by the company, such as fuel price, currency and interest rate fluctuations. The exposure to exogenous events also represents a threat that the company should be protected against. Ryanair’s cash and liquid resources were €4,795.9 million at March 31, 2015.
AER LINGUS ANALYSIS
In 2006, Aer Lingus Group plc was partial privatized and Ryanair acquired 25.2% of the company. Later, in 2008, Ryanair increased its interest to 29.3% and to 29.8% during 2009, totaling €407.2 million as an aggregate cost. After the initial acquisition, Ryanair made an offer to acquire the entire Aer Lingus because Ryanair’s management considered the acquisition an opportunity to build a stronger Irish airline, capable to compete against with larger airline, such as Lufthansa and Air France in Europe. Nonetheless, in June 2007, this offer was prohibited by European Commission for competitive reasons. Ryanair appealed to this decision but the Court of First Instance (CFI) confirmed the decision taken by the European Commission. Besides that, Aer Lingus also appealed to the CFI, arguing that Ryanair should be obliged to sell its shares and, based on the European Merger Regulation, CFI rejected the Aer Lingus’ appeal. Even though Ryanair has been protected under the European Merger Regulation, legislation can change and the company will be forced to sell its shares, representing significant losses.
In 2008, Ryanair made another offer to acquired Aer Lingus which included to maintain both companies separately. The offer included all the ordinary shares that Ryanair did not own
22
at that time at €1.40 per each ordinary share, paying a premium of 25% over the closing price (€1.20), and an improvement in Aer Lingus operations, such as the duplication of Aer Lingus’ short haul fleet, from 33 to 66, and the creation of 1 000 new jobs. The Ryanair’s position got worse in 2013 when the European Commission ordered Ryanair to reduce its interest to 5%, decision that Ryanair appealed to the Central Administrative Tribunal (CAT), CAT accepted Ryanair’s appeal and the company appealed to the UK Court of Appeal in 2014, decision that was rejected in 2015. Ryanair even tried to appeal to the Supreme Court however the permission was refused.
Ryanair made a third offer to acquire Aer Lingus in 2012 but instead of €1.40 per each ordinary share not owned offered €1.30 per each ordinary share, representing a premium of 38% over the closing price (€0.94). The offer was once again prohibited by the European Commission and Ryanair appealed to the European General Court, decision that is expected in 2016. Besides that, in 2015, recommended by the Board of Directors of Aer Lingus, the International Airline Group (IAG) offered €2.50 per ordinary share and €0.05 ordinary dividend, offer that should be accepted by the Irish Government and Ryanair (Aer Lingus’ key shareholders) and approved by European Authorities. Ryanair already accepted the offer for Ryanair’s 29.8% shareholding in Aer Lingus.
There are several factors that affect the Aer Lingus’s share price, exposing Ryanair to credit risk, an increase or decrease by 10% results in €37.1 million increase or decrease respectively in the fair value of the available-for-sale financial assets.
PROBABILITY OF DEFAULT
In 1968, Altman developed the Z-score model which measures the likelihood of bankruptcy, given five financial ratios, representing the firm’s liquidity, profitability, leverage, solvency and activity. The model was created based on a sample of 66 corporations with 33
23
firms in bankruptcy, called the distressed group, and 33 firms in non-bankruptcy. After analyzing both groups, five ratios were selected as the best predictors for corporate bankruptcy. Finally, coefficients were attributed to each predictor based on its relevance to the overall score.
The Z-score derives from the weighted average of these five components and can be expressed as: -score 1.2 1 1.4 2 3.3 3 0.6 4 5 where 1 orking CapitalTotal Assets represents the
firm’s liquidity, 2 Retained EarningsTotal Assets represents the firm’s profitability, 3 Total AssetsEBIT represents
the firm’s leverage, 4 Market CapitalizationTotal Debt represents the firm’s solvency and 5 Total AssetsSales
represents the firm’s activity.
Once a score is computed to a certain company, its likelihood of bankruptcy can be concluded. If Z-score is below 1.81, the company is considered bankrupt, called “bad firm”, conversely, if Z-score is above 2.99 is considered non-bankrupt, called “good firm”. A -score between 1.81 and 2.99 is considered the “gray area”, meaning that an error is susceptible.
Table 7 shows the five financial ratios for the fiscal year 2015 for Ryanair and its peers that were computed based on the metrics presented in Table 6. As a result, the Z-score of Ryanair is 3.95, being considered a “good” firm and likely to be concede credit because Z is higher than 1.81. Besides that, the Z-score of Ryanair is higher than 2.99, meaning that Ryanair is not likely to go to bankruptcy.
When compared with its peers, it is possible to conclude that EasyJet is the airline with the highest Z-score (5.78), meaning that is considered the most trusted of this group whereas Air France is considered a “bad” firm because the -score is 0.77 which is below 1.81 and presents the lowest Z-score of the group.
24
Another method that can be used to calculate the probability of default of a company at a certain period in time is the Merton Distance to Default (DD) Model, which expresses the expected default frequency (EDF). Following the Merton DD model, the probability of default consists on the difference between the face value of the firm’s debt and its estimated market value and, after that, is divided by the estimated firm’s volatility. The result is defined as the distance to default and evaluates the probability of the value of a certain company to fall below a default threshold, meaning that the firm’s value is less than its face value of debt.
To compute the probability of default, the Merton DD model assumes that the firm’s value follows a geometric Brownian motion:
(1) where V represents the total value of the firm, μ represents the expected continuous compounded return on V, is the firm’s volatility and is the Wiener process. Besides the assumption already mention, another assumption is made by the Merton DD model, there is only one discount bond issue which matures in T periods.
Therefore, it is assumed that the firm’s equity is a call option, being the strike price its face value of debt and matures and at time T. The firm’s equity value is a function of the firm’s total value and described by the Black-Scholes-Merton Formula:
(2)
where E represents the market value of the firm’s equity, F represents the face value of the firm’s debt, r is the risk-free interest rate, is the cumulative standard normal distribution function, is given by equation (3) and is given by equation (4).
(3)
25
The Merton DD Model has in consideration the firm’s volatility and the volatility of its equity, which is expressed by the following equation,
(5)
as
and under the assumptions, it is possible to relate firm’s volatility and its equity
volatility by (6) with defined in equation (3).
(6) The value of V is not computed, meaning that it should be inferred as well as the while E is obtained in through the multiplication of the number of shares outstanding by its current stock price.
In order to calculate the through equation (6), it is assumed a time horizon of 1 year (T = 1) and it is required to obtain the risk-free rate and the firm’s market equity to compute equation (3) and (4). Then, the value of E is obtained through equation (2) and after that, the value of is calculated. The distance to default (DD) is computed following equation (7).
(7)
corresponds to the expected growth rate of the assets, also called the expected default frequency (EDF), being considered the probability of default.
In order to avoid to compute equation (2) and (5) given its complexity, simplifying the model, an alternative is suggested, the naïve model. The model is simplified assuming that the face value of debt is equal to the firm’s market value of debt, meaning that and its volatility is given by equation (8), which has into consideration the term structure volatility through the five percentage points and the default risk by multiplying the equity volatility by 25%.
26
(8) Therefore, the total firm volatility can be expressed by equation (9).
(9)
Then, the naïve distance to default is computed trough equation (10).
(10)
where corresponds to the which represents to the expected return of assets
and is considered to be equal to the firm’s stock return over the previous year. Finally, the naïve probability of default is computed as presented in equation (11).
(11)
For the fiscal year 2015 and applying the Naïve alternative to Merton Model, Ryanair’s distance to default was €68.13. To compute the distance to default, it was considered a total debt of €4,049.00 million, a market capitalization of €17,909.00 million and a firm’s stock return over the previous year of 0.17%. Therefore, the corresponding firm’s volatility is 2.48%, which results in a null probability of default.
Ryanair, as well as EasyJet, Bristish Airways and Southwest Airlines present a null probability of default, however, EasyJet has the highest distance to default (£89.08) as shown in Table 8. The probability of default of Lufthansa is residual and Air France is the worst competitor, with a probability of default of 1.62%, corresponding a distance to default of €2.14.
CONCLUSION
Corporate Credit Rating:
Profile Assessments:
Business Risk – Satisfactory
27
A corporate credit rating of for Ryanair reflects a satisfactory business risk due to company’s exposure to the speculation in the Eurozone given the crisis. Even though the Ireland´s environment is considered safe and stable, there is a risk of contamination which could compromise Ireland´s stability. Besides that, the referendum related with the continuation of U.K. as a member of the Eurozone could also impact country’s stability. Given the industry characteristics that the company operates, Ryanair is also exposed to currency and crude price fluctuations, as well as, the cyclicality of the business. Most of business risk is mitigated through hedging activities however its total elimination is impossible. Ryanair high profitability is considered a positive factor when assessing the rating, which can be explained by its operating efficiency. The company operates in many airports at lower costs than its peers, allowing high margins. The minimal financial risk is explained by company’s’ strong generation of cash flow, namely cash flow from operations.
Besides that Ryanair exposed to several risks given the industry characteristics, as already mentioned, and Aer Lingus’s share price changes, exposing Ryanair to credit risk. The airline also intends to increase its fleet which will increase its capital expenditures. The expansion program to new routes and bases will be executed through the acquisitions of new aircrafts with the combination of external and internal sources. Even though the strong cash generation, the company is high leverage, not only due to industry characteristics but also because of its policy to have a considerable liquidity in cash.
REFERENCES
Ryanair. 2005. Annual Report 2005. https://investor.ryanair.com/wp-content/uploads/2015/07/Annual-Report-2015.pdf (accessed June 1, 2016)
28
DBRS. 2016. Rating Companies in the Airline Industry.
http://dbrs.com/research/280668/rating-companies-in-the-airline-industry.pdf (accessed June 3, 2016)
DBRS. 2014. Methodology – Rating Companies in the Airline Industry. http://www.dbrs.com/research/270312/rating-companies-in-the-airline-industry-archived.pdf (accessed June 6, 2016)
Air Airline Analyst. 2013. TAA Financial Ratings Methodology. https://airfinancejournal.com/docs/2014/TAAFRSMethodology.pdf (accessed June 8, 2016) Global Credit Portal Standard & Poor’s. 2010. Key Credit Factors: Criteria For Rating The Airline Industry. http://www.maalot.co.il/publications/MT20120322152358.pdf (accessed June 10, 2016)
Air Airline Analyst. 2013. TAA Financial Ratings Methodology. https://airfinancejournal.com/docs/2014/TAAFRSMethodology.pdf (accessed June 8, 2016)
Standard & Poor’s. 2001. Corporate Ratings Criteria.
http://regulationbodyofknowledge.org/wp-content/uploads/2013/03/StandardAndPoors_Corporate_Ratings_Criteria.pdf (accessed June 17, 2016)
Moody’s. 2012. Key Drivers of Rating Actions on Firms with Global Capital Markets Operations. https://www.moodys.com/researchdocumentcontentpage.aspx?docid=PBC_143246 (accessed June 17, 2016)
Global Credit Portal Standard & Poor’s. 2008. 2008 Corporate Criteria: Ratios And Adjustments.
http://www.maalot.co.il/data/uploads/pdfs/1.2008_Corporate_Criteria_Ratios_And_Adjustment s.pdf (accessed June 20, 2016)
29 Standard & Poor’s Ratings Direct. 2013. Corporate
Criteria: Ratios And Adjustments.
https://www.standardandpoors.com/ja_JP/delegate/getPDF?articleId=1494794&type=COMME NTS&sub (accessed June 20, 2016)
The Journal of FINANCE. 1968. Financial Ratios, Discriminant Analysis And The Prediction Of Corporate Bankruptcy. https://www.raggeduniversity.co.uk/wp-content/uploads/2016/08/FINANCIAL-RATIOS-DISCRIMINANT-ANALYSIS-AND.pdf (accessed July 2, 2016)
T. Bharath, Sreedhar and Shumway, Tyler. 2008. “Forecasting Default with the Merton Distance to Default Model”. Ross School of Business, University of Michigan Paper 3 2008
30
2015 2014 2013 2012
Revenue € 5,654.00 € 5,036.70 € 4,884.00 € 4,390.20
Cash and Cash Equivalents € 1,184.60 € 1,730.10 € 1,240.90 € 2,708.30
Cash Flow from Operations € 1,689.40 € 1,044.60 € 1,023.50 € 1,020.30
Funds from Operations (FFO) € 1,706.70 € 1,243.20 € 1,245.40 € 1,189.00
Net Income from Cont. Operations € 866.70 € 522.80 € 569.30 € 560.40
Interest Expenses € 74.20 € 66.70 € 71.90 € 64.90
Discretionary Cash Flow € 380.60 € 538.80 € 221.30 € 702.70
Cash and Short term investment € 4,789.20 € 3,228.40 € 3,534.30 € 3,480.50
EBITDA € 1,531.80 € 1,051.40 € 1,121.20 € 1,027.40
EBIT € 1,042.90 € 658.60 € 718.20 € 683.20
Long term debt, including capital lease obligations € 3,649.40 € 3,625.20 € 3,498.30 € 3,499.30
Total Debt € 4,049.00 € 4,093.10 € 3,898.20 € 3,867.70 Net Debt € 2,864.40 € 2,363.00 € 2,657.30 € 1,159.40 Book Capital € 4,035.10 € 3,285.80 € 3,272.60 € 3,306.70 Capital € 8,546.40 € 7,747.50 € 7,517.30 € 7,493.80 Capital Expenditures € 788.50 € 505.80 € 310.70 € 317.60 Equity € 4,035.10 € 3,285.80 € 3,272.60 € 3,306.70
Free Operating Cash Flow € 900.90 € 538.80 € 712.80 € 702.70
Credit Metrics (€ in million)
2015 2014 2013 2012
EBIT interest coverage (x) 14.06 9.87 9.99 10.53
EBITDA interest coverage (x) 20.64 15.76 15.59 15.83
Quick Ratio 1.72 1.51 1.97 2.13 FFO to Debt (%) 0.42 0.30 0.32 0.31 FOCF to Debt (%) 0.22 0.13 0.18 0.18 Return on Capital (%) 0.12 0.09 0.10 0.09 Return on Assets (%) 0.07 0.06 0.06 0.06 Return on Equity (%) 0.21 0.16 0.17 0.17 Operating Margin (%) 0.18 0.13 0.15 0.16
Long-term debt to Capital 0.43 0.47 0.47 0.47
Debt to Book Capital (%) 1.00 1.25 1.19 1.17
Debt to Capital 0.47 0.53 0.52 0.52
Debt to EBITDA (x) 2.64 3.89 3.48 3.76
EBITDA to Average Assets (%) 0.15 0.12 0.12
-EBITDA Margin (%) 0.27 0.21 0.23 0.23
FOCF & Interest Expenses to Interest Expenses (x) 13.14 9.08 10.91 11.83 FFO & Interest Expenses to Interest Expenses (x) 24.00 19.64 18.32 19.32
RCF to Net Debt (%) 0.41 0.53 0.28 1.03
Discretinary Cash Flow to Debt (%) 0.09 0.13 0.06 0.18
FFO cash interest coverage (x) 23.00 18.64 17.32 18.32
Capex to Depreciations Expenses (x) 2.09 1.44 0.94 1.03
Debt in Capital Structure (%) 0.50 0.55 0.54 0.54
Key Ratios
APPENDICES
Table 1 –Credit Metris: Ryanair
31 2015 2014 2013 2012 Sales € 5,654.00 € 5,036.70 € 4,884.00 € 4,390.20 % Change 12.3% 3.1% 11.2% EBIT € 1,042.90 € 658.60 € 718.20 € 683.20 % Change 58.4% -8.3% 5.1% % Sales 18.4% 13.1% 14.7%
Operating Cash Flow € 1,689.40 € 1,044.60 € 1,023.50 € 1,020.30
% Change 61.7% 2.1% 0.3%
% Sales 29.9% 20.7% 21.0%
Net Income € 866.70 € 522.80 € 569.30 € 560.40
% Change 65.8% -8.2% 1.6%
% Sales 15.3% 10.4% 11.7%
Free Cash Flows € 900.90 € 538.80 € 712.80 € 702.70
% Change 67.2% -24.4% 1.4%
% Sales 15.9% 10.7% 14.6%
Operating Summary
(as reported in 2015) Ryanair AirFrance EasyJet BritishAirways Lufthansa SouthwestAirlines Revenue € 5,654.00 € 26,062.00 £ 4,686.00 € 11,333.00 € 32,056.00 $ 19,820.00 Cash and Cash Equivalents € 1,184.60 € 3,104.00 £ 650.00 € 848.00 € 1,099.00 $ 1,583.00 Cash Flow from Operations € 1,689.40 € 1,900.00 £ 609.00 € 1,190.00 € 3,393.00 $ 3,238.00 Funds from Operations (FFO) € 1,706.70 € 1,799.00 £ 849.00 € 3,551.00 € 3,616.00 $ 5,686.00 Net Income from Cont. Operations € 866.70 € 157.00 £ 548.00 € 2,508.00 € 1,698.00 $ 2,181.00
Interest Expenses € 74.20 € 373.00 £ 9.00 € 147.00 € 356.00 $ 121.00
Discretinary Cash Flow € 380.60 € 229.00 £ (107.00) € (142.00) € 834.00 $ 3,465.00 Cash and Short term investment € 4,789.20 € 4,242.00 £ 939.00 € 2,047.00 € 5,387.00 € 3,051.00
EBITDA € 1,420.60 € 1,791.00 £ 826.00 € 2,025.00 € 3,270.00 $ 5,131.00 EBIT € 1,042.90 € 157.00 £ 688.00 € 1,264.00 € 1,555.00 $ 4,116.00 Total Assets € 12,185.40 € 23,335.00 £ 4,828.00 € 15,376.00 € 32,462.00 $ 21,312.00 Total Debt € 4,431.60 € 13,128.00 £ 605.00 € 4,572.00 € 5,152.00 $ 9,519.00 Net Debt € 3,247.00 € 10,024.00 £ (45.00) € 3,724.00 € 4,053.00 $ 7,936.00 Book Capital € 4,035.10 € 273.00 £ 2,249.00 € 4,598.00 € 5,845.00 $ 7,358.00
Capital (Debt + noncurrent deferred taxes + equity) € 8,929.00 € 13,412.00 £ 3,030.00 € 9,452.00 € 11,343.00 $ 19,367.00 Capital Expenditures € 788.50 € 1,647.00 £ 536.00 € 1,073.00 € 2,545.00 $ 2,041.00
Equity € 4,035.10 € 273.00 £ 2,249.00 € 4,598.00 € 5,845.00 $ 7,358.00
Free Operating Cash Flow € 900.90 € 253.00 £ 73.00 € 117.00 € 848.00 $ 1,197.00 CREDIT METRICS (in million)
Table 3 – Operating Summary: Ryanair
Table 4 – Credit Metris: Peer Comparison (Ryanair, Air France, EasyJet, British Airways, Lufthansa, Southwest Airlines)
32
(as reported in 2015) Ryanair AirFrance EasyJet BritishAirways Lufthansa SouthwestAirlines Average
EBIT interest coverage (x) 14.06 0.42 76.44 8.60 4.37 34.02 24.77
EBITDA interest coverage (x) 19.15 4.80 91.78 13.78 9.19 42.40 32.39
Quick Ratio (x) 1.72 0.58 0.72 0.57 0.66 0.50 0.61 FFO to Debt (%) 0.39 0.14 1.40 0.78 0.70 0.60 0.72 FOCF to Debt (%) 0.20 0.02 0.12 0.03 0.16 0.13 0.09 Return on Capital (%) 0.12 0.01 0.23 0.13 0.14 0.21 0.14 Return on Assets (%) 0.07 0.01 0.11 0.16 0.05 0.10 0.09 Return on Equity (%) 0.21 0.58 0.24 0.55 0.29 0.30 0.39 Operating Margin (%) 0.18 0.01 0.15 0.11 0.05 0.21 0.10
Debt to Book Capital (%) 1.10 48.09 0.27 0.99 0.88 1.29 10.31
Debt to Capital (x) 0.50 0.98 0.20 0.48 0.45 0.49 0.52
Debt to EBITDA (x) 3.12 7.33 0.73 2.26 1.58 1.86 2.75
Debt to Equity (x) 1.10 48.09 0.27 0.99 0.88 1.29 10.31
EBITDA Margin (%) 0.25 0.07 0.18 0.18 0.10 0.26 0.16
FFO & Interest Expenses to Interest Expenses (x) 24.00 5.82 95.33 25.16 11.16 47.99 37.09 Discretinary Cash Flow to Debt (%) 0.09 0.02 (0.18) (0.03) 0.16 0.36 0.07 FFO cash interest coverage (x) 23.00 4.82 94.33 24.16 10.16 46.99 36.09 Capex to Depreciations Expenses (x) 2.09 1.01 3.88 1.41 1.48 2.01 1.96
Debt in Capital Structure (%) 0.52 0.98 0.21 0.50 0.47 0.56 0.54
Profit Margin (%) 0.15 0.01 0.12 0.22 0.05 0.11 0.10
KEY RATIOS
Ryanair Air France EasyJet British
Airways Lufthansa Southwest Airlines Total Assets € 12,185.40 € 23,335.00 £ 4,828.00 € 15,376.00 € 32,462.00 $ 21,312.00 Total Debt € 4,049.00 € 13,128.00 £ 605.00 € 4,572.00 € 5,152.00 $ 9,519.00 Working Capital € 2,396.00 € (4,454.00) £ (489.00) € (2,300.00) € (3,501.00) $ (3,382.00) Retained Earnings € 2,706.20 € (3,561.00) £ 1,720.00 € 0.00 € 1,612.00 $ 9,409.00 EBIT € 1,042.90 € 157.00 £ 688.00 € 1,264.00 € 1,555.00 $ 4,116.00 Market Capitalization € 17,909.00 € 1,556.00 £ 3,992.00 € 10,976.66 € 5,839.00 $ 30,681.00 Sales € 5,654.00 € 26,062.00 £ 4,686.00 € 11,333.00 € 32,056.00 $ 19,820.00
Metrics (in millions)
Coefficients Ryanair Air France EasyJet British
Airways Lufthansa Southwest Airlines X1 1.2 0.20 -0.19 -0.10 -0.15 -0.11 -0.16 X2 1.4 0.22 -0.15 0.36 0.00 0.05 0.44 X3 3.3 0.09 0.01 0.14 0.08 0.05 0.19 X4 0.6 4.42 0.12 6.60 2.40 1.13 3.22 X5 1.00 0.46 1.12 0.97 0.74 0.99 0.93 Z 3.95 0.77 5.78 2.27 1.77 3.93 Z-Score
Table 5 – Key Ratios: Peer Comparison (Ryanair, Air France, EasyJet, British Airways, Lufthansa, Southwest Airlines)
Table 6 – Z-Score - Metrics: Peer Comparison (Ryanair, Air France, EasyJet, British Airways, Lufthansa, Southwest Airlines)
Table 7 – Z-Score: Peer Comparison (Ryanair, Air France, EasyJet, British Airways, Lufthansa, Southwest Airlines)
33
Ryanair Air France EasyJet AirwaysBritish Lufthansa Southwest Airlines
naïve D = F € 4,049.00 € 13,128.00 £ 605.00 € 4,572.00 € 5,152.00 $ 9,519.00
E € 17,909.00 € 1,556.00 £ 3,992.00 € 10,976.66 € 5,839.00 $ 30,681.00
Expected Return rit-1 0.17% -0.03% 0.04% 0.11% 0.04% 0.03%
Standard Deviation σe 1.81% 2.09% 1.80% 1.88% 1.88% 1.71%
naïve σD 5.45% 5.52% 5.45% 5.47% 5.47% 5.43%
naïve σv 2.48% 5.16% 2.28% 2.94% 3.56% 2.59%
naïve DD € 68.13 € 2.14 £ 89.08 € 41.73 € 21.27 $ 55.64
π naïve 0.00% 1.62% 0.00% 0.00% 0.00% 0.00%
Metrics (in millions)
Table 8 – Naïve Alternative to Merton Model: Peer Comparison (Ryanair, Air France, EasyJet, British Airways, Lufthansa, Southwest Airlines)