Aerobiology of
Cupressaceae and
effect of O
3
and NO
2
pollutants on the
pollen
Célia Cristina Madeira Gomes
Dissertação de Mestrado apresentada à
Faculdade de Ciências da Universidade do Porto em
Biologia Funcional e Biotecnologia de Plantas
2018
A erob iology of C up ressa ce ae an d eff ec t of O 3 and NO 2 po llutants on t he po llen Célia Cr istin a M adeir a G o mes FCUP ANO 2.º CICLOCupressaceae and
effect of O
3
and
NO
2
pollutants on the
pollen
Célia Cristina Madeira Gomes
Biologia Funcional e Biotecnologia de Plantas
Departamento de Biologia 2018
Orientador
Professora Ilda Abreu, FCUP
Coorientador
O Presidente do Júri,
This dissertation allowed the publication of the following work with the name of Gomes, C.:
• Gomes, C., Ribeiro, H. & Abreu, I. Aerobiology of Cupressaceae in Porto city, Portugal. Aerobiologia (2018). https://doi.org/10.1007/s10453-018-9543-5.
And the following presentations:
• Gomes, C. et al. Aerobiology of Cupressaceae and effects of atmospheric pollutants (O3 and NO2) on its pollen – Encontro de Investigação Jovem da Universidade do Porto (IJUP). Porto, 2018 – Oral presentation.
• Gomes, C. et al. Aerobiology and effects of O3 and NO2 in Cupressaceae pollen - Jornadas do ICT. Porto, 2018 – Poster.
• Gomes, C. et al. Aerobiology of Cupressaceae and effect of O3 and NO2 pollutants on the pollen - 2º Encontro-Biologia Funcional e Biotecnologia de Plantas. Porto, 2018 – Oral presentation.
Acknowledgments
A realização deste trabalho de mestrado foi, para mim, um grande desafio, que me proporcionou, no meio de muitas emoções (alegrias, angústias, incertezas…) uma oportunidade única para crescer pessoal e profissionalmente.
Tudo isto, só foi possível com o apoio e dedicação de algumas pessoas, a quem deixo os meus sinceros agradecimentos.
Especialmente à minha orientadora, Professora Doutora Ilda Noronha, agradeço por me ter recebido no laboratório de Palinologia, por todo o apoio prestado durante o trabalho experimental necessário à concretização desta dissertação e por todo o conhecimento e sabedoria transmitidos ao longo do trabalho. Obrigada pela exigência, por acreditar nas minhas capacidades, por me incentivar a fazer mais e melhor e por todas as oportunidades que me deu ao longo deste ano, sendo exemplar na sua orientação.
Em segundo lugar agradeço à minha co-orientadora, Doutora Helena Ribeiro pelo apoio dado ao longo deste trabalho, por todos os conselhos e esclarecimentos prestados e por todo o conhecimento transmitido. Obrigada por me ajudar a discutir os resultados que obtive ao longo deste trabalho, mostrando-me novas perspetivas perante os mesmos.
Em terceiro lugar agradeço à Doutora Maria Fernandez González que, embora não tenha sido minha orientadora formal, me ajudou como se fosse sua aluna, esclarecendo-me dúvidas, transmitindo-esclarecendo-me conheciesclarecendo-mento e ajudando-esclarecendo-me também no trabalho prático, contribuindo, desse modo, para que fosse bem-sucedida.
Um grande obrigada às três, pelo entusiasmo e amor pela ciência que me transmitiram, por toda a paciência que comigo tiveram e por terem contribuído quer para o meu crescimento e desenvolvimento profissional, quer para o meu crescimento pessoal. Para mim serão sempre um exemplo a seguir.
Não posso também deixar de agradecer a toda a equipa do laboratório de Palinologia, com especial destaque à Joana Pereira, à Rita Lamas e à Catarina Pereira. A vocês meninas quero agradecer-vos pela amizade, pelo incentivo, pelos conselhos e por todos os momentos de alegria vividos no laboratório, que me ajudaram a não desanimar durante este período. Gosto muito de vocês.
Agradeço também ao Vítor Amorim pela boa vontade, pela colaboração prestada e por todo o tempo investido na correção do inglês do artigo científico que resultou deste trabalho.
Queria também agradecer aos meus colegas de mestrado, pela ajuda no manuseamento do autoclave em momentos específicos do meu trabalho.
Tenho também que agradecer a Coimbra que me deu amigos incríveis e que eu levarei comigo para a vida. Foram e são, sem dúvida, um porto de abrigo e um grande apoio, não só nos anos de licenciatura, como também nos de mestrado. A todos vós agradeço por estarem comigo mesmo estando longe de mim.
Um obrigada muito especial à minha madrinha e à minha afilhada de praxe, Patrícia Gil e Fabiana Ribeiro. Obrigada por me consolarem, por me ouvirem e por me darem força para continuar, nos momentos de maior desespero e desânimo, assim como pelo vosso apoio e amizade incondicionais. Adoro-vos.
Não posso deixar de agradecer ao meu namorado, companheiro e amigo João Oliveira, que desde o início foi um pilar na minha vida. Obrigada por acreditares em mim mesmo quando eu vacilei, por me ajudares a prosseguir, dando-me força para lutar até ao fim, por me ouvires sempre que precisei, por toda a ajuda que me deste até hoje e por me fazeres sorrir, mesmo nos momentos mais difíceis e aflitivos. Obrigada por estares sempre presente e por todo o amor e carinho que me deste ao longo de todos estes anos.
Por fim agradeço à minha família, que apesar de longe está sempre perto do meu coração. Sem os meus pais nada disto seria possível. A eles agradeço o apoio prestado desde os primeiros passos até agora. Obrigada por me terem deixado “voar” e, desse modo, terem dado o vosso contributo para alargar os meus horizontes. Um obrigada muito especial à minha irmã, Carla Gomes, companheira e amiga desde sempre. Obrigada por todos os momentos de alegria e brincadeira, assim como por todo o apoio e encorajamento. Obrigada por estarem à distância de um telefonema.
Resumo
As doenças respiratórias, nomeadamente as alergias relacionadas com o pólen, têm vindo a aumentar nos últimos anos em todo o mundo, principalmente em áreas urbanas, onde existe um maior número de pessoas afetadas. A poluição atmosférica pode ser responsável por este aumento, uma vez que pode interagir com os grãos de pólen induzindo alterações na sua alergenicidade e função. As alergias causadas pelo pólen de Cupressaceae têm sido subestimadas, visto que os seus sintomas, podem ser confundidos com sintomas de doenças respiratórias comuns no Inverno.
Os objetivos deste trabalho foram i) efetuar um estudo aerobiológico para quantificar o pólen de Cupressaceae presente na atmosfera da cidade do Porto e relacioná-lo com fatores meteorológicos; ii) avaliar os efeitos da poluição nas propriedades dos grãos de pólen.
A amostragem atmosférica foi efetuada de 2014 - 2017 utilizando um captador volumétrico tipo Hirst. O pólen de Cupressus lusitanica Mill. foi exposto a poluentes atmosféricos (O3 e NO2), utilizando uma câmara de fumigação, em concentração igual ao valor limite para a proteção da saúde humana de acordo com a Diretiva Europeia 2008/50/EC. As alterações na alergenicidade do pólen foram analisadas através de Western-blot, utilizando soros de pacientes alérgicos a pólen e o anticorpo Cup a 1, e de técnicas de ELISA, utilizando o anticorpo Cup a 1. Além disso, a fertilidade do pólen foi testada, através da análise da viabilidade e o stress dos grãos de pólen foi avaliado, através da análise da produção de ROS e da enzima superóxido dismutase (SOD) e da formação de depósitos de formazan pela NADPH oxidase.
Durante o período de estudo, 2015 registou a maior concentração anual de pólen de Cupressaceae na atmosfera, enquanto 2016 registou a menor. O período principal de polinização ocorreu durante o Inverno, sendo fevereiro o mês com a maior concentração atmosférica de grãos de pólen. O padrão de distribuição diurno de pólen apresenta um pico na concentração durante a manhã (9 h – 12 h), decrescendo abruptamente durante o início da tarde. A concentração de pólen presente na atmosfera apresentou correlações significativas com os fatores meteorológicos, principalmente com a temperatura.
Não foram observadas alterações no conteúdo total de proteína solúvel, nem no perfil de polipeptídeos dos extratos proteicos após exposição do pólen aos poluentes. Contudo, tanto o O3 como a mistura de O3 e NO2, provocaram um aumento da reatividade ao IgE dos soros de pacientes e um aumento do conteúdo de Cup a 1. A
exposição aos gases poluentes levou a uma diminuição da viabilidade do pólen, um maior número de grãos de pólen em stress e um aumento da produção de SOD.
Este estudo mostrou que o pólen de Cupressaceae está presente na atmosfera, durante os meses de Inverno, sendo uma importante causa de alergias. Também foi observado que os poluentes como o O3 e o NO2 podem induzir um aumento na alergenicidade do pólen. Assim, este trabalho poderá ser útil tanto para pacientes que sofrem de alergias como para médicos, permitindo a tomada de medidas preventivas, de modo a evitar exposição ao pólen, melhorando a sua qualidade de vida.
Palavras-chave: Cupressus lusitanica Mill.; Cup a 1; Alergénios; Alergias; Gases poluentes; Distribuição horária; Fatores Meteorológicos; Época principal de polinização.
Abstract
Respiratory diseases, namely pollen related allergies, have increased worldwide in the last years, especially in urbanized areas, where people are more affected. Air pollution may be responsible for this increase by interacting with pollen grains and inducing changes on them. Cupressaceae pollen allergies have been underestimated, since its symptoms may be mistaken with symptoms of a generic winter respiratory disease.
The aims of this project were i) to perform an aerobiological study in order to quantify the airborne Cupressaceae pollen in Porto’s atmosphere and relating it with meteorological parameters; ii) evaluate the air pollution effects on the pollen grains properties. In this study, the atmospheric sampling was performed from 2014 to 2017 using a Hirst volumetric trap. Cupressus lusitanica Mill. pollen was exposed to air pollutants (O3 and NO2) at a concentration equal to the limit value for human protection according to the European Directive 2008/50/EC. The effects in pollen allergenicity were analysed through Western blot, using sera of subjects sensitized to pollen allergens and Cup a 1 antibody, and through ELISA using also the Cup a 1 antibody. In addition, pollen fertility was assessed by analysing pollen viability, as well as pollen stress by evaluating ROS production, superoxide dismutase (SOD) production and the formation of formazan deposits by NADPH oxidase.
During the study period, 2015 registered the highest annual Cupressaceae pollen concentration in the atmosphere while 2016 recorded the lowest. Cupressaceae main pollen season occurred during the winter, being February the month with the highest concentration of airborne pollen grains. Diurnal distribution pattern of pollen presents a well-defined peak concentration in the morning hours (9 h – 12 h), decaying abruptly in the early afternoon. Airborne pollen concentration presented significant correlations with meteorological parameters, mainly with temperature.
Pollutants tested didn’t influenced total soluble protein content, neither polypeptide profile of the pollen extracts. However, both O3 and O3/NO2 mixture induced an increase on the IgE reactivity of the patient sera, as well as an increase of Cup a 1 content. Also, air pollutants exposure led to a decrease of pollen viability, to a higher number of pollen grains under stress and to the increase of SOD isoenzymes production.
This study showed that Cupressaceae pollen is present in the atmosphere during the winter, being an important cause of allergies. It was also demonstrated that air pollutants, such as O3 and NO2 can induce an increase of pollen allergenicity. Therefore, this work will be helpful especially for allergic patients and clinicians, allowing individuals to take
prophylactic measures, to avoid exposure to pollen grains. Thus, the patient’s life quality can be improved.
Key words: Cupressus lusitanica Mill.; Cup a 1; Allergens; Allergies; Pollutant gases;
Table of Contents
Resumo ...iv
Abstract ...vi
Table of Contents ... viii
Index - Figures ... x
Index – Tables ... xiii
Abbreviations, Acronyms, Symbols and Units ... xiv
1. Introduction ... 1
1.1. Motivation ... 1
1.2. Objective ... 2
1.3. Dissertation outline ... 2
2. State of the Art ... 4
2.1. Cupressaceae ... 4
2.2. Aerobiology ... 6
2.3. Pollen and Allergies... 7
2.4. Pollen and Pollutants ... 11
2.4.1. Ozone ... 11
2.4.2. Nitrogen dioxide ... 12
2.4.3. Interaction between pollen and air pollutants ... 13
2.4.4. Interaction between allergens and air pollutants ... 14
2.4.5. Oxidative stress ... 15
3. Materials and Methods ... 18
3.1. Aerobiology ... 18
3.1.1. Study area... 18
3.1.2. Airborne pollen sampling ... 18
3.1.3. Meteorological data ... 19
3.2. Pollen and Pollutants ... 20
3.2.1. Collection of Cupressus lusitanica Mill. pollen ... 20
3.2.2. In vitro pollen exposure to pollutants ... 20
3.2.3. Pollen allergenicity analysis ... 22
3.2.3.1. Protein extraction ... 22
3.2.3.2. SDS-PAGE and Western-blotting ... 22
3.2.4. Pollen fertility ... 23
3.2.5. Pollen stress ... 24
3.2.5.1. Hydrogen Peroxide ... 24
3.2.5.2. Superoxide anion ... 24
3.2.5.3. Superoxide Dismutase (SOD) ... 25
3.3. Statistical analyses ... 25
4. Results ... 26
4.1. Aerobiology ... 26
4.2. Pollen and Pollutants ... 29
4.2.1. Pollen Allergenicity Analyses ... 29
4.2.1.1. Protein Content ... 29
4.2.1.2. SDS-PAGE and Western-blotting ... 29
4.2.1.3. ELISA assay ... 31
4.2.2. Pollen fertility ... 32
4.2.3. Pollen stress ... 34
4.2.3.1. Hydrogen Peroxide ... 34
4.2.3.2. Superoxide anion ... 34
4.2.3.3. Superoxide dismutase (SOD) ... 35
5. Discussion ... 37
5.1. Aerobiology ... 37
5.2. Pollen and Pollutants ... 38
5.2.1. Protein content and protein profile ... 38
5.2.2. Immunoblotting and ELISA ... 39
5.2.3. Pollen fertility ... 42
5.2.4. Pollen stress ... 43
6. Conclusions ... 46
7. References ... 47
Index - Figures
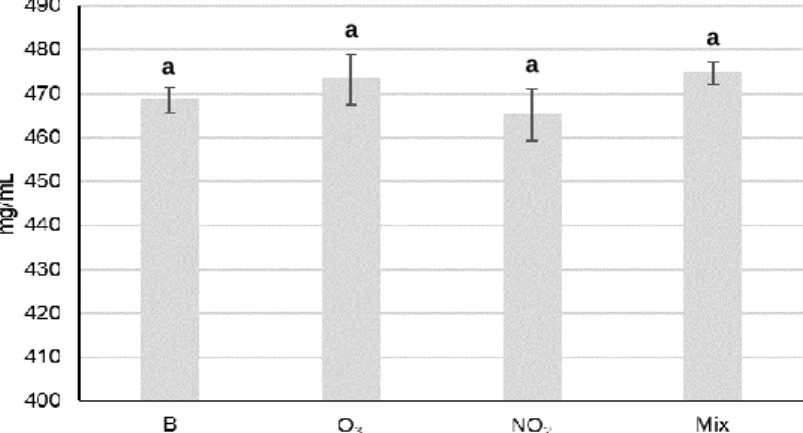
Fig. 1 – Cupressus lusitanica Mill. tree (A), male strobili (B) and female strobili (C). ... 4 Fig. 2 – Cupressus lusitanica Mill. pollen (A) and scheme of the pollen wall of Cupressaceae pollen (B). ... 5 Fig. 3 – Cypress pollen hydration. First, pollen increases its size due to the beginning of hydration (1). Subsequently, the exine splitts and intine swells (2), followed by the protoplast displacement (3). Finally, the last step of cypress hydration is the exine shedding (4). Adapted from Chichiriccò and Pacini (2008). ... 5 Fig. 4 – Illustrative scheme of the allergenic pathway after the contact between the allergen and mucosal surfaces, which shows the sensitization mechanism. Adapted from Valenta (2002). ... 8 Fig. 5 - Scheme of the airborne pollen sampling procedure. ... 19 Fig. 6 - Scheme of the environmental chamber used in this task (Sousa et al. 2012). . 20 Fig. 7 – Ozone (A) and NO2 (B) gas concentration values as function of time inside the chamber for a typical experiment of 6h. ... 20 Fig. 8 - Temperature and relative humidity values as function of time inside the chamber for a typical experiment of 6h. ... 21 Fig. 9 - Monthly average total pollen during the Cupressaceae main pollen season in the atmosphere of Porto from 2013 to 2017. ... 26 Fig. 10 - Annual Cupressaceae airborne pollen in the atmosphere of Porto from 2013 to 2017. ... 26 Fig. 11 - Average hourly distribution, expressed in percentage, of Cupressaceae pollen concentration in the atmosphere of Porto from 2013 to 2017. ... 28 Fig. 12 - Average pollen protein content of Cupressus lusitanica Mill. of the blank sample not exposed to the pollutant gases (B) and of samples exposed to O3, NO2 and O3/NO2 mixture (Mix) at concentrations equal to the 8-h limit value for human health protection
(EU Directive2008/50/EC). Different letters indicate statistically significant differences (p<0.05) given by the ANOVA test followed by the Tukey post hoc test. ... 29 Fig. 13 - SDS-PAGE of total soluble proteins of Cupressus lusitanica Mill. pollen extracts from non-exposed (B, blank sample) and exposed pollen samples to O3, NO2 and O3/NO2 mixture (Mix) at concentrations equal to the 8-h limit value for human health protection (EU Directive 2008/50/EC). Molecular weights of bands expressed in kilodalton (kDa). ... 30 Fig. 14 - Immunoblots and optic densities (O.D.) of IgE-reactive bands of Cupressus
lusitanica Mill. pollen extracts assayed with sera from sensitized individuals to pollen.
These 3 immunoblots were taken as representative of the overall immunoblots performed. Text above the lanes and in the legend represent pollutant gas tested at 8-h limit value concentration for human health protection (EU Directive 2008/50/EC): B: blank experiment with no gas; O3: Ozone; NO2: Nitrogen dioxide; Mix: O3/NO2 mixture. ... 30
Fig. 15 - Immunoblots and optic densities (O.D.) of reactive bands of Cupressus
lusitanica Mill. pollen protein extracts exposed to distinct gases and assayed with Cup a
1 antibody. Text above the lanes and in the legend represent pollutant gas tested at 8-h limit value concentration for 8-human 8-healt8-h protection (EU Directive 2008/50/EC): B: blank experiment with no gas; O3: Ozone; NO2: Nitrogen dioxide; Mix: O3/NO2 mixture. ... 31 Fig. 16 - Average Cup a 1 allergen content (μg/mL) of Cupressus lusitanica Mill. of the blank sample not exposed to the pollutant gases (B) and of samples exposed to O3, NO2 and O3/NO2 mixture (Mix) at concentrations equal to the 8-h limit value for human health protection (EU Directive 2008/50/EC). Different letters indicate statistically significant differences (p<0.05) given by the ANOVA test followed by the Tukey post hoc test. ... 32 Fig. 17 - Percentage of Cupressus lusitanica Mill. viable pollen grains of the blank sample not exposed to the pollutant gases (B) and of samples exposed to O3, NO2 and O3/NO2 mixture (Mix) at concentrations equal to the 8-h limit value for human health protection (EU Directive2008/50/EC). Different letters indicate statistically significant differences (p<0.05) given by the ANOVA test followed by the Tukey post hoc test. ... 32 Fig. 18 - Early phases of pollen tube development (A-G) in Cupressus lusitanica Mill. pollen. The scale bar in the images corresponds to 10 μm. ... 33
Fig. 19 - Average of Cupressus lusitanica Mill. pollen grains under stress of the blank sample not exposed to the pollutant gases (B) and of samples exposed to O3, NO2 and O3/NO2 mixture at concentrations equal to the 8-h limit value for human health protection (EU Directive2008/50/EC). Different letters indicate statistically significant differences (p<0.05) given by the ANOVA test followed by the Tukey post hoc test. ... 34 Fig. 20 - Formazan deposits in Cupressus lusitanica Mill. pollen grains of the blank sample not exposed to the pollutant gases (A) and of samples exposed to O3 (B), NO2 (C) and O3/NO2 mixture (D) at concentrations equal to the 8-h limit value for human health protection (EU Directive2008/50/EC). The purple formazan deposits are formed by the reduction of NBT by NADPH oxidase. In this assay it was used pollen from the different samples to study the production of formazan deposits in the presence of NBT and NADPH. The scale bar in the images represents 20 μm. ... 35 Fig. 21 - Percentage of Cupressus lusitanica Mill. pollen grains with formazan deposits of the blank sample, not exposed to the pollutant gases, and of samples exposed to O3, NO2 and O3/NO2 mixture at concentrations equal to the 8-h limit value for human health protection (EU Directive2008/50/EC). Different letters indicate statistically significant differences (p<0.05) given by the ANOVA test followed by the Tukey post hoc test. ... 35 Fig. 22 - Immunoblots and optic densities (O.D.) of SOD IgG-reactive bands of
Cupressus lusitanica Mill. pollen extracts exposed to O3, NO2, and O3/NO2 mixture.
Letters above the pictures of immunoblots represent the pollutant gas used: B – Blank sample (Control); O3 – Ozone; NO2 – Nitrogen dioxide; Mix – O3/NO2 mixture. ... 36
Index – Tables
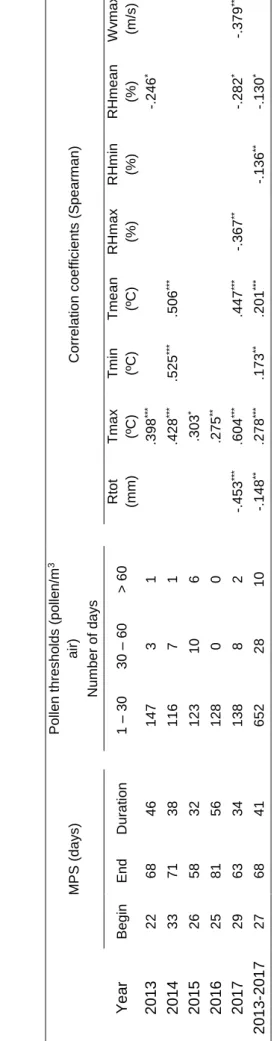
Table I - Cupressaceae allergens. ... 10 Table II - Average values of temperature, relative humidity and gas concentrations obtained inside the chamber for each assay. ... 21 Table III - Main pollen season dates (Julian days from the 1st of January), duration, and pollen thresholds of Cupressaceae and Spearman correlation coefficients between airborne pollen and meteorological parameters in the atmosphere of Porto from 2013 to 2017. ... 27
A
Abbreviations, Acronyms, Symbols and Units
4-HNE – 4-hydroxynonenal
a.m. – Ante Meridiem (Before noon) APCs – Antigen-presenting cells B – Blank sample
C. lusitanica – Cupressus lusitanica Mill.
Ca(NO3)2 – Calcium nitrate CH4 – Methane
CO – Carbon Monoxide Cu – Copper
Cu,Zn-SOD – Copper, Zinc superoxide dismutase
DCFH2-DA –
2',7'-dichlorodihydrofluorescein diacetate DNA – Deoxyribonucleic acid E – East
EDN – Equivalent Degrees of Nitration FDA – Fluorescein Diacetate
Fe – Iron Fig – Figure g – Gravitational force GRP – Gibberellin-regulated protein GSSG – Oxidized glutathione h – Hours H2O2 – Hydrogen peroxide H2SO4 – Sulfuric acid HBO3 – Boric acid IgE – Immunoglobulin E IgG – Immunoglobulin G
IUIS – International Union of Immunological Societies
LTP – Lipid Trasfer Protein kDa – Kilodaltons
KNO3 – Potassium nitrate
M – Molar m – Meter
m3 – Cubic metre mg – Milligram
mg/L – Milligram per litre mg/mL – Milligram per millilitre MgSO4 – Magnesium sulfate min – Minutes
Mix – Mixture of O3 and NO2 mL – Millilitre
mm – Millimetre mM – Millimolar
mm2 – Square millimetre Mn – Manganese
MPS – Main Pollen Season N2 – Atmospheric nitrogen N2O – Nitrous Oxide NaCl – Sodium chloride
NADPH – Nicotinamide adenine dinucleotide phosphate
NBT – Nitroblue tetrazolium nm – Nanometre
NO – Nitric Oxide -NO2 – Nitro group NO2 – Nitrogen Dioxide NOx – Nitrogen Oxides O2 – Oxygen
O2- – Superoxide anion
1O
2 – Singlet oxygen O3 – Ozone
O.D. – Optical Density
•OH – hydroxyl radicals
p.m. – Post Meridiem (After noon) PBS – Phosphate buffered saline PBS-BSA-T – Phosphate buffered saline with Bovine serum albumin and Tween 20
ppm – Parts per million RH – Relative humidity
RHmax – Maximum relative humidity RHmean – Mean relative humidity RHmin – Minimum relative humidity RNS – Reactive Nitrogen Species ROIs – Reactive oxygen intermediates ROS – Reactive Oxygen Species Rtot – Total precipitation
SDS – Sodium dodecyl sulphate
SDS-PAGE – sodium dodecyl sulphate– polyacrylamide gel electrophoresis SE – South east
sec – Seconds
SOD – Superoxide dismutase T – Temperature
TBS – Tris-buffered saline
TBS-T – Tris-buffered saline with Tween 20
Tmax – Maximum temperature Tmean – Mean temperature Tmin – Minimum temperature TSP – Total soluble protein W – Watt
w/v – Weight/Volume Percentage Concentration
Wvmax – Maximum wind speed Zn – Zinc
μg – Microgram
μg/mL – Microgram per millilitre μL – Microliter
1. Introduction
1.1.
Motivation
Pollen grains are primary biogenic aerosol produced by higher plants that are seasonally present, in high concentrations, in the atmosphere during the pollination season of plants. During this period, pollen can enter people’s airways and their allergens, present in both inner part and outer wall of the pollen, can trigger respiratory allergic reactions.
Pollen related allergenic disorders, such as respiratory allergies, asthma, allergic rhinitis, among others, represent a serious public health problem. Therefore, there are millions of people, worldwide, affected by this type of diseases, regardless of their age and economic status.
Pollen related allergenic disorders constitute a burden, especially in individual’s life quality, contributing to affected patient’s disability. They are also responsible for premature deaths and have negative economic effects on families, communities and societies in general. However, both allergic disorders and their risk factors don’t receive enough attention from government officials, the health-care community, the media and from patients and their families. Therefore, these diseases are diagnosed, under-recognized, insufficiently prevented and under-treated.
Several different lifestyle and environmental factors may induce symptoms or exacerbations of allergic diseases, contributing to their emergence. In several urbanized areas of the world, air pollution patterns are changing, having a significant effect on respiratory health of people in a dose dependent way. Both particulate and chemical air pollution may have a negative effect on allergic subject’s life by exacerbating allergic symptoms.
In recent years, research has been conducted about the crossed effects between non-biological pollutants and airborne pollen on allergy worsening in susceptible individuals, or on the development of symptoms in non-symptomatic ones. However, the causes of the epidemic increase in prevalence of pollen related allergic diseases are still marginally understood with many uncertainties, in spite of great research progress.
In Europe, grass pollen is the most important cause of pollinosis, while the most allergenic tree pollen is produced by Fagales (birch, alder, hazel, oak), olive, cypress or platanus. In fact, cypress pollen allergies have been underestimated, since its symptoms may be mistaken with symptoms of a generic winter respiratory disease, and therefore less investigation time has been devoted to this pollen type.
1.2.
Objective
To understand the complex interaction between air pollutants, pollen and human health more accurately, a holistic approach is necessary. Therefore, relating the airborne pollen dynamic, meteorological factors and how air pollution can affect pollen structure and biochemistry are of extreme importance towards the adoption of guidelines and actions to face the prevalence increase in respiratory allergies.
So, the aim of this dissertation was to study Cupressaceae pollen atmospheric load, its correlations with meteorological factors, and the assessment of the pollution influence on its pollen fertility and allergenicity properties.
In this perspective, the proposed investigation intends:
• To detect the presence and characterize the aerobiological pattern of Cupressaceae pollen in the atmosphere of Porto;
• To study the effects of the meteorological variables in pollen dispersion;
• To evaluate in vitro the effects of the atmospheric pollutants (O3 and NO2) in the allergenicity, fertility and stress of Cupressus lusitanica Mill. pollen using patient sera and the pollen major allergen Cup a 1.
This multidisciplinary approach will contribute to the improvement of Allergy Alert System combining airborne pollen levels and air quality and to future research perspectives relating the interaction of pollen, environmental pollution, and its effects on respiratory allergies.
1.3.
Dissertation outline
This dissertation is organized in six different sections presented below:
• Introduction: in this section we present the main problem studied, emphasizing the importance of pollen related allergic diseases. In addition, we present the main objectives of this dissertation, as well as its structure;
• State of the art: this section constitutes a bibliographic review of Cupressaceae pollen (it is described the reproductive structures, as well as pollen of Cupressaceae plants), Aerobiology (it is emphasized the importance of aerobiological studies and the main aerobiological studies performed in Portugal) and Allergies (here we present a brief review of allergens and we emphasize Cupressaceae pollen allergies as a problem of public health all over the world). A description of the mechanisms underlying the stimulation of allergic respiratory diseases is also presented as well as the major atmospheric pollutant gases having an effect in both pollen and allergens;
• Materials and Methods: This section shows the methodology used in this study. We first describe the characteristics of the study area, and then we explain how the aerobiological study was performed. We also present the meteorological data tested and statistical tests used in this study. Afterwards, we describe the sampling of C. lusitanica pollen grains as well as the pollen fumigation protocol. Subsequently we highlight the technics used in order to study the effects of pollutants on pollen allergenicity, fertility and stress;
• Results: Here we show the main results obtained with the aerobiological study, namely the interannual airborne pollen variations, the diurnal pollen concentration patterns and the correlation between airborne pollen and the meteorological factors. In addition, we present the results related with the effects of air pollution on pollen grains allergenicity, fertility and stress;
• Discussion: In this section, the obtained results in this dissertation are explained and compared with the results from other similar studies;
2. State of the Art
2.1. Cupressaceae
Cupressaceae plants are characterized for being shrubs or trees, widely distributed worldwide, comprising approximately 30 genera, with about 160 species (Little, 2006; Charpin et al., 2017). The trunks can be brunched, or erect, and different species may have different leaf disposal as well as different leaf shapes (Page, 1990). Also, there are species adapted to swamp environments and have a deciduous canopy, while other are characterised for being evergreen and tolerant to drought, making them well adapted to arid environments (Pittermann et al., 2012).
The reproductive structures of these gymnosperms are designated strobili or cones, typically unisexual (Vázquez-Lobo, 2009), usually present in the same plant and are produced in great number (Fig. 1). The female strobili are composed by several closely imbricate scales while the male strobili are catkin-like cones that when mature, the microsporangium extends beyond the scales and become exposed to the air, causing the dehydration of the outer wall cells, which leads to the rupture of the wall along the dehiscence line, promoting pollen release and dispersion (Jin et al., 2012).
Cupressaceae pollen is spherical or subspherical in shape and generally inaperturate, as shown in Fig. 2A, although some studies report that the pollen can also be monoporate with an opercule or have two pores (Caiola et al., 2000). When present, the pore participates in the hydration of the pollen and in the exine breakage (Duhoux, 1982; Bortenschlager, 1990).
Cupressaceae pollen wall is composed by a thin exine and a stratified thick intine (Fig. 2B). The exine is divided in ectexine, the outermost layer, and in endexine, inner layer. At the exine surface it can be observed star-shape orbicules loosely attached to it (Kurmann, 1994; Caiola et al., 2000). The intine is composed by three different layers, a thin polysaccharidic outer layer, a large middle layer, and a thick inner layer (Chichiriccò et al., 2009). Although the outer layer is compact and homogenous, it has a high plasticity allowing the pollen to triplicate its size during hydration. The middle intine is very thick and of polysaccharidic nature, being mucilaginous and viscous. The inner layer is constituted by callose and cellulose, being the first one concentrated mostly in the inner side of this layer. This is the persistent wall of the sporoderm and, during hydration, it becomes thickened protecting the protoplast against the harmomegathic changes that occur after exine shedding, since it replaces the mechanical functions of the exine (Fig. 3).
Fig. 2 – Cupressus lusitanica Mill. pollen (A) and scheme of the pollen wall of Cupressaceae pollen (B).
Fig. 3 – Cypress pollen hydration. First, pollen increases its size due to the beginning of hydration (1). Subsequently, the exine splitts and intine swells (2), followed by the protoplast displacement (3). Finally, the last step of cypress hydration is the exine shedding (4). Adapted from Chichiriccò and Pacini (2008).
2.2. Aerobiology
Aerobiological studies give important information to predict the length of seasonal exposure as well as the behaviour of pollen grains over the year (Martínez-Bracero et al., 2015), helping define the likelihood of human exposure to aeroallergens, sensitivity, and severity of allergic symptoms (Fuhrmann et al., 2016). In addition, they can be useful in climate change studies, allowing the monitoring and detection of changes in plant phenology, in determining the timing, intensity, and length of the main pollen season (MPS) as well as in the construction of pollen calendars. These model studies are important because they help patients and allergologists to prevent and properly treat allergies. Thus, this type of studies should be taken into consideration by the local government in the construction of a garden or a green space in a city, since it avoids the implementation of plants that are potentially allergenic, improving the citizens’ life.
The presence of pollen in the atmosphere is related to the flowering season of a given species and is highly influenced by meteorological conditions. The period in which pollen is present in the atmosphere is named as main pollen season, and its start and duration, as well as the number of pollen grains that may disperse in a specific region, are influenced by relative humidity, wind speed and direction, temperature, and rainfall duration (Gioulekas et al., 2004; Dahl et al., 2013; Hamda et al., 2017).
Several aerobiological studies have been performed in major Portuguese cities such as Braga, Porto, Coimbra, Lisbon, Évora and Guarda (Ribeiro et al., 2003; Ribeiro and Abreu, 2014; Lisboa et al., 2016; Camacho et al., 2017). The reported results showed temporal and quantitative prevalence differences in Cupressaceae airborne pollen concentrations. Despite that, Cupressaceae was one of the most representative pollen types in the atmosphere of these Portuguese cities, attesting the importance of monitoring its presence to improve the elaboration of pollen calendars and keeping them updated. This will enable the identification of Cupressaceae allergy symptoms in sensitized patients, facilitating proper treatment. In addition, these pollen calendars can also help patients avoid higher airborne pollen concentration periods, allowing them to take prophylactic measures (Šikoparija et al., 2018).
Ribeiro and Abreu (2014) performed the first long-term description of the allergenic airborne pollen present in the city of Porto and reported Cupressaceae pollen as the 5th most representative pollen type, pointing out to the importance of pollen allergy risk in this city. However, the widespread use of Cupressaceae plants as ornamental species in Porto has been increasing, in spite of a threefold increase in the percentage of cypress allergy around the Mediterranean area being reported (Charpin et al., 2017).
2.3. Pollen and Allergies
Pollen grains have specific allergens belonging to a limited number of protein or glycoprotein families that participate, for example, in the recognition, attachment, growth, and development of the pollen tube (Radauer et al., 2008; Sofiev et al., 2013). Pollen released into the atmosphere is crucial for the sexual reproduction, nonetheless the accidental uptake of pollen grains by the human respiratory system may interact with the human immune system and, consequently elicit an allergic response (Ritsick and Lambeth, 2005).
Pollen allergens can be found in both inner part of the pollen (intine and cytoplasm) and pollen outer wall (submicroscopical sites of the exine and orbicules) (Cresti and Linskens, 2000). Pollen allergens can be released directly in the human airways, but also during its airborne transport under specific atmospheric conditions (Sofiev et al., 2013). In the air, relative humidity highly influences this phenomenon (Behrendt et al., 1997). So, when pollen grains are in a moisty atmosphere, they may hydrate and subsequently burst, releasing its content including the allergens (Grote et al., 2001). Sometimes, pollen grains settle on different surfaces, germinate and the pollen tube can rupture releasing submicronic particles, including allergens, that are suspended in the aerosol (Schäppi et al., 1997).
During the last 3 decades, the incidence of pollen related allergies had a dramatic increase worldwide, with 10-30% of the population affected (D'Amato et al., 2010; Ring, 2012). Allergic diseases have a high socioeconomic burden that affect negatively the patient’s quality of life, social, physical, and psychological functioning, often implying the decrease of work productivity or even the absence from work or school. The monetary costs involved in preventing and treating allergies have substantial impact with the increase of physician office visits, laboratory tests, medication, immunotherapy, and treatment of co-morbidities (Pawankar et al., 2011).
According with the rules of the IUIS (International Union of Immunological Societies) by Allergen Nomenclature Subcommittee (King et al., 1995), the nomenclature of allergens is made using the taxonomic name of the species that constitutes the origin of the allergen. Thus, the designation of an allergen is composed by the three letters of the genus, followed by a space and then the first letter of the species also followed by another space. Finally, the designation is concluded with an arabic numeral that represents priority of discovery and description (King et al., 1995).
The human immune system is not capable of recognize the whole structure of a protein or glycoprotein, instead it recognizes smaller regions of these molecules,
designated epitopes, and the development of specificities to different allergens is inherent to each person. The human immune system is capable of recognize conformational epitopes and linear epitopes. The first ones are composed by the three-dimensional surface of a molecule, which is formed by discontinuous sequences of the primary protein structure, while the second ones are formed by sequences of the primary protein structure (Behrendt and Becker, 2001). When an allergen is presented to the antigen-presenting cells (APCs), B cells start to synthesize allergen-specific IgE. After secretion, IgE will bind to FcεRI, a high-affinity receptor for IgE, on the membranes of mast cells and basophils, thus becoming sensitized to allergens (Fig.4). This results in the production of mediators such as histamine and leukotrienes that induce inflammatory reactions and the immediate allergic response (Larché et al., 2006).
Inflammatory reactions result from the production of ROS by NADPH oxidase present in host inflammatory cells, such as macrophages and eosinophils, contributing to high levels of oxidative stress in asthma (Bowler and Crapo, 2002). NADPH oxidase, along with other oxidases, is an enzyme responsible for catalysing the reduction of an oxygen molecule to form the anion superoxide (O2-). (Babior et al., 2002; Glyan’ko and Ischenko,
2010). However, NADPH oxidases of the host cells are not the only ones that contribute to the increase of oxidative stress in human airways. Boldogh et al. (2005), proposed a 2-signal ROS-antigen model that explains how allergic inflammation is triggered. In this model pollen NADPH oxidases produce ROS in the human airway epithelium in an independent way from the adaptative immune response, constituting signal 1. Then, oxidized glutathione (GSSG) and 4-hydroxynonenal (4-HNE), which result from the increasing oxidative stress, contribute to the airway inflammation caused by pollen antigens, constituting the signal 2.
Cupressaceae pollen has been considered an important cause of respiratory allergic diseases for many years in different regions of the world, like in North America (Ramirez, 1984), Australia (Pham et al., 1994), Japan (Ishizaki et al., 1987), and in the
Fig. 4 – Illustrative scheme of the allergenic pathway after the contact between the allergen and mucosal surfaces, which shows the sensitization mechanism. Adapted from Valenta (2002).
Mediterranean area (Panzani et al., 1986; Subiza et al., 1995; Gioulekas et al., 2004), being the most common species, in this region, Cupressus sempervirens L., Cupressus
macrocarpa Hartw., Cupressus lusitanica Mill. and Hesperocyparis arizonica (Greene)
Bartel, previously designated Cupressus arizonica Greene (Charpin et al., 2005). Charpin and co-workers performed a survey, in 1993, to the general population of two cities of the south-east of France with distinct Cupressaceae pollen exposures. They verified that the sensitization to this pollen is four times higher in the population living with more pollen exposure than in the area with less pollen (Charpin et al., 1993). In Montpellier, a survey with patients referred to the Allergy Department of University Hospital of Montpellier reported that 17% of the patients sensitized to cypress pollen, were monosensitized to this pollen type (Caimmi et al., 2012). Scichilone et al. (2013) reported that in five years, cypress pollen sensitized patients in Palermo, Italy, almost doubled, increasing from 17% in 2005 to 29% in 2010. It was observed that the most common sensitization is to cypress pollen allergen Cup a 1 (Scala et al., 2010).
These surveys highlight the importance of Cupressaceae pollen as a relevant cause of allergic disease and show that cypress pollinosis is an increasing problem. However, this pollinosis is still an underestimated respiratory disease because not only there is an unawareness of the problem as also Cupressaceae species pollinate mostly in winter months and the symptoms often mimic those of generic winter respiratory disease (common cold, influenza syndrome, etc.), which may lead to wrong diagnosis (Mari et al., 1997; Ariano et al., 2002). Besides, the low sensitivity of the in vivo diagnostics available and the low potency of allergenic cypress extracts available may also contribute to the underestimation of this pollinosis (Mari et al., 1996).
The major allergens of Cupressaceae belongs to the pectate lyase family and were identified in several Cupressaceae species such as Hesperocyparis arizonica (Greene) Bartel (Cup a 1), Cupressus sempervirens L. (Cup s 1), Juniperus ashei Buch. (Jun a 1),
Cryptomeria japonica (L. f.) D. Don (Cry j 1) and Chamaecyparis obtusa Siebold et Zucc.
ex Endl. (Cha o 1) (Pablos et al., 2016; Charpin et al., 2017). These enzymes are also known as pectate transeliminases and catalyse the cleavage of a major component of the primary wall of several higher plant cells, the de-esterified pectin, being this activity dependent of the availability of Ca2+ (Marín‐Rodríguez et al., 2002). In pollen grains pectate lyase enzymes may enable pollen tube emergence and growth by loosening up the pollen cell wall (Marín‐Rodríguez et al., 2002). Besides, in Angiosperms, these enzymes may also contribute to the breakdown of the transmitting tissue cell wall extant in the style, in order to enable the penetration of the pollen tube (Marín‐Rodríguez et al., 2002). The pectate lyases are also found in other plant cells and it is though that they may participate in cell wall modifications during trans-differentiation of plant cells. It is
speculated that these enzymes allow the deposition of newly synthesized wall polymers for specialized functions, by removing and modifying the existing pectin matrix of the cell wall (Marín‐Rodríguez et al., 2002). Although Cup a 1 is the major allergen in Cupressaceae, there are other Cupressaceae allergens that cause allergic symptoms. Table I shows all Cupressaceae allergens discovered until now.
Table I - Cupressaceae allergens.
Allergen Characteristics
Cup a 1 40-45 kDa
Pectate lyase, that cleave galacturonic acid-containing polysaccharide chains (Charpin et al., 2017).
Cup a 2 43-60 kDa
Polygalacturonase, participate in fruit ripening, abscission, dehiscence, pollen maturation, and tissue expansion (Charpin et al., 2017). These enzymes catalyze the degradation of highly polymeric galacturonate, into individual galacturonic acid residues (Charpin et al., 2017).
Cup a 3 24-34 kDa
Thaumatin-like protein, belongs to the group 5 pathogenesis related proteins (PR-5), possess anti-fungal activity (Charpin et al., 2017).
Cup a 4 17-29 kDa
Polcalcin, a Calcium-Binding Protein, it is expressed in mature pollen grains (Hauser et al., 2010). It has been proposed that, due to their ability to bind calcium, polcalcins participate in the control of intracellular calcium levels during pollen germination (Hauser et al., 2010).
Cup a BP14 14 kDa
BP14 protein shares amino acid sequence homology with gibberellin-regulated protein (GRP), which belong to the Snakin/GRP family of proteins, a group of proteins widely distributed among plant species (Charpin et al., 2017);
They are involved in pollen maturation, plant responses to biotic or abiotic stress, participation in hormone crosstalk, and redox homeostasis (Charpin et al., 2017).
Cup s 8 14 kDa
Profilin, participate in processes related to cell motility via regulation of microfilament polymerization upon binding to actin, they play an important role in cytoplasmatic streaming, cell elongation, cytokinesis as well as growth of root hairs and pollen tubes as well as other cellular processes such as signalling pathways, as well as membrane trafficking and organization (Hauser et al., 2010).
Profilins constitute a family of proteins extant in all eukaryotic organisms (Hauser et al., 2010);
Due to the high similarity between the allergens of different Cupressaceae species that belong to the same molecular family, a high cross-reactivity between allergens of different species within the Cupressaceae family occurs (Pham et al., 1994; Barletta et al., 1996; Schwietz et al., 2000; Pichler et al., 2015). However, there are studies that report cross-reactivity between Cupressaceae and other unrelated species, such as
Parietaria judaica L., Lolium perenne L., Olea europea L. (Tinghino et al., 1998).
2.4. Pollen and Pollutants
In the last century, due to economic and industrial growth, emissions of air pollutants have increased, which makes air quality an important environmental problem throughout the world (D'Amato et al., 2010). In urban areas, ozone (O3), nitrogen dioxide (NO2) and particulate matter are the most abundant compounds of air pollution (D’Amato et al., 2013).
Changes in climate also represent a significant threat to human respiratory health, since not only it exacerbates respiratory diseases but also it increases the exposure of subjects to risk factors for respiratory diseases, such as air pollution (D’Amato et al., 2013).
2.4.1. Ozone
In stratosphere, ozone (O3) absorbs certain ultraviolet light wavelengths, playing an important role as an ecological framework for life on Earth because a decrease in O3 levels in the stratosphere leads to an increase of ultraviolet transmission to the Earth’s surface, which may be harmful for living organisms (Solomon, 1999). Besides, the O3 transport from the stratosphere to the troposphere controls the chemical composition of this atmosphere layer (Logan, 1985).
O3 is also formed and destroyed by chemical reactions in the lower atmosphere. In this atmospheric layer, the formation of O3 occurs because solar radiation with wavelengths between 300 and 400 nm, can reach the earth’s surface, inducing the dissociation of NO2 into NO. Then, O3 is formed through the combination of O2 and O (Crutzen, 2012). This gas is also produced during the oxidation of hydrocarbons, carbon monoxide (CO) and methane (CH4) when nitrogen oxides (NOx) are available, and it is destroyed by reactions with free radicals (OHx).
Nowadays, O3 concentration in the troposphere has increased probably due to anthropogenic activities that increase fossil fuel combustion which, consequently, leads
to an increase of the availability of O3 precursors, such as NOx and CO (Logan, 1985; Hough and Derwent, 1990). Thus, this water-insoluble gas may contribute up to 90% of the total oxidant levels in cities, becoming the main component of photochemical urban oxidants (D'Amato, 2002).
O3 has several harmful effects for human health. This gas can affect both the upper and lower respiratory airways and an increase of ambient ozone levels leads to impairment of pulmonary function of both non-asthmatics and asthmatics and to an increase of hospital admissions (D'Amato, 2002). Ozone exposure may lead to an enhancement of the risk of sensitization to airborne allergens in predisposed subjects (D'Amato, 2002). It can also increase the airway responsiveness of sensitized individuals since it can lower the threshold concentration of allergen able to induce clinical symptoms (D'Amato, 2002). Ozone also favours the migration of several inflammatory mediators, inducing inflammatory effects in upper and lower airways (D'Amato et al., 2001). The 8-h average threshold value for the protection of human health is 0.061 ppm, not to be exceeded more than 25 days per calendar year (European Union Directive 2008/50/EC).
2.4.2. Nitrogen dioxide
Nitrogen dioxide (NO2) is a precursor of photochemical smog, usually found in the atmosphere of urbanized and industrialized regions (D’Amato et al., 2013). The main sources of nitrogen oxides (NOx) in the atmosphere are vehicle exhausts and power plants combustion, although NOx can be formed through other processes. The natural decomposition of organic material may also be a source of NOx to the atmosphere, such as ammonia (Anderson, 1983).
Nitric oxide (NO) is formed due to the association of both atmospheric nitrogen (N2) and oxygen (O2), stimulated by the heat produced during the combustion of fuel. Afterwards, a spontaneous reaction occurs between NO and O2 originating two molecules of NO2. Then NO2 reacts with other species present in the atmosphere, which leads to the formation of nitrites and nitrates (Anderson, 1983; Omasa K., 2002). There is several NOx that can be found in the atmosphere such as nitrous oxide (N2O), NO, NO2, among others, however the most deleterious air pollutants are NO2 and NO (Omasa K., 2002).
NO2, as well as O3, is an oxidant pollutant and, although less reactive, the exposure to this pollutant has a significant impact on human health, being related with increased emergency room visits, medication use among children with asthma, wheezing,
shortness of breath, and cough (D’Amato et al., 2013). In addition, the exposure to this pollutant may lead to the increase of oxidative and nitrosative stress, which consequently may lead to the impairment of respiratory responses against infection. This will cause lung injury and asthma exacerbation, which means that probably air pollutants constitute a risk factor for asthma (Gauderman et al., 2005). The threshold value for the protection of human health is 0.1 ppm, not to be exceeded more than 18 times in any calendar year (European Union Directive 2008/50/EC).
2.4.3. Interaction between pollen and air pollutants
Air pollutants can interact with pollen grains not only during their development but also during their transport.
Exposure to pollutants may induce some alterations in plants phenology related with reproductive process, such as the alteration of the flowering time or number of flowers produced, changes in the yield and development of seeds and fruits, as well as seed germination and seedling vigour (Black et al., 2000). Pollutants may induce abnormalities in the anther structure, such as precocious growth and degeneration of the tapetum. Besides, air pollutants may also induce abnormalities in tetrads and microspores, as well as induce the release of cytoplasmic content (Rezanejad, 2007). Under polluted environments pollen grains may present irregularities, shrinkage which leads to a decrease in pollen size. The exine may also be thinner or even broken, and an accumulation of airborne particulate material can occur. Some pollen grains may also present shrunken and closed apertures due to the influence of pollutants. (Rezanejad et al., 2003; Rezanejad, 2007).
In addition, pollutants are also capable of inducing changes in the permeability and fluidity of the plasma membrane, as well as impairing ion transporters present in this cellular structure (Omasa K., 2002).
Air pollution may be capable of induce some changes in pollen metabolism, such as stimulate the synthesis of several aminoacids (serine, alanine, glycine and threonine) or the inhibition of their utilization (Mumford et al., 1972).
The inhibition of tricarboxylic acid cycle is another metabolic modification that may be caused by air pollution. This inhibition would lead to an increase of pyruvate and phosphoglycerate which can be converted into the aminoacids referred above, through transamination (Mumford et al., 1972).
Another metabolic change that may occur, due to the influence of air pollutants, is the increase of the biosynthesis of flavonoids, to protect the pollen grains against the
deleterious effects that air pollutants might cause (Rezanejad, 2009). Flavonoids are ubiquitous plant secondary metabolites that have a huge array of biological functions, including the protection against stress (Winkel-Shirley, 2002).
The deleterious effects of pollutants may negatively affect not only pollen viability but also pollen germination as well as pollen tube growth. This means that, upon exposure to pollutants, pollen fertility may be compromised, even when pollen is exposed to concentrations of gases below the safety limit for human health protection (Black et al., 2000; Gottardini et al., 2004; Cuinica et al., 2013).
In addition to all the harmful effects already referred above, it is important to note that the great oxidative potential of the pollutants may also impair pollen tube development through oxidation of biomolecules, such as proteins, lipids and nucleic acids (Chichiriccò and Picozzi, 2007).
Cell respiration is a crucial factor for the occurrence of pollen germination, however some pollutants may impair cellular respiration, since some of them present affinity to some components of the mitochondrial respiratory chain. NO induces a fast, selective and potent reversible inhibition of the cytochrome oxidase, while reactive nitrogen species (RNS) induce an irreversible inhibition of other mitochondrial components. Peroxynitrite is a strong oxidant derived from the exposure to pollutants, capable of inhibit complex I, complex II, cytochrome oxidase (complex IV), and the ATP synthase, all constituents of the mitochondrial respiratory chain, impairing cell respiration (Brown and Borutaite, 2004). Although these effects of pollutants in the cell respiration are well known in animal cells, they might occur in plant cells as well (Chichiriccò and Picozzi, 2007).
2.4.4. Interaction between allergens and air pollutants
Pollutant gases can also influence the allergenicity of pollen grains, leading to the increase or decrease of the sensitization in patients with respiratory allergies (Cuinica et al., 2015; Sénéchal et al., 2015). This occur because the same pollutant may interact with allergens on different ways, depending on the specific pollen allergen (Ribeiro et al., 2017).
IgE reactivity towards to allergens, or even to short peptides, may be influenced by translational modifications. Petersen et al. (1998) showed that single post-translational modifications such as hydroxylated proline residues as well as a glycosylation site with a glycan associated, in the N-terminus of Phl p 1, increase its allergenicity. van Ree et al. (1995) showed also that, in the case of Lol p 11, the
disulphide bridges are essential to the recognition of this allergen by IgE of patients sensitized to grass pollen. Besides, Bernard et al. (2000) showed that phosphorylation of allergens influences their allergenicity, since the dephosphorylated protein presented less IgE recognition compared with the native protein.
Sometimes, pollen grains exposure to air pollutants may induce some post-translational modifications that do not exist in the native allergen, such as nitration, or even induce other types of alterations, since the exposure to pollutants may cause acidification of the allergens (Franze et al., 2005; Rogerieux et al., 2007). Nitration occurs in the presence of nitrating species and consists in the addition of a nitro group (-NO2) through a covalent bond to a carbon present in the chemical structure of tyrosine or tryptophan residues (Ischiropoulos, 2003; Suzuki et al., 2004). This post-translational modification may increase the allergenicity of allergens, probably because nitration is capable of generate new epitopes (Gruijthuijsen et al., 2006). In addition, S-nitrosylation is other post-translational modification that may be induced to allergens and other proteins due to exposure to pollutants, specially under both low and elevated NO2 concentrations (Zhao et al., 2016). S-nitrosylation consists in the reversible covalent addition of a NO moiety to a thiol group incorporated in a cysteine residue and it may influence the allergenicity of pollen grains, similarly to nitration (Anand and Stamler, 2012; Zhao et al., 2016).
2.4.5. Oxidative stress
ROS are potential oxidant molecules produced in different cellular compartments, as a by-product of several metabolic pathways, having an important role in signalling pathways and in regulating gene expression (Pitzschke et al., 2006; Hayyan et al., 2016). Under physiological steady-state conditions, there is a balance between the production and the scavenging of ROS, to maintain a determined level of oxidative molecules, avoiding injuries to cells (Alscher et al., 2002). Nonetheless, this balance may be compromised upon adverse environmental conditions, such as air pollution, which may lead to an increase of ROS production, which results in the fast increase of ROS concentration, being designated as “oxidative burst” (Alscher et al., 2002; Apel and Hirt, 2004). Thus, due to the increase of ROS, such as superoxide (O2-), hydrogen peroxide (H2O2), hydroxyl radicals (•OH), singlet oxygen (1O2), etc, plasma membrane may be injured, since ROS participate in lipid peroxidation. Also, ROS induced by air pollutants may be able to induce DNA cleavage or even changes in transcription, probably
favouring the expression of genes related with plant defence (Koch et al., 1998; Omasa K., 2002; Apel and Hirt, 2004).
Mitochondrial electron transport system is one of the main potential sources of ROS in plant cells, since the reduction of O2 to O2- occurs in the flavoprotein region of NADH
dehydrogenase that constitutes the respiratory chain (Bhattacharjee 2005). Nevertheless, there are other important sources of ROS in plant cells, such as several oxidases and peroxidases that produce ROS as a response to adverse environmental conditions. Plasma membrane NADPH oxidases have been the subject of several different studies and it is thought that they play a key role in ROS signalling (Mittler et al., 2004). Also, several studies have shown that this enzyme can participate in different stress responses, since its activity is enhanced after exposure to different stress sources, being sensitive to both abiotic and biotic stressors (Glyan’ko and Ischenko, 2010).
To protect themselves from the deleterious effects of high levels of ROS, cells developed antioxidant mechanisms in order to scavenge ROS, which contributes to its decrease. Antioxidants are divided into two different categories: the non-enzymatic antioxidants and the enzymatic antioxidants. The first category includes glutathione and ascorbate, the major cellular redox buffers, as well as alkaloids, carotenoids, tocopherol and flavonoids, while the second category includes several different enzymes, such as catalase, superoxide dismutase, glutathione peroxidase and ascorbate peroxidase (Apel and Hirt, 2004).
Superoxide dismutases (SOD) are metalloenzymes that convert O2- to hydrogen peroxide (H2O2) and oxygen (O2), constituting the first defence line against ROS (Bowler et al., 1994; Alscher et al., 2002). Thus, it is possible that air pollution may increase SOD isoenzymes activity, aiming the scavenging of ROS and the avoidance of injuries in cells (Kangasjärvi et al., 1994). There are three types of SOD, distinguished by their metal cofactor. Therefore, there is the iron SOD (Fe-SOD), the manganese SOD (Mn-SOD) and the copper/zinc SOD (Cu,Zn-SOD). Both Fe-SOD and Mn-SOD are phylogenetically more ancient than Cu,Zn-SOD (Bowler et al., 1994). This is supported by their structure and presence on different organisms. Fe-SOD and Mn-SOD have a similar structure, existing in all prokaryotic organisms studied so far, while Cu,Zn-SOD is structurally unrelated and, contrarily to the other two SODs, it is generally absent in these organisms, with few exceptions (Bowler et al., 1994). A similar distribution of the different SOD forms occurs in protozoa and some eukaryotic algae. In contrast, both Cu,Zn-SOD, and Mn-SOD can be found in all higher eukaryotic organisms (Bowler et al., 1994). These evidences indicate that both Mn-SOD and Fe-SOD probably evolved before the divergence between prokaryotic and eukaryotic organisms, while Cu,Zn-SOD evolved independently near the beginning of the eukaryotic lineage (Bowler et al., 1994).
In plants, the different types of SOD seem to be encoded in the nucleus and then they are transported to different subcellular locations. Generally, plants have a mitochondrial matrix Mn-SOD, a cytosolic Cu/ZnSOD and the chloroplast stroma both Fe-SOD and Cu,Zn-SOD can be present (Bowler et al., 1994). Nonetheless, the relative abundance of each enzyme, as well as the number of isoenzymes vary greatly from plant to plant (Bowler et al., 1994).
3. Materials and Methods
3.1.
Aerobiology
3.1.1.
Study area
This aerobiological study was performed in the city of Porto, located in the Northwest of Portugal. Both Douro River and the Atlantic Ocean limit the city of Porto, the first at south and the second at west. During the study period, the average maximum temperature ranged between 11.5 ºC and 21.0 ºC and the average minimum temperature from 3.3 ºC to 13.3 ºC. Also, in this period the relative humidity varied from 47.1% to 96.5% and the annual total precipitation oscillated between 144 and 704 mm. In addition, during the winter, the winds are mostly from East (E) and Southeast (SE).
The landscape around the airborne sampler is characterized by the presence of small gardens throughout the Faculty of Sciences of the University of Porto campus, the Botanical Garden, as well as avenue and street walks, which are ornamented with different trees. Around the sampling area, the most common Cupressaceae species found are Chamaecyparis lawsoniana (A. Murray) Parl., Chamaecyparis obtusa Siebold et Zucc. ex Endl., Cupressus sempervirens L., Juniperus oxycedrus L. and Thuja plicata "Zebrina" Donn ex D. Don. The sampling area is highly urbanized, and next to a highway that is one of the main entrances to the city.
3.1.2.
Airborne pollen sampling
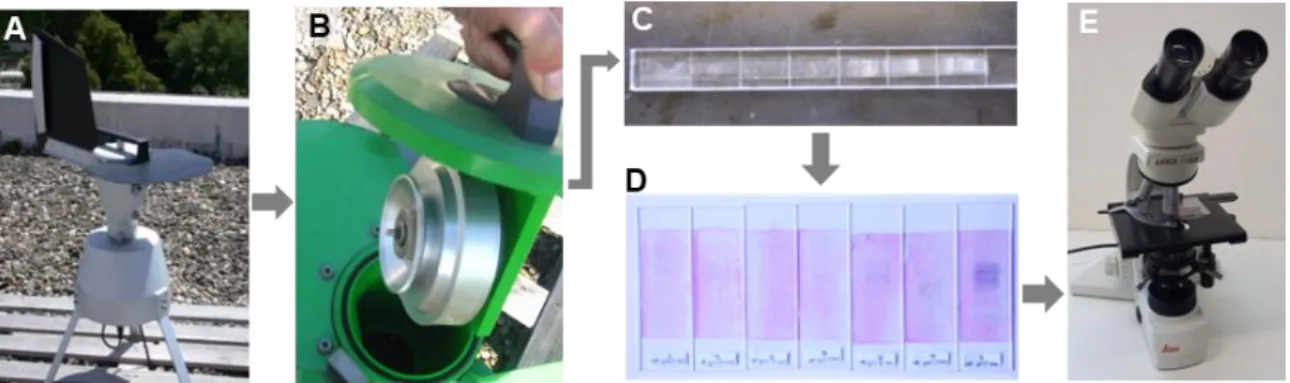
Airborne pollen was continuously sampled from November 2012 to November 2017, using a 7-day Hirst-type volumetric spore trap (model Lanzoni VPPS-2000, Italy). This trap is placed on the roof of the Faculty of Sciences of the University of Porto, approximately 18 m above ground level, and samples ten litres of air per minute, simulating human breathing. The air impacts onto a Melinex tape coated with silicone oil that is placed over a drum, which rotates once every 7 days. Every week the drum is replaced, and the tape is cut into seven daily segments and mounted on glass slides with fuchsine-stained glycerol jelly. Fig. 5 represents the sampling procedure of this type of aerobiological studies.
The daily and hourly number of Cupressaceae pollen grains per cubic meter of air were determined with an optical microscope (DMLB, Leica) at a magnification of x400 along four full lengthwise traverses that are divided into 24 latitudinal sections of 2-mm intervals (each representing 1 hour).
The Cupressaceae main pollen season (MPS) was defined using a pollen emission model, which fits a non-linear logistic regression model to the accumulated sum of daily airborne pollen concentration sampled along a year. A one-sided t-test was used at the 5% level to delimit the MPS beginning and ending dates, corresponding to the days where the difference between the pollen emission model and its superior and inferior asymptotes were significant (Ribeiro et al., 2007).
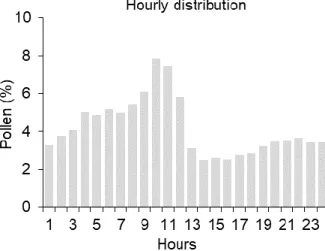
To determine the Cupressaceae diurnal airborne pollen concentration, the method described by Galán et al. (1991) was applied. The hourly values of atmospheric pollen concentration recorded in the days with an atmospheric pollen concentration superior to the average of the MPS concentration and without the occurrence of precipitation were used. The diurnal variations were expressed in percentage.
Finally, the Cupressaceae daily pollen concentrations were classified into three different threshold classes according to the Portuguese Aerobiology Network (http://www.rpaerobiologia.com) that are indicative of the allergenic potential present in the atmosphere: low (1–30 pollen/m3); moderate (30–60 pollen/m3); high (>60 pollen/m3).
3.1.3.
Meteorological data
The meteorological data were obtained from a weather station located at the Faculty of Sciences in Porto and managed by the Palynological laboratory. Maximum, minimum, and mean temperature as well as relative humidity, precipitation, and wind speed were the parameters tested in this study.
3.2.
Pollen and Pollutants
3.2.1.
Collection of Cupressus lusitanica Mill. pollen
During the Cupressus lusitanica Mill. flowering season, dehiscent strobili were randomly collected from all parts of the plants in the garden of Faculty of Sciences of University of Porto. After separation of extraneous materials, the strobili were dried at 24º C, gently crushed and the pollen thus released was passed through different grades of sieves to obtain pure pollen and stored at -20º C.
3.2.2.
In vitro pollen exposure to pollutants
The pollen samples were exposed to ozone (O3), nitrogen dioxide (NO2) and to both gases at the same time (O3/NO2 mixture), during 6h in an environmental chamber (Fig. 6).
The chamber is equipped with quantitative sensors for pollutant levels, temperature, and relative humidity, to control the atmosphere chemistry, a Solar Simulator to simulate the daylight and fans to homogenize the air, as described by Sousa et al. (2012).
Fig. 6 - Scheme of the environmental chamber used in this task (Sousa et al. 2012).
A
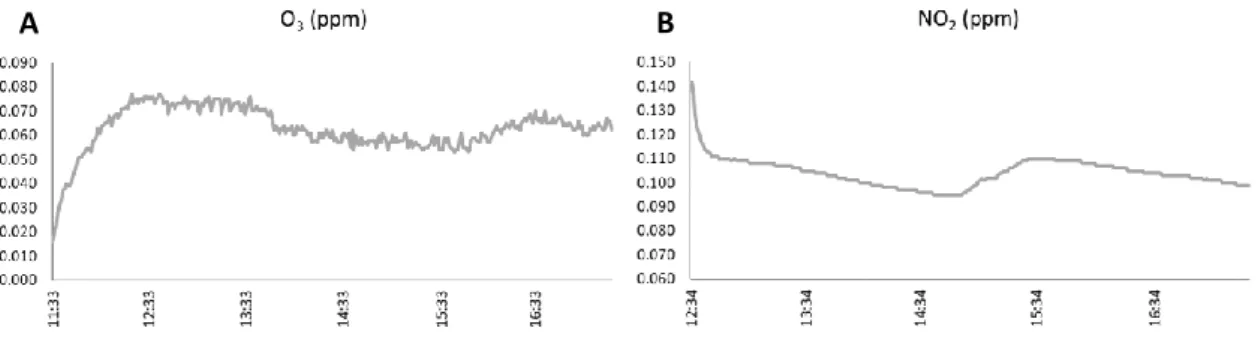
Fig. 7 – Ozone (A) and NO2 (B) gas concentration values as function of time inside the chamber for a typical experiment
of 6h.
Individual pollen samples (150 mg) were put into Falcon tubes (50 mL) with both edges open but coated by a mesh with a pore opening size of 23 µm, which allows to pass air. Afterwards, the tubes were positioned under the Solar Simulator and over a fan that enables pollen dispersion inside, allowing a homogeneous contact between the pollen grains and the gas, which mimics what occurs with airborne pollen. An ozone generator was used to produce O3 while the NO2 was obtained through the chemical reaction between concentrated nitric acid and solid copper. A control blank pollen sample, not exposed to the gasses but subjected to the same procedure, was also used. Fig. 7 shows gas concentrations obtained inside the environmental chamber over the time of exposure, showing the typical behaviour of each gas (Fig. 7A and Fig. 7B) in any experiment and an example of the oscillations of relative humidity and temperature during the assay (Fig. 8).
Table II shows the average values obtained of gas concentration, relative humidity and temperature.
Table II - Average values of temperature, relative humidity and gas concentrations obtained inside the chamber for each assay. Temperature (ºC) Relative Humidity (%) O3 (ppm) NO2 (ppm) Blank sample 22.27 46.64 - - O3 24.00 50.37 0.06 - NO2 23.74 48.90 - 0.10 Mix 25.02 53.09 0.05 0.10