Learning Scorecard Dashboards: visualizing student
learning experience
Elsa Cardoso1, Tiago Pedroso2, Francisco Rações3, Artur Baptista4, José Barateiro5
1ISCTE - Instituto Universitário de Lisboa and INESC-ID, Av. Forças Armadas, Lisbon, Portugal,
2ISCTE - Instituto to Universitário de Lisboa, Av. Forças Armadas, Lisbon, Portugal,
3ISCTE - Instituto to Universitário de Lisboa, Av. Forças Armadas, Lisbon, Portugal,
4ISCTE - Instituto to Universitário de Lisboa, Av. Forças Armadas, Lisbon, Portugal,
5LNEC and INESC-ID, Av. Brasil, Lisbon, Portugal, [email protected]
Keywords
Learning analytics, learning dashboards, gamification, information visualization
1. Summary
This paper presents the design of dashboards for the Learning Scorecard, a platform designed for improving the student experience in a Higher Education course using gamification and Business Intelligence (BI) techniques. LS is a Learning Analytics application, that has been used in Data Warehouse and BI courses in a University setting since 2016. The LS platform has two independent views: student view and faculty (or course coordinator) view. In the LS faculty view, dashboards were designed according to the best practices of information visualization for decision support, whereas in the student view the visualization of the learning experience is immersed in gamification elements. This paper focuses only on student dashboards, which are driven by engagement and motivation of students to improve their collaboration and learning experience. A central design decision for the LS implementation, was the recognition that the way students want to track their progress and their learning experience in a course is fundamentally different that the way teachers need to monitor student progress. The presented learning dashboards use gamification mechanisms to enable the visualization of self-assessment results giving a clear indication of the learning progress of students in a course.
2. Visualizing student learning using dashboards
Learning Analytics (LA) is a recent research field, in which Business Intelligence (BI) and Analytics techniques are applied to learners and their contexts, with the purpose of acquiring a greater insight about the entire learning process. The Society for Learning Analytics Research (SOLAR) defines LA as “the measurement, collection, analysis and reporting of data about learners and their contexts, for purposes of understanding and optimizing learning and the environments in which it occurs” (SOLAR, 2011). Information visualization is an important technique explored by several LA applications (Freitas et al. 2017, Verbert et al. 2013, 2014). Visualizations enabling the tracking of student learning activities are often called learning dashboards or student dashboards. These visualizations have the potential to improve student performance by providing a direct feedback. Providing students with an analytical environment with right-time data about their performance, as well as benchmarking capabilities regarding their peers, has demonstrated to increase student engagement (Verbert et al. 2014, Barata et al. 2013). Therefore, well-designed dashboards can be a powerful tool to improve self-assessment of students, and consequently increase their motivation and engagement to attain course’s goals and achieve better final grades.
The main challenge of dashboard design in this context is the identification of meaningful and unambiguous learning indicators to monitor student performance. Typically, in Higher Education Institutions student data, reporting on the learning progress at course level, are scattered across
different information systems (e.g., academic systems, e-learning management systems, institutional research and quality systems, etc.). On top of this, some important learning indicators are often not being collected by these institutional-wide information systems, which tend to focus on past performance (e.g., statistics after course completion) rather than present or ongoing student performance.
This paper focuses on the design of dashboards for the Learning Scorecard platform to enable the visualization of self-assessment results giving a clear indication of the learning progress of students in a course. The Learning Scorecard (LS) is a tool designed to monitor and manage the learning experience of students in a course (Cardoso et al. 2017, 2016).
3. Learning Scorecard Dashboards
The LS platform is a research project developed at the ISCTE – Instituto Universitário de Lisboa, a public University in Portugal, and is currently being used for the fourth consecutive semester, since September 2016, in Business Intelligence and Data Warehouse courses. In the winter semester of 2017-2018, the LS is being used by 112 students enrolled in the BI course from four different programs (master in computer science engineering, two undergraduate programs in informatics and management, and a postgraduate program in information visualization).
The LS platform has two independent views: student view and faculty (or course coordinator) view. The student view uses several gamification mechanisms to engage students with the course’s activities, including quests, leaderboards, badges, trophies, and avatars. In this paper, for the practical demonstration of LS visualizations we will use the final status of the platform at the end of the spring semester course, which ended in January 31, 2018.
The student view dashboards were designed according to gamification practices (Freitas et al. 2017) instead of more traditional Business Intelligence and decision-making principles. The student view and their learning dashboards were also inspired by sports and healthcare mobile applications, in which users want to track their progress and socialize with other users. This was a central design decision, recognizing that the way students want to track their progress and their learning experience in a course is fundamentally different that the way teachers need to monitor student progress. So, in the LS faculty view, dashboards were designed according to the best practices of information visualization for decision support (Wexler et al. 2017, Few 2006), whereas in the student view the visualization of the learning experience is immersed in gamification elements.
Learning dashboards are an important component of LA applications. Few (2006) defines a dashboard as a “visual display of the most important information needed to achieve one or more objectives that has been consolidated on a single computer screen so it can be monitored and understood at a glance”. This definition highlights some key aspects of dashboard design. First, dashboards are linked to decision support, providing the appropriate visual displays with the right information (at the right time and with the right context) that enables the decision maker to act upon relevant information. Second, dashboards focus on the most important information, meaning that some options need to be taken at design time, to avoid clutter. Third, dashboards are a type of visualization that needs to be rapidly understood and analyzed by users. Current research and practice on dashboard design promote the use of visual perception principles, which are important to deliver these key aspects (Wexler et al. 2017, Nussbaumer Knaflic 2015). The main challenges of dashboard design are therefore to learn how to stand out the most important information and how to arrange consistently and coherently the layout of a dashboard to efficiently support decision-making. These principles guided the LS dashboard design in the faculty view. However, for the LS student view, fun was mostly the design compass, but interfaces still kept the minimalistic and clean aesthetics of the LS design. In this paper, we discuss the design options for the visualizations of the student view.
3.1. Student view dashboards
The main motivation for developing the LS platform was the need to customize the learning path of students in very demanding courses, in terms of the needed autonomous work and assignments students are required to perform to master the lectured subjects. Decision support courses, and Data Warehouse courses, in particular, tend to have lower student satisfaction scores due to the
complexity of the subject and the amount of effort and study hours required to obtain a good grade. Therefore, the use of gamification elements in this setting seamed a very good idea to increase engagement and motivation of students to do well in the course.
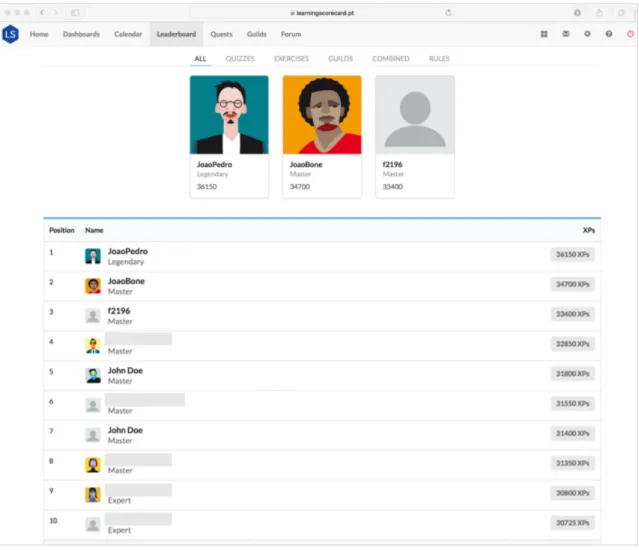
In the remaining of this paper we will use the LS performance of students in the Data Warehouse (DW) course of 2107-2018. The practical assignment of the DW course requires teamwork, hence, students are grouped into guilds. Students from the same program belong to the same alliance. In the LS, students need to perform quests in order to gain experience points (XPs). Students compete in the LS individually and in guilds. Five leaderboards have been created to display student performance: All, Quizzes, Exercises, Guilds, and Combined. The first leaderboard – All – displays the total number of XPs earned in all performed quests and awarded trophies. Badges are earned throughout the semester; however, trophies are awarded only once at the end of the semester, after completion of all proposed quests. Trophies are a way to give a special prize to the best students in selected categories. Currently, three leaderboard trophies have been designed: Best Score Player, Best Guild, and Best Triathlon Player, awarded to the student(s) on top of the All, Guilds, and Combined leaderboards, respectively (see Figures 1, 2 and 3). Each trophy has a reward of 1000 XP. Note that due to confidentially requirements, some student names in Figures 1 and 3 have been anonymized. Students that appear as John Doe in the leaderboards have chosen, in the LS registration process, not to be identified by their username.
Figure 2. Learning Scorecard: Guilds Leaderboard
Figure 3. Learning Scorecard: Combined Leaderboard
The Quizzes and Exercises leaderboards display players ranked by the number of XP earned in those quests, respectively. The Combined leaderboard lists players according to a combined rank, calculated as the sum of the player’s position in three leaderboards: All, Quizzes and Exercises. The players with the lowest values, meaning, they have a higher position in the other leaderboards are considered the best and are presented on top. Therefore, the combined leaderboard lists the course’s best overall players in the Learning Scorecard.
Students can also fine monitoring their activities in the LS, by browsing through the My History page (in Figure 4), which is basically a log with a track record of performed quests and awarded XP.
Figure 4. Learning Scorecard My History: quest tracking record
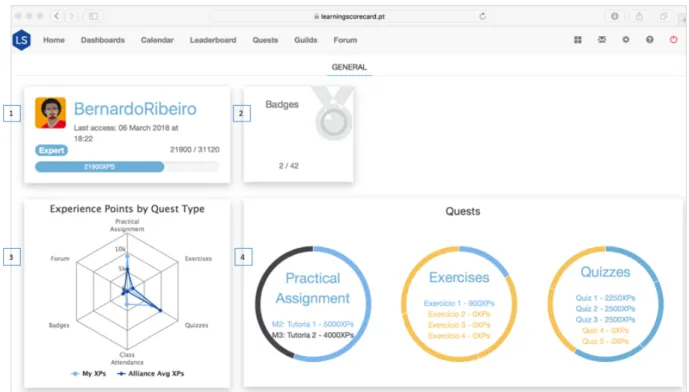
Complementary to the detailed activity monitoring described so far, students can also access a synthesis page, called Dashboards, displayed in Figure 5. This page provides a visualization of the extent to which a student is achieving his/her goals for the course. Regular monitoring of this page encourages students to take the appropriate actions towards the fulfillment of their goals. Data displayed in Figures 1 to 5 have been kindly sent by students.
Figure 5. LS student view: Dashboard
This visualization is divided into four areas. Area 1 on Figure 5, contextualizes the student “LS bio” in terms of username, avatar, rank, number of current XP versus what he/she needs to level up. The number of collected badges (versus the total amount of badges) is displayed in area 2. The spider chart in area 3 of Figure 5, details the individual student performance in comparison with the average performance of the class (alliance), in terms of the number of XP earned for all quest types
(i.e., practical assignment, exercises, quizzes, class attendance, badges, and forum). This is the benchmarking component that can be used to trigger the student’s reflection on his/her current performance and how well they did comparing to their colleagues. Finally, area 4 breaks down the XP earned or lost in the main quests – practical assignment, exercises, and quizzes.
Currently, quizzes are performed using the e-learning platform Blackboard. The final scores (in %) are then imported into the LS, which are later converted into XP. A quiz grants a maximum amount of 2500 XP. Exercises are submitted to the e-learning system, and are later graded by teachers with a grade from A to F. Each exercise grants a maximum of 1500 XP. The practical assignment quest is a tutorial meeting in which the guild meets with the teachers and receives feedback on the development of their work group technical assignment. At the end of this meeting students receive a qualitative evaluation with a grade with the standard scale A to F. In each tutorial meeting students can receive a maximum of 5000 XP.
The student homepage in the Learning Scorecard, presented in Figure 6, is used to display the LS student bulletin (area 1), with the student’s avatar, username, rank, and number of badges. There is also a notifications section (area 3 in Figure 6) to display open quests and events that students are required to take action. Finally, the visualization in area 2 shows the student’s learning experience in terms of rank progression. There are six ranks defined: legendary, master, expert, skilled, rookie, and newbie. These ranks are accumulative in terms of the number of awarded XP. That is the idea behind the ranks visualization in area 2. For instance, in Figure 6, qwerty – our test student – is currently at 58% of skilled rank.
Figure 6. Initial student view page
4. Conclusions
The Learning Scorecard platform is a research project developed at the ISCTE – Instituto Universitário de Lisboa that is being used since 2016, in Data Warehouse and Business Intelligence courses. Current learning dashboards for the student view incorporate several gamification visualizations to assess individual student performance in a course. Future works intends to take advantage of historical data to determine student profiles, based on their learning behavior patterns. These profiles can be used to inform students of successful learning paths and provide personalized guidance and recommendations to attain better results (learning experience and performance).
1
2
The LS also has a faculty view, with dashboards designed according to BI best practices for decision support. However, these visualizations were not the focus of this paper. Given the detailed set of data collected in the student view and possible analytical capabilities (e.g., data mining and machine learning), faculty dashboards are information rich providing a multi-dimensional view of student learning data. Fun and engagement are no longer the drivers for this design, but effective and in-time support for decision making.
5. REFERENCES
Barata, G., Gama, S., Jorge, J., Gonçalves, D. (2013). Engaging Engineering Students with
Gamification: an empirical study. In Proceedings of 5th International Conference on Games and
Virtual Worlds for Serious Applications (VS-GAMES 2013), Bornemouth, UK, 11-13 Sep 2013, p. 1-8 Cardoso, E., Santos, D., Costa, D., Caçador, F., Antunes, A., Parada, R. (2016). Learning scorecard:
monitor and foster student learning through gamification. 2nd International Workshop on
Educational Knowledge Management (EKM 2016), Bologna, Italy, 20 Nov. 2016. Best paper award. Cardoso, E., Costa., D., Santos, D. (2017). Introducing the Learning Scorecard: a tool to improve the
student learning experience. In Proceedings of 23rd International Conference on European University
Information Systems (EUNIS 2017), Münster, Germany, 7-9 June 2017. EUNIS Doerup E-learning
Award 2017
Few, S. (2006). Information Dashboard Design: the effective visual communication of data. O’Reilly. Freitas, S.D., Gibson, D., Alvarez, V., Irving., L., Star, K., Charleer, S., Verbert, K. (2017). How to
Use Gamified Dashboards and Learning Analytics for Providing Immediate Student Feedback and Performance Tracking in Higher Education. In Proceedings of 26th International Conference on World
Wide Web Companion (WWW’17 Companion), Perth, Australia, p. 429-434
SOLAR (2011). Open Learning Analytics: an integrated & modularized platform. Retrieved March 1, 2017, from http://solaresearch.org/wp-content/uploads/2011/12/OpenLearningAnalytics.pdf Nussbaumer Knaflic, C. (2015). Storytelling with data: a data visualization guide for business
professionals. Wiley.
Verbert, K., Duval., E., Klerkx, J., Govaerts, S., Santos, J.L. (2013). Learning Analytics Dashboard
Applications. American Behavioral Scientist, Vol. 57, No.10, p. 1500-1509
Verbert, K., Govaerts, S., Duval, E., Santos, J.L., Van Assche, F., Parra, G., Klerkx, J. (2014).
Learning Dashboards: an overview and future research opportunities. Personal and Ubiquitous
Computing, Vol. 18, No. 6, p. 1499-1514
Wexler, S., Shaffer, J., Cotgreave, A. (2017). The Big Book of Dashboards: visualizing your data
using real-world scenarios. Wiley.
6. AUTHORS’ BIOGRAPHIES
Prof. Dr. Elsa Cardoso. Assistant Professor, Director of the Master in
Integrated Business Intelligence Systems at Instituto Universitário de Lisboa (ISCTE-IUL), Portugal, and leader of the Business Intelligence Task Force of EUNIS. She is also a researcher at the Information and Decision Support Systems Group of INESC-ID Lisboa, Portugal. She has a PhD in Information Science and Technology, with a specialization in Business Intelligence. Her research interests include business intelligence and data warehousing, data visualization, big data analytics, performance management, balanced scorecard, applied to Higher Education and Healthcare. She received the EUNIS Doerup E-learning Award 2017, and the best paper award at EKM2016 and EUNIS 2003.
Tiago Pedroso is a graduate student of the Master program in Computer
Science Engineering at Instituto Universitário de Lisboa (ISCTE-IUL), with a specialization in Information and Knowledge Management Systems. He has an undergraduate degree in Computer Science Engineering (2016) also from ISCTE-IUL. His research interests include business intelligence and gamification.
Francisco Rações is a graduate student of the Master program in Computer
Science Engineering at Instituto Universitário de Lisboa (ISCTE-IUL), with a specialization in Information and Knowledge Management Systems. He has an undergraduate degree in Computer Science Engineering (2016) also from ISCTE-IUL. His research interests are business intelligence and data visualization.
Artur Baptista is a graduate student of the Master program in Computer
Science Engineering at Instituto Universitário de Lisboa (ISCTE-IUL), with a specialization in Information and Knowledge Management Systems. He has an undergraduate degree in Computer Science Engineering (2017) also from ISCTE-IUL. His research interests are business intelligence, gamification and software engineering.
Prof. Dr. José Barateiro He is currently the head of the Information
Technologies Unit of the National Laboratory for Civil Engineering (LNEC), associated researcher at INESC-ID (Information and Decision Support Systems Group), and invited Professor at NovaIMS - Universidade Nova de Lisboa and ISCTE-IUL. Holds a Ph.D. in Computer Science and Engineering from Instituto Superior Técnico – Universidade de Lisboa, focused on information systems and risk management. He also holds a Master degree in Computer Science and Engineering from the same university, specialized on data quality and decision support systems. From his publication track, he received the best paper award at iPRES 2014, best student paper award at ICADL 2008 and a best paper nomination at HICSS-45.