UNIVERSITAT DE BARCELONA
UNIVERSITY OF BARCELONA
FACULTAT DE QUÍMICA
FACULTY OF CHEMISTRY
V
V
e
e
r
r
i
i
f
f
i
i
c
c
a
a
t
t
i
i
o
o
n
n
a
a
n
n
d
d
M
M
a
a
i
i
n
n
t
t
e
e
n
n
a
a
n
n
c
c
e
e
o
o
f
f
A
A
n
n
a
a
l
l
y
y
t
t
i
i
c
c
a
a
l
l
I
I
n
n
s
s
t
t
r
r
u
u
m
m
e
e
n
n
t
t
s
s
A
A
c
c
c
c
o
o
r
r
d
d
i
i
n
n
g
g
t
t
o
o
I
I
S
S
O
O
/
/
I
I
E
E
C
C
1
1
7
7
0
0
2
2
5
5
S
S
t
t
a
a
n
n
d
d
a
a
r
r
d
d
EUROPEAN MASTER IN QUALITY IN ANALYTICAL LABORATORIES
Marta Isabel Gonçalves Zacarias
Barcelona, February 2010Dr. Ramon Companyó and Dr. Montserrat Llauradó, Professors of the Department of Analytical Chemistry at University of Barcelona,
Attest
The current work titled “Verification and Maintenance of Analytical Instruments According to ISO/IEC 17025 Standard”
has been conducted by Marta Isabel Zacarias in the Department of Analytical Chemistry at University of Barcelona under our supervision
Barcelona, February 2010
_______________________ _____________________
A
CKNOWLEDGMENTSIt is a pleasure to thank the many people who made this thesis possible.
First of all I would like to thank my supervisors: Doctor Ramón Compañó and Doctor Montserrat Llauradó for their tireless help, productive suggestions and friendship. Second I would like to thank very especially Professor Alice Newton who is like a second mother, the person who suggested doing this master course. Thank you Professor Alice Newton by your advice to do this master course, by your help and support during all the time.
I would like to say a big thanks to the laboratory technician, Anna Salamiá for their availability for help me in the experimental work.
I also express my gratitude to my residence colleagues by their friendship, help, support and company during the six months in Barcelona.
I would also like to thank all my friends that gave me the strength and support to carry out this work.
Finally, I would like to thank to my parents by their loving support and guidance as well as their faith in me.
Abstract
Equipment verification and preparation of the documents related to this activity were made. The equipment verification was performed on balances and analytical balances, liquid chromatographs and gas chromatographs.
With respect to the balances and analytical balances verification, repeatability, trueness and drift assays were performed. A SOP containing the instructions for the verification, forms to register the primary data obtained from the verification assays, excel sheets to carry out the calculations for the assays, verification notebooks including the form mentioned above and archives to save all the results obtained from such assays were prepared.
The performance verification was carried out for two liquid chromatographs. The following verification assays were performed: injector precision, flow rate precision, injector linearity and carryover, detector linearity, noise and drift, flow rate trueness and gradient accuracy. A SOP containing the instructions for the verification, an excel sheet to carry out the necessary calculations for the verification assays and an archive to save the obtained chromatograms and results were prepared for each instrument. For one of the liquid chromatographs a SOP containing the maintenance instructions was written.
Two gas chromatographs were verified, one with Thermal Conductivity Detector (TCD) and another one with Flame Ionization Detector (FID). The documents related to the verification and mentioned for the liquid chromatographs were also prepared for these equipments. The following verification assays were performed: flow rate precision, detector linearity, noise and drift, oven temperature precision, trueness, linearity and stability. A SOP containing the maintenance instructions was prepared for both gas chromatographs.
The proposed objectives were achieved.
Keywords: Performance Verification, Maintenance, Calibration, Equipment Qualification, Traceability.
Index
1. Objectives ... 1
2. Introduction ... 1
2.1.. ISO/IEC 17025 and Accreditation ... 4
2.2.Calibration, Verification, Maintenance and Equipment qualification ... 5
a. Calibration ... 5
b. Verification ... 6
c. Calibration and Verification: Differences and Similarities ... 8
d. Maintenance ... 8
e. Equipment Qualification ... 9
2.3.Traceability and Standards... 11
3. Experimental Part ... 15
3.1.Performance Verification of Balances and Analytical Balances ... 15
3.2.Performance Verification of High-Performance Liquid Chromatography (HPLC) ... 18
3.3.Liquid Chromatography Maintenance ... 26
3.4.Performance Verification of Gas Chromatography ... 26
3.5.Gas Chromatography Maintenance ... 30
4. Results and Discussion ... 32
4.1.Performance Verification of Balances and Analytical Balances ... 32
a) Analytical Balance Mettler Toledo AB204 ... 34
b) Analytical Balance Mettler Toledo AG245... 35
c) Analytical Balance Scaltec SBA 32 ... 36
d) Analytical Balance AND GR200 ... 37
e) Balance Sartorius LP 2200P ... 38
4.2.Performance Verification of HPLC... 39
4.2.1. Liquid Chromatograph HP 1050 with UV/VIS detector ... 39
Verification of the Liquid Chromatograph Agilent 1100... 50
4.3.Performance Verification of Gas Chromatography (GC) ... 59
4.3.1. Gas Chromatograph with Thermal Conductivity Detector (TCD) ... 59
4.3.2. Gas Chromatograph with Flame Ionization Detector (FID) ... 68
5. Conclusions ... 79
6. References ... 81
Index of Figures
Figure 1: Differences and similarities between calibration and verification [5].... ... 8
Figure 2: Equipment qualification process ... 10
Figure 3: The traceability chain [3]... 12
Figure 4: Verification Form of Balances ... 16
Figure 5: Excel sheet for the calculations in the verification assays of an analytical balance... 17
Figure 6: Verification notebook for an analytical balance ... 18
Figure 7: Noise measurement ... 20
Figure 8: Drift measurement ... 21
Figure 9: Gradient accuracy measurement performed for the HP 1050 ... 22
Figure 10: Excel sheet for the calculations in the verification assays of the HP 1050 ... 23
Figure 11: Noise measurement for the Agilent 1100 ... 24
Figure 12: Gradient accuracy measurement for the Agilent 1100 ... 25
Figure 13: Excel sheet for the calculations in the verification assays of the Agilent 1100 ... 26
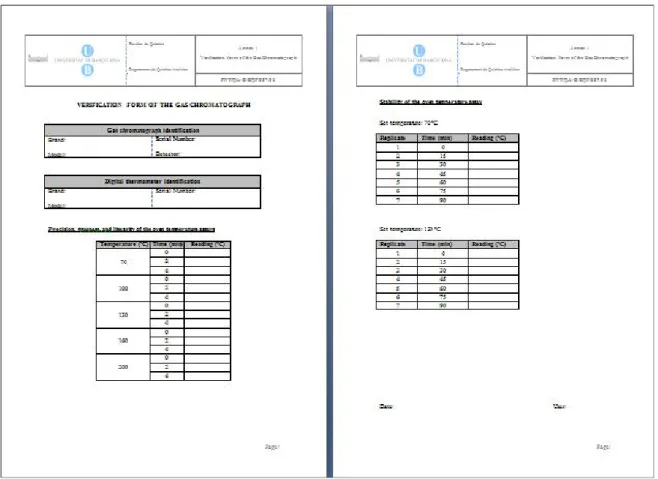
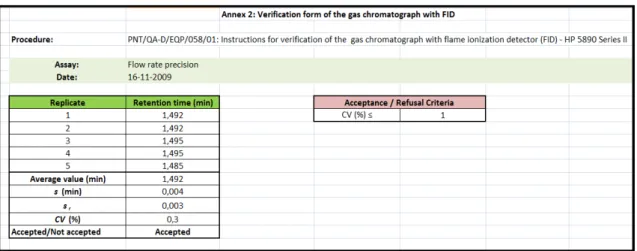
Figure 14: Verification form for the gas chromatographs ... 29
Figure 15: Excel sheet for the calculations in the verification assays of the GC with TCD ... 30
Figure 16: Excel sheet for calculations in the verification assays of the GC with FID ... 30
Figure 17: Detector linearity (HP 1050) ... 42
Figure 18: Noise measurement proposed by Hinshaw ... 43
Figure 19: Noise measurement proposed by Dolan [29]. ... 44
Figure 20: Noise measurement (HP 1050) ... 44
Figure 21: Drift measurement (HP 1050). ... 46
Figure 22: Injector linearity (Agilent 1100) ... 51
Figure 23: Detector linearity (Agilent 1100) ... 55
Figure 24: Noise measurement (Agilent 1100)... 56
Figure 25: Drift measurement (Agilent 1100) ... 57
Figure 26: Detector linearity (GC with TCD). ... 61
Figure 27: Noise measurement (GC with TCD) ... 62
Figure 28: Wander and noise [33] ... 62
Figure 29: Drift measurement (GC with TCD) ... 63
Figure 30: Linearity of the oven temperature (GC with TCD) ... 65
Figure 31: Detector linearity assay (GC with FID)... 71
Figure 32: Noise measurement (GC with FID) ... 71
Figure 33: Drift measurement (GC with FID) ... 72
Index of Tables
Table 1: Organizations in metrology ... 2 Table 2: Acceptance/ refusal criteria for analytical balances ... 32 Table 3: Acceptance/ refusal criteria for balances ... 32 Table 4: Primary data obtained from the trueness and repeatability assays on 17/09/09 for an analytical balance. ... 32 Table 5: Primary data obtained from the drift assay on 17/09/09 for an analytical balance. ... 32 Table 6: Obtained results and calculations registered in the excel sheet for the trueness and repeatability assays of an analytical balance. ... 33 Table 7: Obtained results and calculations registered in the excel sheet for the drift assay of an anlytical balance ... 34 Table 8: Final results obtained from the verification assays of the analytical balance AB204. .. 35 Table 9: Final results obtained from the verification assays of the analytical balance AG245. .. 35 Table 10: Final results obtained from the verification assays of the analytical balance SBA 32. ... 36 Table 11: Final results obtained from the verification of the analytical balance GR200 ... 37 Table 12:Results obtained in the verification of the balance LP 2200 ... 38 Table 13: Results obtained from the injector precision assay on 29/09/2009 and the acceptance/ refusal criteria (HP 1050) ... 39 Table 14: Results obtained from the flow rate precision assay on 29/09/09 and the acceptance/ refusal criteria (HP 1050) ... 40 Table 15: Results obtained in the flow rate trueness assay on 29/09/09 and the
acceptance/refusal criteria (HP 1050) ... 41 Table 16: Results obtained in the detector linearity assay on 29/09/2009 and the
acceptance/refusal criteria (HP 1050) ... 42 Table 17: Results obtained in the detector noise assay on 30/09/2009 and the acceptance/ refusal criteria (HP 1050) ... 45 Table 18: Results obtained from the detector drift assay on 30/09/2009 and the
acceptance/refusal criteria (HP 1050) ... 46 Table 19: Results obtained from the gradient accuracy assay on 21/10/2009 and the
acceptance/refusal criteria (HP 1050) ... 49 Table 20: Results obtained in the injector precision assay on 30/10/2009 and the
acceptance/refusal criteria (Agilent 1100)... 50 Table 21: Results obtained in the injector linearity assay on 30/10/2009 and the
Table 22: Results obtained from the injector carryover assay on 29/10/2009 and the
acceptance/refusal criteria (Agilent 1100)... 52 Table 23: Results obtained from the flow rate precision assay and the acceptance/refusal criteria (Agilent 1100) ... 53 Table 24: Results obtained from the flow rate trueness assay on 02/11/2009 and the
acceptance/refusal criteria (Agilent 1100)... 54 Table 25: Results obtained from the detector linearity assay and the acceptance/refusal criteria (Agilent 1100) ... 55 Table 26: Results obtained from the detector noise assay on 02/11/2009 and the
acceptance/refusal criteria (Agilent 1100)... 56 Table 27: Results obtained from the detector drift assay on 02/11/2009 and the
acceptance/refusal criteria (Agilent 1100)... 58 Table 28: Results obtained from the gradient accuracy assay on 03/11/2009 and the acceptance/ refusal criteria (Agilent 1100) ... 59 Table 29: Results obtained from the flow rate precision assay on 06/11/2009 and the
acceptance/refusal criteria (GC with TCD) ... 60 Table 30: Results obtained from the detector linearity assay on 06/11/2009 and the
acceptance/refusal criteria (GC with TCD) ... 60 Table 31: Results obtained from the detector noise assay on 17/12/2009 and the
acceptance/refusal criteria (GC with TCD) ... 62 Table 32: Results obtained from the detector drift assay on 17/12/2009 and the acceptance/ refusal criteria (GC with TCD) ... 63 Table 33: Results obtained from the linearity of the oven temperature assay on 01/12/2009 and the acceptance/ refusal criteria (GC with TCD) ... 64 Table 34: Acceptance/ refusal criteria for precision of the oven temperature assay (GC with TCD) ... 66 Table 35: Acceptance/ refusal criteria for trueness of the oven temperature assay (GC with TCD) ... 66 Table 36: Results obtained from the trueness and precision of the oven temperature assay on 01/12/2009 and the acceptance/ refusal criteria (GC with TCD)... 66 Table 37: Results obtained from the stability of the oven temperature assay for the set
temperatures at 70 and 1300 C and the acceptance/ refusal criteria (GC with TCD) ... 67
Table 38: Results obtained from the flow rate precision assay on 16/11/2009 and the
acceptance/ refusal criteria (GC with FID) ... 69 Table 39: Results obtained from the detector linearity assay on 17/11/2009 and the
Table 40: Results obtained from the detector noise assay on 17/11/2009 the and
acceptance/refusal criteria (GC with FID) ... 72 Table 41: Results obtained from the detector drift assay (GC with FID)... 73 Table 42: Results obtained from the linearity of the oven temperature assay and the acceptance/ refusal criteria (GC with FID) ... 73 Table 43: Acceptance/ refusal criteria for precision of the oven temperature assay (GC with FID) ... 75 Table 44: Acceptance/ refusal criteria for trueness of the oven temperature assay (GC with FID) ... 75 Table 45: Results obtained from the trueness and precision of the oven temperature assays on 30/11/2009 (GC with FID) ... 75 Table 46: Results obtained from the stability of the oven temperature assay for the set
List of Acronyms
VIM – International Vocabulary of MetrologySOP – Standard Operating Procedure
HPLC – High Performance Liquid Chromatography GC – Gas Chromatography DQ – Design Qualification IQ – Installation Qualification OP – Operational Qualification PQ – Performance Qualification RM – Reference Material
CRM – Certified Reference Material TCD – Thermal Conductivity Detector FID - Flame Ionization Detector
1. Objectives
Maintenance, verification and calibration are fundamental activities in order to ensure the suitable performance of the analytical instruments and the reliability of the measurements carried out in analytical laboratories.
The purpose of the present research project is to design processes for the maintenance and verification of some analytical instruments in some laboratories of the Analytical Chemistry Department of the Faculty of Chemistry in the University of Barcelona. The design of such processes includes the following: preparation of material and reagents for verification assays, execution of procedures in order to check if they are suitable or not, and preparation of the documents for the quality management system: (standard operating procedures (SOPS), records, file templates and archives to save the results obtained).
2. Introduction
Good analytical results are essential in order to take reliable decisions. Analytical measurements affect the daily lives of every citizen. Sound, accurate and reliable analytical measurements are fundamental to the functioning of modern society. A wrong result can have an enormous social and economic impact, for instance [1]:
“In trade, it could lead to the supply of sub-standard goods and the high cost
of replacement with subsequent loss of customers”;
“In environmental monitoring, mistakes could lead to hazards being
undetected or to the identification of unreal hazards”;
“In supply of drinking water, it could lead to harmful contaminants being
undetected”;
“In healthcare, the incorrect medication or the incorrect content of an active
ingredient in a tablet can be catastrophic for the patient”.
In agreement with Sommer et al, the correctness of measurements and measuring instruments is one of the key prerequisites to ensure the quality of products and services, and the accuracy of the instruments must be consistent with their intended use [2].
Calibration and verification are the most important actions to ensure the correct indication of measuring instruments [2]. Taking into account the industrial metrology,
Introduction regular calibration of measuring instruments should be carried out in agreement with the implemented quality systems. The industrial metrology ensures the appropriate functioning of measurement instruments used in industry as well in production and testing processes, in order to guarantee the quality of life for citizens and for academic research [3]. The principles of industrial metrology can also be applied to academic research in institutions such as universities, researches centres.
Concerning the legal metrology, periodic verification of instruments should be performed according to legal regulations. Legal metrology is responsible for ensuring the accuracy and reliability of measurement where measured values can affect safety, health or the transparency of financial transactions (e. g. weights and measures) [3].
Table 1 shows an overview of prominent institutions offering guidance on metrology. This table includes metrological institutions and their main purpose.
Table 1: Organizations in metrology
Institution Purpose
OIML- International Organisation of
Legal Metrology
To promote the global harmonisation of legal metrology procedures [34].
BIPM - Bureau International des Poids et
Mesures
To ensure worldwide uniformity of measurements and their traceability to the International System of Units (SI). Deals with scientific metrology [20].
WELMEC – European Cooperation in
Legal Metrology
To establish a harmonized and consistent approach to legal metrology [35].
EURAMET - European Association of
National Metrology Institutes
To coordinate the cooperation of National Metrology Institutes (NMI) of Europe in fields like research in metrology, traceability of measurements to the SI units, international recognition of national measurement standards and of the Calibration and Measurement Capabilities (CMC) of its members[36].
EURACHEM - European Federation of
National Associations of Measurement, Testing and Analytical Laboratories
To establish a system for the international traceability of chemical measurements and promote good quality practices [37].
CITAC - Cooperation on International
Traceability in Analytical Chemistry
To foster collaboration among existing organisations to improve the international comparability of chemical measurements. To prepare a directory of international chemical metrology activities [38].
The equipment maintenance is also a very important activity. If the maintenance is preventive it will represent a cost-effective method of maintaining equipment, since it prevents failures, damage or malfunctioning. Corrective maintenance is also essential because it allows the reparation of the equipment and accordingly its conservation during more time [15].
Regarding the concept of quality assurance, non-analytical chemical laboratories have become aware that it is important to apply quality criteria to their processes. Some higher education institutions have included theoretical subjects on quality assurance in several curricula, such as pharmacy, engineering and chemistry. Hence, practical teaching becomes also necessary in order to complement the learning of this subject. Moreover, the adoption of a system of readable and comparable degrees throughout Europe has arisen in higher education. Due to this last occurrence and new requirements of the stakeholders, arise the necessity of managing teaching laboratories not only in an adequate and traditional way but also in order to produce an efficient answer to the rapidly occurring changes in the curricula and programmes. The solution for these changes is the implementation of a quality management system in teaching laboratories [11].
In this project the verification of equipment and the preparation of the documents related to this activity like standard operating procedures, forms, file templates and archives were made. The verification was performed on balances and analytical balances, liquid chromatographs and gas chromatographs. Procedures containing the work instructions for the maintenance of laboratory equipment have also been prepared. The equipment verification, the preparation of the documents above mentioned related with verification were performed for research and teaching laboratories since these laboratories are implementing a Quality Management System (QMS).
The QMS for teaching laboratories aims to improve the technical and economic management as well the performance of these laboratories and the educational quality of the practical work.
Introduction
2.1. . ISO/IEC 17025 and Accreditation
Calibration, verification and maintenance are requirements of ISO/IEC 17025 for the laboratory equipment [21]:
“Equipment used for testing, calibration and sampling shall comply with specifications ...” (5.5.1)
“Before being placed into service, equipment (including that used for sampling) shall be calibrated or checked to establish that it meets the laboratory’s specification requirements and complies with relevant standard specifications. It shall be checked and/or calibrated before use”. (5.5.2)
“Instructions on use and maintenance of equipment should be readily available...”
(5.5.3).
ISO/IEC 17025 is the International Standard which specifies the general requirements for the competence of testing and calibration laboratories. General requirements for the competence of testing and calibration laboratories include management requirements and technical requirements. This International Standard can be applied to all laboratories regardless of the extent of the scope of testing and/or calibration activities or the number of workers. This document should be used by accreditation bodies that recognize the competence of testing as well as calibration laboratories, as a basis for accreditation. This International Standard may also be used by laboratory customers and regulatory authorities in confirming or recognizing the competence of laboratories. This International Standard verifies that testing and calibration laboratories operate a management system, are technically competent, and are able to generate technically valid results [21].
Accreditation is a formal procedure by which an authoritative body confers formal recognition that a body or a person is competent to carry out specific tasks [39].
Laboratory accreditation is a means of determining the technical competence of laboratories to carry out specific activities of testing, measurement and calibration. Laboratory accreditation provides a ready means for customers to identify and choose reliable testing, measurement and calibration services to be able to fulfil their needs. It allows to check if laboratories are performing their work in an adequate way and to suitable standards and thus provides them with a benchmark for keeping that competence [40].
2.2. Calibration, Verification, Maintenance and Equipment qualification
a. Calibration
The balances and analytical balances calibration was not carried out during this research project, although the concept of calibration is discussed briefly since there is a strong relationship between this concept and the equipment verification concept.
ISO/ IEC Guide 99, the International Vocabulary of Metrology (VIM) defines calibration as [4]:
“Operation that, under specified conditions, in a first step, establishes a relation between the quantity values with measurement uncertainties provided by measurement standards and corresponding indications with associated measurement uncertainties and, in a second step, uses this information to establish a relation for obtaining a measurement result from an indication”.
The main objectives of equipment calibration are: to assess the measurement capacity of the instruments in order to guarantee the comparability of the obtained results with those obtained by other laboratories; to validate the analytical methods and to establish quality control [5].
In agreement with the European Association of National Metrology Institutes (EURAMET), the main reasons for having an instrument calibrated are: to establish and demonstrate traceability; to ensure readings from the instrument are consistent with other measurements; to determine the accuracy of the instrument readings; to establish the reliability of the instrument i.e. that it can be trusted [3].
Generally, calibration is an operation which establishes a relationship between an output quantity and an input quantity for an instrument or a measuring system under specified conditions. Depending on the relationship between the characteristic quantities considered (both from the reference value and from the instrumental signal) and the purpose of calibration two types of calibrations can be identified, direct and indirect calibration [7]. Hence, a measuring instrument can be calibrated directly or indirectly. The type of calibration will depend on its nature, the kind of measurement to be performed and the purpose of the calibration [7].
In direct calibration the value of the standard (known reference value) is expressed in the same magnitude as the response of equipment that carries out the measurement. The analytical balances calibration is a characteristic example of direct calibration. Both the standard mass as the analytical balance indication are expressed in units of mass [8].
Introduction In indirect calibration (also known as analytical calibration), the value of the standard (reference value) is expressed in a different magnitude to the equipment answer. The measuring equipment gives a value (namely a signal or instrumental response) which has a different quantity from that characteristic of the standard, and then both are expressed in different units. The indirect calibration procedure consists of obtaining the instrumental response corresponding to a series of standards characterized by a known value of the measurand [5] [8].
The chromatograph calibration and spectrophotometer calibration are examples of indirect calibration. The chromatograph calibration relates the peak height or peak area (instrumental response) withthe concentration of the standard solutions. The calibration spectrophotometer establishes the relationship between the concentration of the standard solutions with a magnitude of optical type (absorbance, emission, wavelength, etc.) [5].
b. Verification
The calibration of equipment is not enough to ensure that the operating conditions of a measuring instrument are good and guarantee the comparability of the obtained results with those obtained by other laboratories. This is especially meaningful for analytical instruments in which it is necessary to control numerous operative parameters that affect the sensitivity or selectivity of the instrumental response [5]. For instance, the flow rate of the mobile phase, in the liquid chromatograph, will affect the retention time and the width of the chromatographic peaks [12]. Similarly, it is also necessary to take into account factors which affect the precision of the instrumental response. For instance, the precision of the injector, in the liquid chromatograph, will affect the peak area or peak height [12].
On the other hand, there is laboratory equipment which doesn’t perform direct measurements and then doesn’t need to be calibrated, however requires the control of the operating conditions which can affect the obtained results. For example, the temperature of a thermostatic bath needs to be controlled [5].
Taking into account what has been mentioned previously, one may conclude that the verification performance is an essential action in order to ensure the correct performance of the measuring equipment in laboratories.
ISO/ IEC Guide 2 defines verification as:
“Confirmation by examination and provision of evidence that specified
requirements have been met”[4].
Verification is the confirmation, based on evidences (facts, test results) that some specified requirement has been fulfilled. For instance, the performance of the balance is still in agreement with the calibration certificate [1]. The result from a verification assay will show if the measuring equipment is in agreement with its required specifications, which are generally expressed as tolerances [5]. The verification of measuring instruments includes testing and requires the availability of clear specifications and acceptance/refusal criteria [13].
Verification provides means of checking that the deviations between the values displayed by a measuring instrument and the corresponding known values of measured quantity are under control. For instance, in the balances verification, the balance gives a reading that is close enough or not to the true value of a standard weight to enable the analyst to decide if the equipment should be used [1]. Either of the following is the result of the verification process [5]:
a) The equipment can be in good working conditions and its performance is considered correct. In this case, the date of the next verification is scheduled. b) The equipment is not in perfect working conditions; however it can be used with
restrictions. These restrictions can affect the working ranges. c) The equipment cannot be used and should be repaired or adjusted.
The verification performance of balances, liquid chromatographs and gas chromatographs was carried out during this research project. Balances play the primary role of weighting the portions to be analysed, so they must be within their specifications
(verified). High-Performance Liquid Chromatography (HPLC) and Gas
chromatography (GC) are analytical techniques widely used in analytical laboratories. These techniques are used to carry out analysis with numerous applications such as: pharmaceutical, food, chemical, cosmetic, environmental and clinical.
To provide a high level of assurance that the data produced by HPLC and GC analysis are reliable the performance of the equipments should be verified regularly. So the performance verification of the gas chromatographs is an essential activity since it ensures the correct behaviour of these measuring instruments.
Introduction
c. Calibration and Verification: Differences and Similarities
Taking into account the definitions of calibration and verification mentioned above, one may conclude that they are different activities and, in many cases, are complementary.
Sometimes, in the laboratories, there is misunderstanding of the terms “calibration” and “verification”. The concept of equipment verification is referred to as equipment calibration. The misunderstanding of these terms is due to both actions are closely related and are mostly based on the same measuring procedures. Hence, it is essential to clarify both concepts, identifying the differences and similarities (See Figure 1) [5].
Figure 1: Differences and similarities between calibration and verification [5].
d. Maintenance
There are two types of equipment maintenance: preventive maintenance and corrective maintenance. The preventive maintenance provides a means of ensuring that the instrument is kept in good working conditions and identifying any-long term problems. The preventive maintenance avoids failures, deterioration, damage or malfunctioning of the equipment. Preventive maintenance includes actions such as equipment cleaning, lubricating, reconditioning, adjustment, etc. The laboratory should
Calibration versus Verification Differences
Calibration
Attributes or correct the values indicated by an instrument or represented by a materialized measure. Requires an estimation of
the uncertainty that spreads to the measures.
Basically affects the accuracy of the measures.
Verification
It verifies the compliance of tolerances
Does not generate correction factors or uncertainty estimation Basically affects: Precision Sensitivity Selectivity Stability Similarities
Are evaluation of the state of the equipment that allow us to take decisions.
Use traceable standards.
Are valid in an interval of values of the magnitude or operating parameter
Require:
Plan and schedule Procedures
Qualified personnel Criteria of conformity
have a preventive maintenance plan for equipment containing the activities of maintenance, the periodicity of these actions and responsible people. The laboratory should document the instructions to carry out the activities of preventive maintenance and maintain records of the activities performed. The periodicity for the activities of preventive maintenance will depend upon the features of the equipment, its use (frequency, type of samples processed and personnel qualification) and the environmental conditions of the place where the equipment is located. Anyway, the preventive maintenance intervals established can be modified according to the obtained results from the calibrations or verifications, when it is necessary to analyse compromised samples (with low levels of concentration or abnormal results) or to analyse samples which contaminate the equipment [1] [5].
Some activities of preventive maintenance can be carried out by a qualified personnel who works in the laboratory (for instance the changing of the septum of the injector in the gas chromatograph). Other activities of preventive maintenance should be performed by a technical service provider, for instance, the cleaning of the optical parts of a spectrophotometer [5].
The corrective maintenance aims to repair breakdowns and corrects malfunctioning of the equipment. This type of maintenance is generally performed by a technical service provider and it should be carried out when the equipment broke down and cannot be repaired by the user [5].
e. Equipment Qualification
Calibration, verification and preventive maintenance are the activities included in the process of equipment qualification. In this section, the importance of this process is explained, how it is developed and where the activities of calibration, verification and preventive maintenance can be located within this process.
All equipment (whether it is a refrigerator used to cool samples, volumetric flask or a liquid chromatograph to determine the content of pesticides in drinking water) used in analytical laboratories needs to satisfy a primary requirement that is to be fit for its intended purpose. The GLP (Good Laboratory Practice) and international standards, such as ISO 9001 and ISO/IEC 17025 require that instruments are suitable for their intended use [1].
Introduction Equipment Qualification (EQ) is a formal process that provides documented evidence that an instrument is appropriate for its intended use and will be kept in a state of maintenance and calibration consistent with its use. The EQ process includes four stages of “qualification”: design qualification (DQ), installation qualification (IQ), operational qualification (OP) and performance qualification (PQ) [14]. (See Figure 2)
Design qualification is the first stage of the EQ process, which defines the operational and functional specifications of the instrument and describes the conscious decisions in the selection of the supplier. The operational specifications should describe the key performance features of the instrument and ranges over which the instrument is required to operate and consistently does. The functional specifications should take into account the overall requirements of the instrument including the operational specifications and other factors relating to its use (for instance, environmental conditions within which, or range over which, the instrument must operate; documentation (protocols for IQ, OP and PQ, model SOPs, etc)). DQ is considered a planning stage and is carried out once, before a new instrument is acquired by the laboratory or before an existing instrument is chosen to be used for a certain task. [1][14].
Installation qualification is the stage when checks are carried out in order to confirm that the instrument, its modules and accessories have been received as ordered (according with the specifications agreed between supplier and costumer) and that the instrument is correctly installed in the selected environment. This includes software and hardware. It may be useful to use a check-list to this phase in order to ensure that
Figure 2: Equipment qualification process
Operational Qualification (OP)
Performance Qualification (PQ) Design Qualification (DQ)
everything is checked. IQ stage is generally a one-off check when an instrument is delivered or moved [1][13][14].
Operational qualification stage aims to demonstrate and provide documented evidence that the instrument will operate according to the operational specification in the selected environment. OQ generally is carried out after the IQ of a new instrument or after a significant change to the instrument or a component such as repair. OQ should be performed in agreement with the supplier’s procedures and instructions, using suitable materials and protocols [1][14]. OQ phase should be performed regularly but not frequently. The periodicity of future OQ testing depends on factors such as the manufacturer’s recommendation, the level of the use of the instrument, the nature of the use of the instrument (for instance the use of aggressive compounds), and “criticality” of the performance of the instrument [1].
Performance qualification serves to demonstrate that the entire instrument functions correctly and to a specification suitable for its routine use. This specification may be the original operational specification or other more adequate for its actual use. PQ involves the testing of the instrument using the specific method or assay to ensure that the method is generating valid results [1][14]. Evidence of continued satisfactory performance (PQ) should be obtained from everyday method-related checks (e.g. system suitability testing, calibration and analytical control).
Taking into account the description of the equipment qualification process, it can be concluded that the activities of calibration, verification and preventive maintenance are included in performance qualification stage.
2.3. Traceability and Standards
The comparability is a key property of good results. It is important to compare results obtained in different laboratories or in the same laboratory at different times with confidence. This is possible if all laboratories are using the same measurement scale, or the same “reference points”. In many cases, the comparability of results is supported by chain of calibrations which establishes a relationship with primary national or international standards and ideally with SI units of measurement. The calibration of analytical balances is a familiar example. Each balance is calibrated using reference masses which are themselves checked against the national standards, the international standards and the primary reference kilogram. This unbroken chain of comparisons
Introduction reaching a known reference value “provides” traceability to a common reference point ensuring that different laboratories are using the same units of measurement [17][18][19].
Traceability is defined by the International Vocabulary of Metrology (VIM) as: “The
property of a measurement result whereby the result can be related to a reference through a documented unbroken chain of calibrations, each contributing to the measurement uncertainty” [9]. The word “unbroken” means that there is no loss of
information considering the different stages in an analytical procedure that allows getting a measurement result [16]. Each stage needs to be related to either a reference method, a reference material or an SI unit. The comparability of measurements is achieved through the traceability chain, the unbroken chain of comparisons, all having stated uncertainties. Traceability provides the linkage that ensures that measurements performed in different laboratories or at different times are comparable [17]. This chain ensures that a measurement result or the value of a standard is traceable to references at higher levels, leading to the primary standard [3].(See Figure 3)
Figure 3: The traceability chain [3].
SI Units
Foreign National Primary Standards National Primary Standards (Primary methods)
Secondary Standards (Secondary methods)
Working Standards (In house /working methods)
Measurements
Uncertainty increases down the traceability chain
The national
A primary standard is the standard which has the highest metrological qualities and whose value is accepted without reference to the other standards of the same quantity. Primary standards are used to calibrate secondary standards [20].
Secondary standards are defined as standards whose value arises from the comparison with a primary standard of the same quantity. Secondary standards are used to calibrate working standards [20].
Working standards are standards used routinely to calibrate or check measuring instruments, material measures or reference materials. This type of standards may be used to ensure that the routine measurements are performed in a correct way - a check standard [1][20].
Traceability of a measurement result is related with traceability of a method, which in turn is related with traceability of the equipment used and traceability of the standards [16].
In accordance with EURACHEM/CITAC the traceability of a measurement result should be established through the combination of the following procedures [19]:
1. Use of traceable standards to carry out the calibration of the measuring equipment;
2. By using a primary method or establishing a comparison to the results from this method.
3. By using a pure substance Reference Material (RM);
4. By using an adequate matrix Certified Reference Material (CRM); 5. By using an accepted, closely defined procedure.
The result obtained from a primary method is generally traceable directly to the SI. A primary method of measurement is defined as [19]: “... a method having the highest
metrological qualities, whose operation is completely described and understood in terms of SI units and whose results are accepted without reference to a standard of the same quantity.”
The traceability of results obtained from a primary method is achieved by comparing directly the measurement results of the primary method and the test or calibration method [19].
Traceability can be confirmed by measuring a sample composed of, or including, a known quantity of a pure substance Reference Material (RM). A RM is defined by VIM as [19]: “Material, sufficiently homogeneous and stable with reference to specified
Introduction
properties, which has been established to be fit for its intended use in measurement or in examination of nominal properties”.
The substance RM can be incorporated in the sample by spiking or by standard additions. As a consequence, the difference between in the response of the measurement system to the standard used and the sample tested must be evaluated due to the fact of the correction for the difference in response and its uncertainty may be large. If the uncertainty result is unacceptably large or unquantifiable thus the traceability has not been established [19].
Traceability can be also achieved by comparing the measurement results on a certified matrix CRM with certified value(s). In this procedure there is an adequate matrix CRM available, so it can reduce the uncertainty comparing with the use of a pure substance RM. However, if there is not a good match between the composition of the sample and the reference material, the uncertainty result can be unacceptably large or unquantifiable. Accordingly, if the uncertainty is not unquantifiable thus traceability has not been established [1][19].
The use of a closely defined and generally accepted procedure is very often the only factor which provides the suitable comparability of measurement results. When it is expected that results of a method or alternative procedure are comparable with an accepted procedure, traceability to the accepted values is established trough the comparison of the results obtained by the alternative and accepted procedures [19].
Traceability among standards is the most relevant basis for traceability of results. Traceability of equipment is defined as “the detailed, timely, and customised recording
of installation, periodic calibrations and corrections (if necessary), malfunctioning and repairs, hours of use, samples processed, standards used, etc., in such way that all questions ( what?, how?, who?, etc) should have a detailed answer in the pertinent documents”[16].
The calibration of measuring equipment used must be always traceable to adequate standards. Generally, the quantification stage of the analytical procedure is calibrated through the use of a pure substance reference material whose value is traceable to the SI. However this activity doesn’t provide traceability of results to SI for the complete analytical procedure. So it is also necessary to establish traceability for the results of operations carried out before the quantification stage, such as extraction and clean up of the sample, using the corresponding procedures [5][19].
3. Experimental Part
3.1. Performance Verification of Balances and Analytical Balances
A Standard Operating Procedure (SOP) containing the instructions to carry out the verification of balances and analytical balances was written. This SOP is named as “Instructions for verification of balances and analytical balances”, coded as PNT/QA-D/EQP/053/01 and can be found in Annex I.
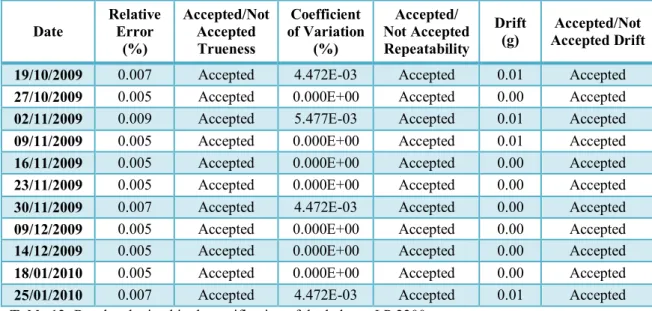
The verification of balances and analytical balances was carried out weekly. Four analytical balances and one balance were verified. The balances and analytical balances verification included the following: cleaning and level adjustment activities, and trueness, repeatability and drift assays. The cleaning and level adjustment activities were performed before carrying out the verification assays in order to guarantee that each balance would operate in suitable conditions. The cleaning of each balance was firstly done using an adequate brush to remove solids in the weighing chamber. The pan, pan support and anti draft-ring were cleaned with tissue wet with ethanol. After cleaning the level adjustment of each balance was done. After performing all the activities mentioned above, the verification assays were carried out.
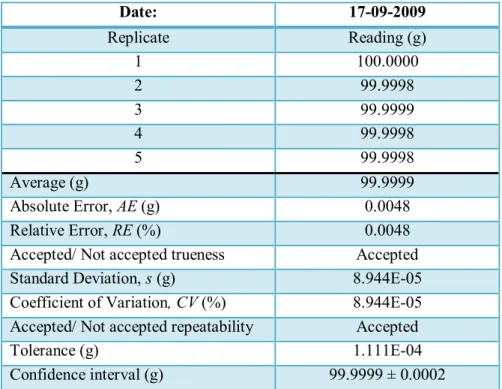
The trueness, repeatability and drift assays were performed using a standard mass of 100 g with the following specifications: code number E7249, tolerance: +/- 0.50 mg, uncertainty: +/- 0.15 mg. The calibration certificate of the standard mass is included in Annex I.
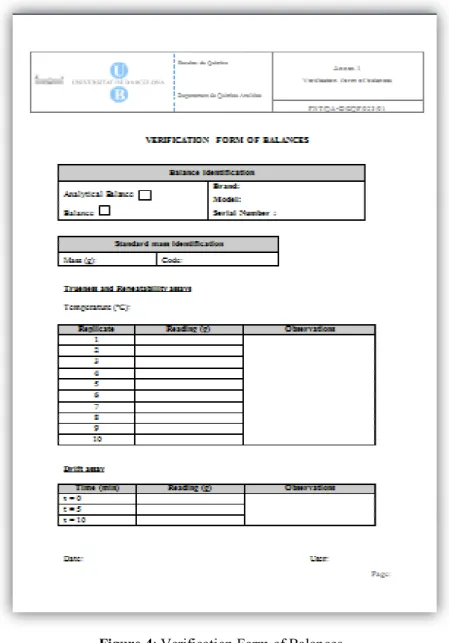
The balance was warmed up for 15 minutes in order to stabilize. During this time, the standard mass was placed close to the balance in order to reach the room temperature. While wearing gloves, the standard mass was held with tweezers. The trueness and repeatability assays were carried out by weighing the standard mass until five replicates were obtained. The masses were registered in the form named as “Verification Form of Balances” (see Figure 4) which can be found in Annex I in the SOP coded as PNT/QA-D/EQP/053/01. Between measurements, the standard mass was removed from the pan and the balance was adjusted to zero. From the values obtained (mass) in the trueness assay, the average value of the replicate measurements, the absolute error and the relative error were determined.
The trueness of each balance was expressed through the relative error.
From the values of the measurements carried out in the repeatability assay, the standard deviation, the relative standard deviation and the coefficient of variation were
Experimental Part calculated. The repeatability of each balance was expressed through the coefficient of variation.
The drift assay was performed following the procedure below:
1. The balance was adjusted to zero and then the standard mass was weighed. The result of the measurement was registered in the form “Verification Form of the Balances” (see Figure 4).
2. The mass was left onto the weighing pan and the value of the measurement was read after 5 and 10 minutes.
In the drift assay, the drift value was calculated by subtracting the minimum value from the maximum value of the masses obtained.
Figure 4: Verification Form of Balances
All the calculations necessary for the verification assays of balances and analytical balances were encoded in an excel sheet prepared for this purpose and saved in a file
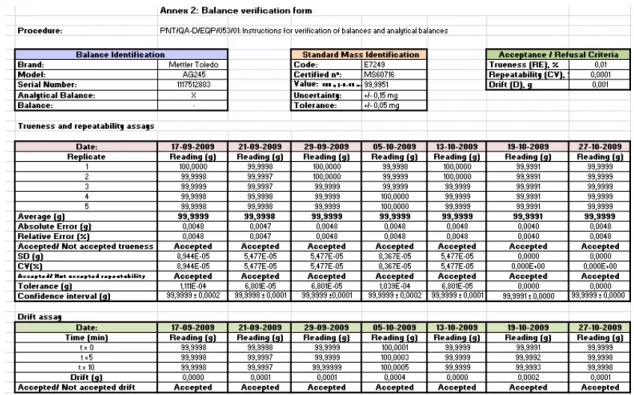
template called “Balance verification form”. Figure 5 shows an example of an excel sheet prepared for an analytical balance. This excel sheet includes the identification of the balance (brand, model, serial number and the type of the balance), the standard mass identification (code, number of the certificate, value of the mass, uncertainty and tolerance) and the acceptance /refusal criteria to compare against the obtained results and accordingly to decide if the equipment is or not suitable for use.
The excel sheets containing the calculations for the verification assays carried out for each balance can be found in Annex I, in the SOP coded as PNT/QA-D/EQP/053/01, as the example given in Figure 5.
Figure 5: Excel sheet for the calculations in the verification assays of an analytical balance
Verification notebooks for balances and analytical balances were prepared in order to register the values obtained in the verification assays. Figure 6 shows the cover page of the verification notebook for an analytical balance. This page includes the identification of the balance (brand, model and serial number), the number of the notebook, the beginning date (the date of the first register) and the final date (the date of the last register). All the verification notebooks prepared have this format page. These notebooks include the form “Verification Form of Balances” (see Figure 4).
Experimental Part
3.2. Performance Verification of High-Performance Liquid Chromatography
(HPLC)
The performance of two liquid chromatographs was verified. One of the chromatographs is used at the teaching laboratory by students. This equipment is an HP 1050 with UV/VIS detector. The other liquid chromatograph is used for research. The latter equipment is an Agilent 1100 with UV/VIS detector.
The performance of the Liquid Chromatograph was evaluated by examining the key functions of the various modules that are included in the system: pump, injector and UV/VIS detector.
Performance Verification of the Liquid Chromatograph HP 1050 with UV/VIS detector
A SOP containing instructions for the verification of the liquid chromatograph HP 1050 with UV/VIS detector was written. This document also includes the periodicities for the verification assays. This SOP was named as “Instructions for verification of the
liquid chromatograph with UV/VIS detector (HP 1050)”, coded as PNT/QA-D/EQP/055/01 and can be found in Annex II.
The verification of this equipment included the following assays: injector and flow rate precision, flow rate trueness, detector linearity, noise and drift, and gradient accuracy.
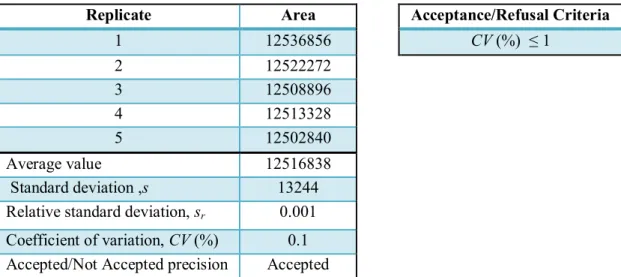
The injector precision and flow rate precision were evaluated using the same assay. In order to evaluate the ability of the injector to draw the same amount of sample in replicate injections (injector precision) and the ability of the pump to deliver a constant flow rate (flow rate precision), five replicate injections of 8.0 mg/L anthracene standard were performed. The average value, the standard deviation, the relative standard deviation and the coefficient of variation were calculated from the values obtained (peak area in the chromatograms) in the injector precision assay. The precision of the injector was evaluated through the coefficient of variation.
The calculations mentioned in the injector precision were also performed to evaluate the precision of the mobile phase flow rate but now using the retention times obtained in the chromatograms instead of peak area. The flow rate precision was also evaluated through the coefficient of variation of the retention time for the five replicate injections. The flow rate trueness assay was performed by setting the flow rate at 1.0 mL/min and using a stopwatch to measure the time that it takes to collect 10 mL of mobile phase from the pump into a 10 mL volumetric flask. The flow rate was calculated by taking the ratio of the volume of the mobile phase collected and the corresponding time. The trueness of the mobile phase flow rate was determined by calculating the relative error of the obtained volumetric flow rate.
The detector linearity assay was carried out by injecting standard solutions of anthracene in methanol with different concentrations (2.0 mg/L, 4.0 mg/L, 8.0 mg/L, 10.0 mg/L). The injected volume of each solution was The response of each injection (peak-area) was plotted against the corresponding concentration. The regression coefficient of the plot was used to assess the linearity of the detector.
A mobile phase of methanol and water (80:20) with a flow rate of 2 ml/min was used and a detection wavelength of 254 nm was selected to perform the verification assays described above.
It is fundamental to measure the noise of the detector since excessive noise can reduce the sensitivity of the detector affecting the quantification of low-level analytes
Experimental Part afterwards. Detector drift may affect the determination of the baseline and integration of peaks, so it is necessary to measure the drift of the detector. The measurements of the detector noise and drift were performed following a procedure indicatedin the operating manual of the equipment. The noise and drift assays were carried out with water flowing as mobile phase through the system at a rate of 1 ml/min. The wavelength of detection selected was 254 nm. In order to print the chromatogram that allows performing the noise and drift measurements, it is necessary to select adequate attenuation values in the integrator. The attenuation values to carry out both the noise measurement and drift measurement have been chosen in according to the suggestion given in the operating manual of the instrument. An attenuation value of -3 was chosen for noise measurement while an attenuation value of -1 was chosen for drift measurement. Noise data were acquired during 15 minutes on the other hand drift data were acquired during 20 minutes. The determination of the detector noise was performed using the mathematical expression (1) since the obtained scale in the integrator is in milivolts (mV), the noise measurement is obtained in millimeters (mm) and the detector noise level is expressed in absorbance units (AU).
C 2 1000 2AU B A (AU) Noise Where:
A = noise measurement in millimeters (mm)
B = complete voltage scale measured in millimeters (mm). For Integrators 3394/6 the complete scale is
150 mm.
C= attenuation (-3)
The term A, in the expression, was obtained by dividing the chromatographic baseline into 15 segments, each of 1 min- interval. The biggest vertical distance (Y-value) peak-to-peak, in each segment, was measured using a graduated ruler. This distance was obtained by drawing parallel lines between the highest and lowest data point (see figure 7, as example of this measurement). The average value was calculated from the Y-values and is termed as A. The noise value is expressed in absorbance units (AU).
(1)
Noise Level
The determination of the detector drift was determined using the following mathematical expression:
Where:
A = drift measurement in millimeters (mm)
B = complete voltage scale measured in millimeters (mm). For Integrators 3394/6 the complete scale is
150 mm.
C= attenuation (-1)
The term A was obtained by measuring the difference in the response between the end and the beginning of the chromatogram using a graduated ruler. This difference was measured by drawing a straight line (see Figure 8, as example of this measurement). The slope of the straight line gives the drift of the detector. The drift value calculated from the mathematical expression (2) was converted into absorbance units per hour (AU/h)
For gradient accuracy, the ability of the pump to deliver the mobile phase at different solvent strengths over the time by varying the composition of the mobile phase accurately is fundamental to get the adequate chromatographic separation and reproducibility. The gradient accuracy assay was performed using two different mobile phases (a mobile phase of methanol and water (80:20) and a mobile phase containing 0.5 % of acetone in methanol/water). The channel A contained the mobile phase of acetone in methanol/water and the channel B contained the mobile phase of methanol and water. The mobile phase of acetone in methanol /water was used as UV tracer. A gradient profile was set, in the chromatograph, in order to change (in a stepwise way)
C 2 1000 2AU B A min) 20 (AU/ Drift (2)
Experimental Part the composition of the mixture from 100% B to 100 % A and then changed back to 100 % B. The following was done to carry out to determine the gradient accuracy:
The absorbance change from 100 % B (baseline) to 100 A % was measured and expressed as height, H, in the plot of absorbance versus time. The height, H, was measured (using a graduated ruler, in centimeters) from the baseline until the maximum value of the heights in the obtained chromatogram (see Figure 9).
Figure 9: Gradient accuracy measurement performed for the HP 1050
Afterwards, the height of the gradient step in which the mobile phase composition was 90% A and 10% B was measured and the gradient composition was calculated using the following expression: Gradient composition (%) 100 (cm) H (cm) step gradient the of height Where:
H is the height when the composition of the mixture has 100% A and 0 % B.
The absolute error and the relative error were calculated and then the gradient accuracy was expressed as the relative error.
The gradient composition, the absolute error and relative error were determined for the remaining gradient steps in order to arrive at the corresponding gradient accuracy.
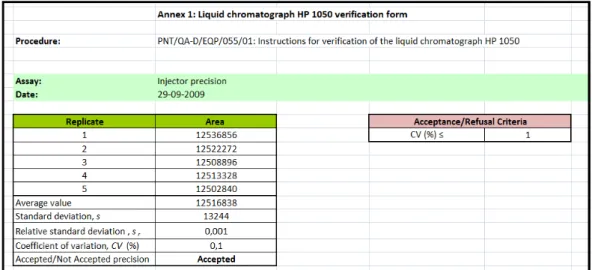
All the calculations necessary for the verification assays of the Liquid Chromatograph 1050 were processed using an excel sheet prepared for this purpose, a file template named as “Liquid Chromatograph HP 1050 Verification Form”, which can be found in Annex II, in the SOP coded as PNT/QA-D/EQP/055/01, as it can be seen in Figure 10.
Figure 10: Excel sheet for the calculations in the verification assays of the HP 1050
Performance Verification of the Liquid Chromatograph Agilent 1100 with UV/VIS detector
An SOP containing instructions for the verification of the liquid chromatograph Agilent 1100 with UV/VIS detector was written. This document also includes the periodicities for the verification assays. This SOP was named as “Instructions for the verification of the liquid chromatograph with UV/VIS detector (Agilent 1100)”, coded as PNT 0351000 APR/172 ED. 1 and it is included in Annex II.
The verification of this liquid chromatograph included the following assays: injector precision, flow rate precision, injector linearity and carryover, detector linearity, noise and drift, flow rate trueness and gradient accuracy.
In the verification of this instrument the same methodology as used for the liquid chromatograph HP 1050 was utilized for the injector precision, flow rate precision, detector linearity and flow rate trueness assays except that a flow rate of 1.0 ml/min instead of 2.0 ml/min was employed.
This equipment has an automatic injector which has the ability of varying the injection volume. Different volumes of sample are drawn into a sample injection loop
Experimental Part by a syringe. The uniformity of the sample loop and the ability of the syringe to draw different amounts of sample in the right proportion influence the linearity of the injection volume. The injector linearity is important when performing a method in which the use of variable injection volume is a requirement. The linearity of the injector
was tested by maki of an
anthracene standard solution with 8.0 mg/L of concentration. The response of each injection (peak-area) was plotted against the corresponding injection volume and the regression coefficient of the plot was used to assess the injector linearity.
Small amounts of analyte may get carried over from the sample injected before and lead to the contamination of the next sample to be injected. The carryover will affect the accuracy of the quantification of the next sample. The carryover assay was carried out by injecting a blank (methanol) after an anthracene standard solution (solution of anthracene dissolved in methanol) with a concentration of 8 mg/L. The level of carryover was determined by calculating the ratio between the responses (peaks-area) of the anthracene found in the methanol sample and the anthracene standard solution.
The detector noise and drift assays were done by making a run with the mobile phase of methanol and water flowing through the system at 1.0 mL/min during 20 minutes. After getting the noise registered, a short-term noise measurement was performed. For this measurement, the chromatographic baseline was divided into 20 segments, each of 1 minute interval. Parallel lines were drawn for each segment to enclose the peak-to-peak variation in signals (see Figure 11, as example of this measurement). The vertical distance (value) between the parallel lines in each segment was measured. The Y-values was divided by the number of segments in the measurement. The obtained value is the noise level of the detector and was expressed in absorbance units (AU).
min 2.5 5 7.5 10 12.5 15 17.5 20 22.5 mAU 0 200 400 600 800 1000 1200 1400
DAD1 A, Sig=254,4 Ref=360,100 (ALBA\091103000005.D)
Are a: 397 999 1 2.1 7 8 Are a: 39 7585 1 2.7 3 1
The drift (the trend of the signal) measurement was performed by measuring the difference in the response between the end and the beginning of the chromatogram, using a graduated ruler. This difference was measured by drawing a straight line (see Figure 8). The slope of the straight line gives the drift of the detector. This obtained slope is in centimetres and then was converted to AU/h using the obtained scale in units of absorbance.
The gradient accuracy assay was performed using the methodology applied to the gradient accuracy assay in the Liquid Chromatograph HP 1050, although a different measurement method was used to determine it. Half of the chromatogram (“half of the pyramid”) was integrated in order to obtain the area of halves of the chromatogram (see Figure 12).
Figure 12: Gradient accuracy measurement for the Agilent 1100
The gradient accuracy was calculated by taking the quotient of the difference of the two areas of the pyramid by the average of their areas. The gradient accuracy value was expressed in percentage.
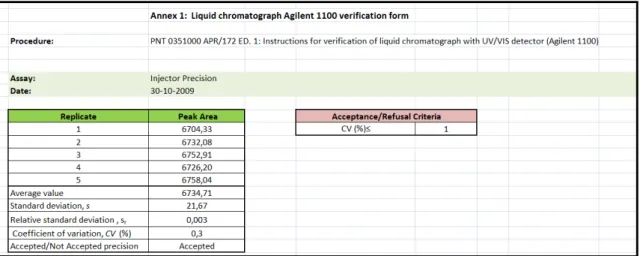
All the calculations necessary for the verification assays of this liquid chromatograph were carried out using an excel sheet prepared for this purpose and saved in a file template called “Liquid chromatograph Agilent 1100 verification form”, (see Figure 13) which can be found in Annex II in the SOP coded as PNT 0351000 APR/172 ED.
Experimental Part
Figure 13: Excel sheet for the calculations in the verification assays of the Agilent 1100
3.3. Liquid Chromatography Maintenance
A SOP containing the instructions for the cleaning and maintenance of the Liquid Chromatograph HP 1050 was written. This document was named as “Cleaning and Maintenance Instructions for the Liquid Chromatograph with UV/VIS Detector (HP1050) and coded as PNT/QA-D/EQP/054/01. This document was prepared based from the reference manual of the equipment. The maintenance and cleaning activities for this equipment include the following: cleaning of the tubes of the system, cleaning of the solvent inlet filters and helium sparging frits, changing the PTFE frit and the cleaning of the lower part pieces of the purge valve (ball and seat), cleaning and changing of the different parts of the pump, cleaning of the needle port manual injection valve, reforming of the needle seal of the manual injection valve, changing of the deuterium lamp and cleaning of the detector cell. All the procedures to carry out the maintenance activities mentioned above are described in the SOP coded as PNT/QA-D/EQP/054/01 which is included in Annex II. The periodicities of maintenance are included in this document.
3.4. Performance Verification of Gas Chromatography
A gas chromatograph with thermal conductivity detector (TCD) and another one with flame ionization detector (FID) were verified. For each gas chromatograph was written a SOP containing the instructions for its verification. The SOP for the gas chromatograph with TCD was named as “Instructions for Verification of the Gas Chromatograph with Thermal Conductivity Detector (TCD) – HP 5890 Series II”,