Escola de Engenharia Departamento de Inform´atica
Catarina Moreira Ribeiro
Assessment of microbial community
interactions using different tools
Escola de Engenharia Departamento de Inform´atica
Catarina Moreira Ribeiro
Assessment of microbial community
interactions using different tools
Master dissertation
Master Degree in Bioinformatics
Dissertation supervised by
Oscar Dias Ahmad Zeidan
T R A B A L H O P O R T E R C E I R O S
Este ´e um trabalho acad´emico que pode ser utilizado por terceiros desde que respeitadas as regras e boas pr´aticas internacionalmente aceites, no que concerne aos direitos de autor e direitos conexos.
Assim, o presente trabalho pode ser utilizado nos termos previstos na licenc¸a abaixo indicada. Caso o utilizador necessite de permiss˜ao para poder fazer um uso do trabalho em condic¸ ˜oes n˜ao previstas no licenciamento indicado, dever´a contactar o autor, atrav´es do Reposit ´oriUM da Universidade do Minho.
Licenc¸a concedida aos utilizadores deste trabalho
First of all, I would like to begin by saying that during this work I faced several challenges, which allowed me to develop myself, both on a professional and personal level and I am very grateful for everyone who took part in this chapter of my life.
To begin with, I would like express my gratitude towards my supervisors, for giving me the opportunity to study such an emergent field in systems biology. Specifically, I would like to thank Doctor Oscar Dias for introducing me to the Systems Biology field, for the availability to answer all questions and for all the given help through this work. Also, I would like to thank Doctor Ahmad Zeidan, for all the help during my stay in Denmark, for always helping me to face the challenges this work presented and for making me feel very welcome at Chr. Hansen A/S.
I would also like to acknowledge everyone I met in Denmark. Thank you to everyone at the company for creating such a fantastic work environment which made my experience much more special, I cannot imagine a better place to work at. Thank you to my roomie, Helle, for receiving me at your house, the higgiest place in Copenhagen!
The biggest thank you to my parents, ´Ilidia and Jos´e, without whom I would certainly not be here. Thank you for all the encouragement through my years of studying. Thank you to my sister, Marta, who is one of my biggest supporters and always knows what needs to be said.
A huge thank you to all my friends, specially to Cata, Chica, Costa, Dani, Diana, Mesquita and Nini, who grew up with me and were there through all moments of my life, including this one.
Last but not least, I have to thank my boyfriend Miguel, who was always there when I needed him, at any time of any day! Thank you for all the love and support, for all the laughs and for cheering me up when I need to. Thank you for your calming words when I am stressed up. This accomplishment would not have been possible without you.
I hereby declare having conducted this academic work with integrity. I confirm that I have not used plagiarism or any form of undue use of information or falsification of results along the process leading to its elaboration.
I further declare that I have fully acknowledged the Code of Ethical Conduct of the University of Minho.
Microbial communities participate in many biological processes, directly affecting its surrounding environment. Thus, the study of a community’s behaviour and interactions among its members can be very useful in the biotechnology, environmental and human health fields. Nevertheless, decoding the metabolic exchanges between microorganisms and community dynamics remains a challenge.
Computational modelling methods have gained interest as a way to unravel the inter-actions and behaviour. GSM models allow the prediction of an organism’s response to changes in genetic and environmental conditions. Thus, the extension of such method to a community level can help decode a community’s phenotype.
In this work, different GSM models and current bioinformatics tools were used to model the metabolism of different microbial communities. The different tools’ performances were compared to assess which is currently the best method to perform an analysis on a commu-nity level. Distinct case studies regarding microbial communities for which its interactions were already known, were selected. To assess the tools’ performances, each tools output was compared to what was expected in theory.
COBRA Toolbox's methods proved to be useful to build a community structure from individual GSM models, while pFBA and SteadyCom’s simulation methods can predict exchange between the organisms and the environment. Additionally, Dynamic Flux Bal-ance Analysis (dFBA) approaches, such as DFBAlab and DyMMM, can successfully simulate metabolite and biomass variation over time. Nevertheless, these methods are more limited as they require specific organism information, which is not always available.
Several GSM models are available for use. Nonetheless, their quality control has to gain attention as the simulations’ results are directly affected by the individual models accuracy to represent an organism’s metabolism. Thus, community model builders should carefully chose a GSM model, or combination of models before performing simulations.
Keywords: Microbial Community; Systems Biology; Genome-scale Metabolic Model; Community Modelling
Comunidades microbianas participam em in ´umeros processos biol ´ogicos, afetando dire-tamente o ambiente que as engloba. Assim, o estudo do comportamento de uma comu-nidade e interac¸ ˜oes entre os seus membros pode ser muito ´util nas ´areas da biotecnologia, ambiente e sa ´ude. No entanto, descodificar as trocas entre microganismos e a dinˆamica de comunidades continua um desafio.
M´etodos de modelac¸˜ao computacional tˆem ganho interesse como forma de desvendar tais interac¸ ˜oes e comportamento de comunidades. Modelos metab ´olicos `a escala gen ´omica permitem prever a resposta de um certo organismo a mudanc¸as gen´eticas e ambientais. Assim, a extens˜ao de tal m´etodo ao n´ıvel de comunidade pode ajudar a prever o fen ´otipo de uma certa comunidade.
No presente trabalho, diferentes modelos metab ´olicos `a escala gen ´omica e ferramentas bioinform´aticas foram utilizados para modelar o metabolismo de diferentes comunidades microbianas, comparando o desempenho destas ferramentas para avaliar qual o melhor m´etodo para an´alise ao n´ıvel da comunidade. Casos de estudo distintos, relativos a comu-nidades para as quais se conhecem as interac¸ ˜oes, foram selecionados. Por fim, para aferir o desempenho das ferramentas, os respetivos resultados foram comparados ao teoricamente esperado.
Os m´etodos da ferramenta COBRA Toolbox provaram ser ´uteis para construir a estrutura da comunidade, usando modelos metab ´olicos `a escala gen ´omica dos organismos individu-ais. Quanto a m´etodos de simulac¸˜ao, pFBA e SteadyCom s˜ao ´uteis para prever trocas entre os organismos e o ambiente que os envolve. Para al´em disso, abordagens dFBA, como DF-BAlab e DyMMM, podem simular a variac¸˜ao da concentrac¸˜ao de metabolitos e biomassa ao longo do tempo. No entanto, estes m´etodos apresentam limitac¸ ˜oes por requererem informac¸˜ao espec´ıfica ao organismo, que nem sempre se encontra dispon´ıvel.
V´arios modelos metab ´olicos `a escala gen ´omica est˜ao disponibilizados. No entanto, o con-trolo na qualidade destes tem que ganhar atenc¸˜ao, visto que os resultados das simulac¸ ˜oes s˜ao diretamente afetados pela sua precis˜ao na representac¸˜ao do metabolismo de um or-ganismo e consequentemente, da comunidade. Assim, para construir um modelo de co-munidades, ´e necess´aria uma selec¸˜ao cuidadosa dos modelos individuais a usar, antes de serem feitas simulac¸ ˜oes.
1 i n t r o d u c t i o n 1
1.1 Context and motivation 1
1.2 Goals 2
1.3 Structure of the document 2
2 s tat e o f t h e a r t 4
2.1 Background 4
2.2 Genome-scale metabolic models 7
2.2.1 Genome-scale metabolic models reconstruction 8
2.2.2 Microbial community models 12
2.3 Computational Tools 15
2.3.1 Single Organism Based Tools 15
2.3.2 Community Based Tools 17
3 m at e r i a l s a n d m e t h o d s 26 3.1 Software 26 3.2 Case studies 28 3.2.1 Case study A 29 3.2.2 Case study B 30 3.2.3 Case study C 33 3.2.4 Case study D 35 3.2.5 Case study E 36
3.2.6 Case Study F and G 38
3.3 Analyses 38
3.3.1 Constraint-Based Reconstruction and Analysis (COBRA) Toolbox 38
3.3.2 SteadyCom 39
3.3.3 micom 40
3.3.4 SMETANA 40
3.3.5 DFBAlab and DyMMM 41
3.4 Performance assessment 44 4 r e s u lt s a n d d i s c u s s i o n 45 4.1 Case Study A 45 4.1.1 Computational results 46 4.1.2 Performance assessment 48 4.2 Case Study B 49 4.2.1 Computational results 51 vi
4.2.2 Performance assessment 54 4.3 Case Study C 54 4.3.1 Computational Results 56 4.3.2 Performance assessment 60 4.4 Case Study D 61 4.4.1 Computational results 62 4.4.2 Performance assessment 65 4.5 Case Study E 65
4.6 Case Studies F and G 67
4.6.1 Computational results 67
4.6.2 Performance assessment 71
Figure 1 The reconstruction of a metabolic network is an iterative process. It begins by assessing information about the organism metabolism. Then, the reaction set is constructed manually curated and a stoichio-metric model arises. If its in silico predictions are in agreement with experimental values, the model is then applied to several ends. If in silico and experimental results are in disagreement, another iteration begins, where the process is repeated until results are satisfactory. Adapted from Rocha I., F¨orster J. and Nielsen (74) 8 Figure 2 The top-down approach of model reconstruction. A universal model is generated and manually curated. This is then used as a template for organism-specific model generation. Adapted from Machado et
al. (56) 17
Figure 3 Representation of a dynamic flux balance analysis. Initial substrate, product and biomass concentrations are introduced. The subset of fluxes for substrate uptake and secretion rates changes as the con-centration values are updated. For each change, a new objective function value is calculated. As a result, exchange values change continuously over time. Subsequently, available substrate and prod-uct concentration changes. Adapted from Henson et al. (37). 19 Figure 4 Schematic representation of the created community reactions. R1 and R2 represent the transport reaction connecting organism 1 and organism 2 to the common community compartment, respectively, and R3 the exchange reactions between the common compartment and the environment conditions to which the community is subject
to. 27
Figure 5 Amino acid production and consumption by the different strains. arg, lys, met and phe represent L-arginine, L-lysine, L-methionine and L-phenylalanine, respectively. Adapted from (8). 30 Figure 6 B. caccae and LGG interactions when growing together on DMEM 6429medium supplemented with arabinogalactan. 50 Figure 7 L. bulgaricus and S. thermophilus interactions when growing together
on milk. 55
Figure 8 B. adolescentis and F. prausnitzii interactions when growing together
on glucose. 61
Figure 9 Dynamic Flux Balance Analysis laboratory (DFBAlab)’s predictions re-garding metabolite, E. coli ZSC113 and S. cerevisiae’s (yeast) biomass
variation over time. 68
Figure 10 DFBAlab ’s predictions regarding metabolite, wild-type E. coli and S. cerevisiae’s (yeast) biomass variation over time. 68 Figure 11 Dynamic Multispecies Metabolic Modeling (DyMMM)’s predictions re-garding metabolite concentration (mmol), E. coli ZSC113 and S. cere-visiae’s (yeast) biomass (g/L) variation over time (h). 70 Figure 12 DyMMM’s predictions regarding metabolite concentration (mmol), wild-type E. coli and S. cerevisiae’s (yeast) biomass (g/L) variation
Table 1 The six main effector and target microorganism interactions. 6 Table 2 Tools and causes leading to the abdication of their usage during this works’ timeline. Even though some tools were described in publica-tions, they were not available for download. Community Flux Balance Analysis (cFBA), which runs in Python 2, requires the usage of pack-ages with compatability issues. µbialSim’s usage was discarded as
errors were arising during its usage. 26
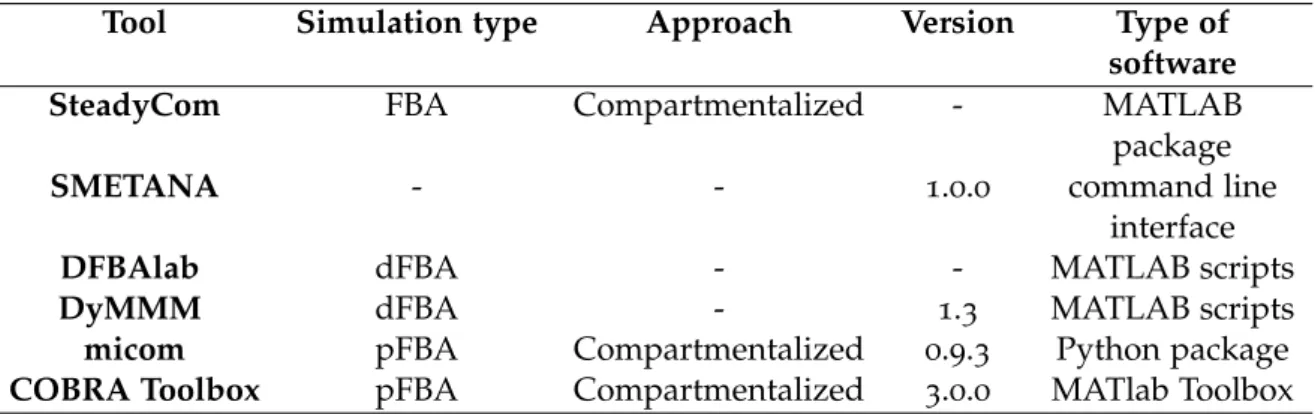
Table 3 Description of the used tools. Information regarding the algorithm a tool uses to perform simulations, the used approach to build the community; the used versions and what type of software the tool is based on. Species Metabolic Interaction Analysis (SMETANA) does not perform simulations nor builds the community. Thus, information
regarding such aspects is null. 27
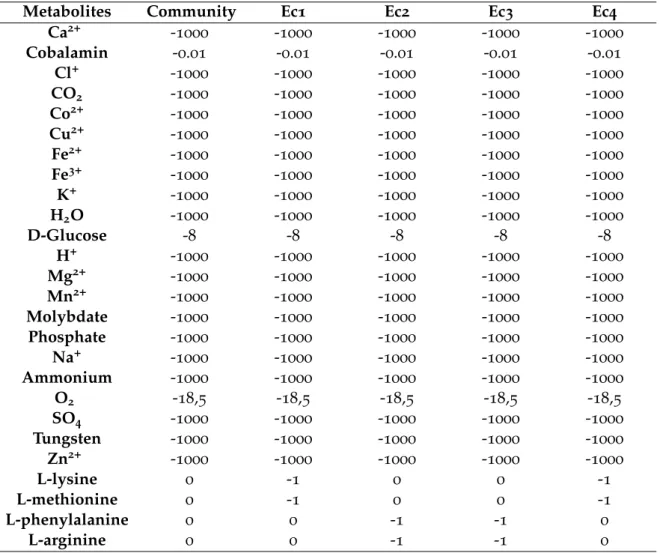
Table 4 Community lower bounds’ constraints (mmol/gDW/h) to simulate the desired environmental conditions. Ec1, Ec2, Ec3 and Ec4 repre-sent the four E. coli strains. The limit of intake is defined by negative values and export limits are defined by positive values. 31 Table 5 Reactions which lower and upper-bounds values were constrained to 0mmol/gDW/h, in order to simulate the desired mutations. DAPDC is essential for lysine biosynthesis, ARGSL for arginine’s, HSST for methionine’s and PPNDH for phenylalanine’s. METt3pp is the trans-port reaction for methionine, PHEt2rpp for phenylalanine, LYSt3pp
for lysine and ARGt3pp for arginine 31
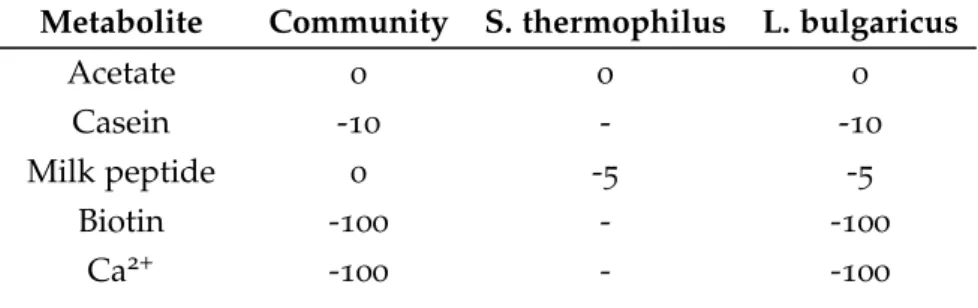
Table 6 Applied environmental conditions, by constraining the lower bounds (mmol/gDW/h) of the community’s exchange reactions and inter-nal transport reactions connecting B. cacce and LGG to the common compartment. The limit of intake is defined by negative values and export limits are defined by positive values. 31 Table 7 Environmental conditions applied, by constraining the lower bounds (mmol/gDW/h) of the community’s exchange reactions and internal transport reactions connecting S. thermophilus and L. bulgaricus to the common compartment. The limit of intake is defined by negative values and export limits are defined by positive values. 34
Table 8 Used lower bounds’ constraints (mmol/gDW/h) to constrain D. vul-garis and M. maripaludis individual uptake reactions. The limit of intake is defined by negative values and export limits are defined by
positive values. 37
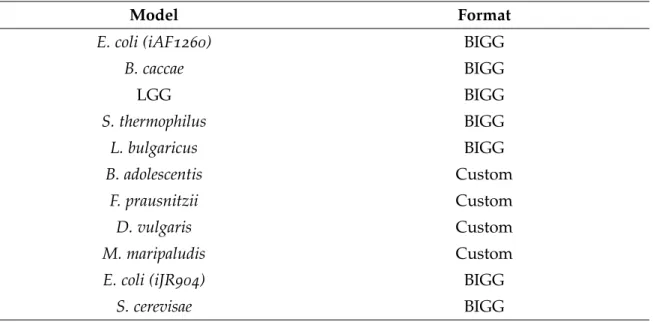
Table 9 Used organisms and the respective genome-scale file Systems Biology
Markup Language (SBML) format in SMETANA. 41
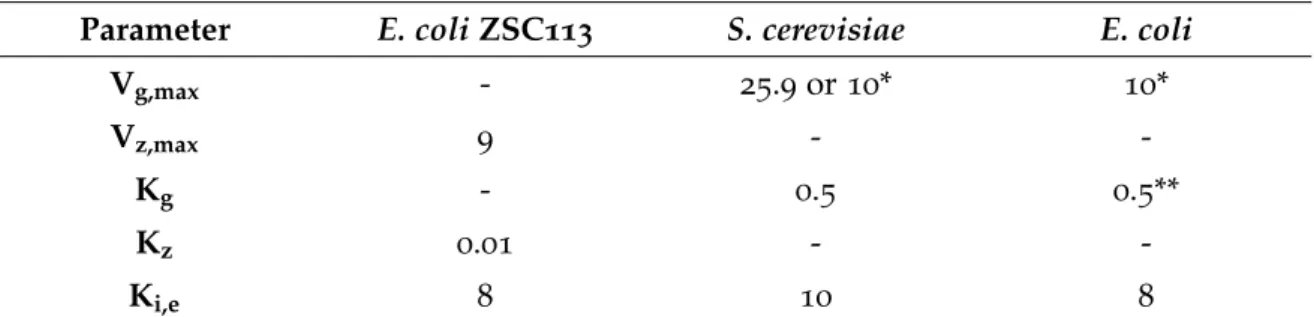
Table 10 Uptake parameters used to simulate the dynamic model for both case studies. vg,maxand vz,max(mmol/gdw/h) are the maximum up-take rates for glucose, and xylose. Kgand Kzare saturation constants for glucose and xylose. Ki,e (g/L) represents the ethanol inhibition
constant. 44
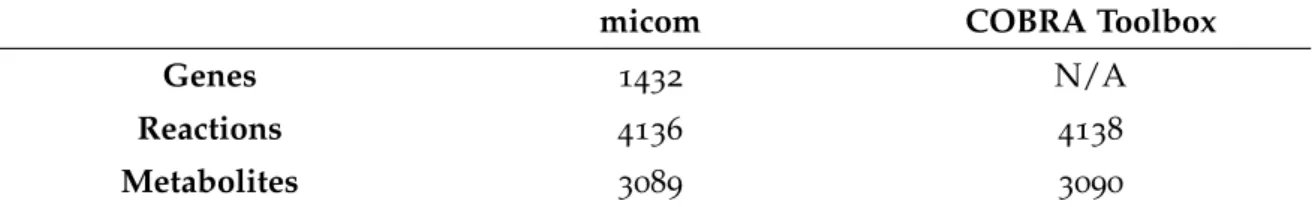
Table 11 Topological information regarding the community models created for the four E. coli’s case study. Both micom and COBRA Toolbox were used. The number of genes is not available (N/A) in the
CO-BRA Toolbox’s model format. 46
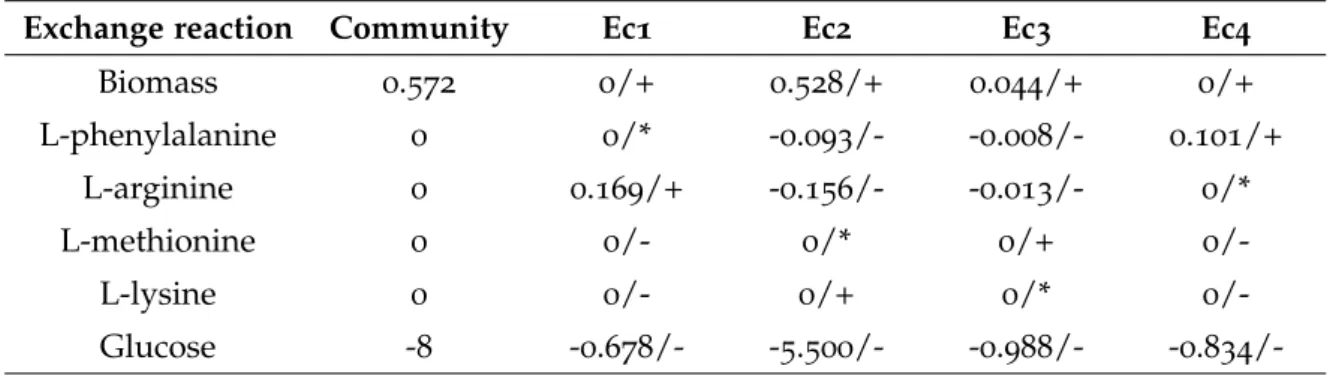
Table 12 Results regarding a parsimonious Flux Balance Analysis (pFBA) per-formed in MATlab, for a community composed of four E. coli mutant strains (Ec1, Ec2, Ec3 and Ec4). Community and individual biomass formation rates (h-1) are described, in addition to the studied amino acids and glucose production/consumption rates (mmol/gDW/h). A negative flux represents consumption of the metabolite, while a positive flux its production. For each flux, + and - represent ex-pected secretion and consumption of the metabolite, respectively; * represents an expected reaction flux of 0 mmol/gDW/h. N/A repre-sents the lack of the reaction in the respective Genome-scale Metabolic
(GSM) model. 46
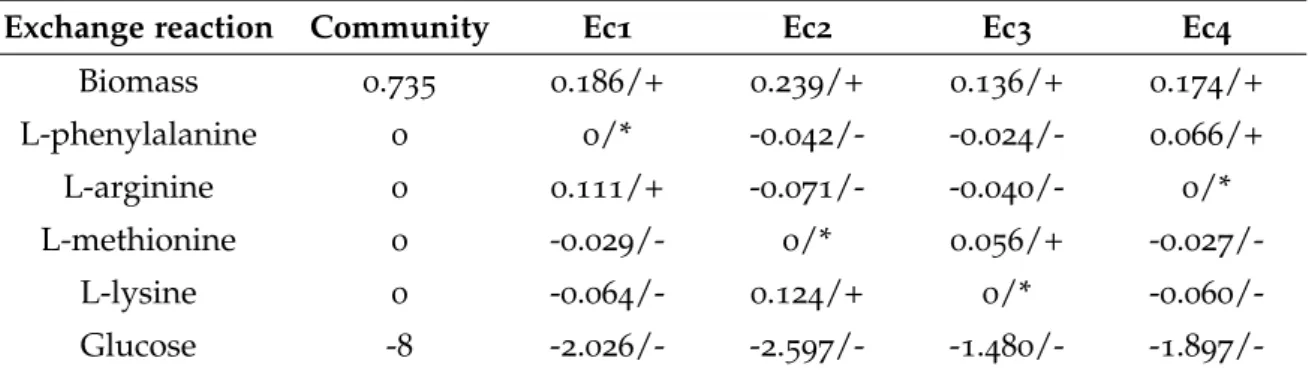
Table 13 SteadyCom simulation results regarding a community composed of four E. coli mutant strains (Ec1, Ec2, Ec3, Ec4). Community and individual biomass formation rates (h-1) are described, in addition to the studied amino acids and glucose production/consumption rates (mmol/gDW/h). A negative flux represents consumption of the metabolite, while a positive flux represents its production. 47 Table 14 Topological information regarding the LGG and B. caccae’s commu-nity models created with micom or COBRA toolbox functions. N/A
Table 15 pFBA simulation results for B. caccae and LGG’s community, per-formed using COBRA Toolbox’s model. Results regarding biomass formation (h-1), L-alanine, arabinogalactan, glucose, acetate and lac-tate exchange fluxes (mmol/gDw/h) in the community are consid-ered. A negative flux represents consumption of the metabolite and a positive flux represents its production. For each flux, + and - repre-sent expected secretion and consumption of the metabolite, respec-tively; * represents an expected reaction flux of 0 mmol/gDW/h. N/A represents the lack of the reaction in the respective GSM model. 51 Table 16 pFBA simulations for B. caccae and LGG, performed using micom’s
community model. Results regarding biomass formation (h-1), L-alanine, arabinogalactan, glucose, acetate and lactate exchange fluxes (mmol/gDw/h) in the community are described. A negative flux represents consumption of the metabolite and a positive flux rep-resents its production. For each flux, + and - represent expected secretion and consumption of the metabolite, respectively; * repre-sents an expected reaction flux of 0 mmol/gDW/h. N/A reprerepre-sents the lack of the reaction in the respective GSM model. 52 Table 17 Metrics calculated by the SMETANA’s framework. Receiver is the organism who benefits from the production of a specific Metabolite from another organism in the community, the Donor. SMETANA is a score that indicates how feasible the interaction is. Its value varies
between 0 and 1. 53
Table 18 Topological analysis of the S. thermophilus and L. bulgaricus com-munity models created with micom and COBRA toolbox functions.
N/A represents non-available information. 55
Table 19 pFBA simulation results, regarding the S. thermophilus and L. bulgar-icus’s community model created using COBRA Toolbox. Results re-garding biomass formation (h-1), casein, milk peptide, lactose, galac-tose, lactate and formate’s exchange fluxes (mmol/gDw/h) in the community are described. A negative flux represents consumption of the metabolite and a positive flux represents its production. For each flux, + and - represent expected secretion and consumption of the metabolite, respectively; * represents an expected reaction flux of
Table 20 pFBA simulation results, regarding the S. thermophilus and L. bul-garicus’s community model created using micom. Results regarding biomass formation (h-1), casein, milk peptide, lactose, galactose, lac-tate, acetate and formate’s exchange fluxes (mmol/gDw/h) in the community are described. A negative flux represents consumption of the metabolite and a positive flux represents its production. For each flux, + and - represent expected secretion and consumption of the metabolite, respectively; * represents an expected reaction flux of
0mmol/gDW/h. 59
Table 21 SMETANA’s metrics for the L. bulgaricus and S. thermophilus’ com-munity. Receiver is the organism who benefits from the production of a specific Metabolite from another organism in the community, the Donor. SMETANA is a score that indicates how feasible the interac-tion is. It varies from 0 to 1, where 0 represents no interacinterac-tion and 1
represents a mandatory interaction. 60
Table 22 Topological information regading the B. adolescentis and F. prausnitzii community models, created with micom and COBRA toolbox func-tions. N/A represents non-available information. 62 Table 23 pFBA simulation results for B. adolescentis and F.prausnitzii’s commu-nity, performed in MATlab. The present results describe biomass formation (h-1) and metabolites exchanges rates (mmol/gDw/h). Acetate, ethanol, butyrate, formate and glucose are considered. A negative value represents consumption of a metabolite and a posi-tive value represents its production. For each flux, + and - represent expected secretion and consumption of the metabolite, respectively; * represents an expected reaction flux of 0 mmol/gDW/h. N/A rep-resents the lack of the reaction in the respective GSM model. 63 Table 24 pFBA simulations for B. adolescentis and F. prausnitzii’s community, performed using micom’s model. Results regarding biomass forma-tion (h-1) acetate, ethanol, butyrate, formate and glucose exchange rates (mmol/gDw/h) in the community are presented. A negative rate represents consumption of a metabolite and a positive flux rep-resents production. For each flux, + and - represent expected secre-tion and consumpsecre-tion of the metabolite, respectively; * represents an expected reaction flux of 0 mmol/gDW/h. N/A represents the lack of the reaction in the respective GSM model. 64
Table 25 pFBA simulation results for D. vulgaris and M. maripaludis’ commu-nity. Results regarding, biomass exchange (h-1), lactate, acetate, CO2, H2, formate and methane exchange rates (mmol/gDw/h) are pre-sented. A negative value represents consumption of a metabolite while a positive represents production. For each flux, + and - repre-sent expected secretion and consumption of the metabolite, respec-tively; * represents an expected reaction flux of 0 mmol/gDW/h. N/A represents the lack of the reaction in the respective GSM model. 66 Table 26 SMETANA’s metrics for E. coli and S. cerevisiae co.culture. Receiver is
the organism who benefits from the production of a specific Metabo-lite from another organism in the community, the Donor. SMETANA is a score that indicates how feasible the interaction is. It varies from 0to 1, where 0 represents no interaction and 1 represents a
B
BIGG Biochemical, Genetic and Genomic. C
CFBA Community Flux Balance Analysis. COA Coenzyme A.
COBRA Constraint-Based Reconstruction and Analysis. D
DFBA Dynamic Flux Balance Analysis.
DFBALAB Dynamic Flux Balance Analysis laboratory. DYMMM Dynamic Multispecies Metabolic Modeling. E
EC Enzyme Commission. F
FBA Flux Balance Analysis. FVA Flux Variability Analysis. G
GSM Genome-scale Metabolic. I
IBM Individual-based Model. ID Identifier.
K
KEGG Kyoto Encyclopedia of Genes and Genomes.
L
LDH Lactate Dehydrogenase. LP Linear Programming. M
MIP Metabolic Interaction Potential. MRO Metabolic Resource Overlap.
MTHFC Methenyltetrahydrofolate Cyclohydrolase.
O
ODE Ordinary Differential Equation. P
PFBA parsimonious Flux Balance Analysis. PFL Pyruvate-formate Lyase.
PLM Population-level Model.
S
SBML Systems Biology Markup Language. SMETANA Species Metabolic Interaction Analysis.
1
I N T R O D U C T I O NThis dissertation was developed in the context of the Masters in Bioinformatics, assured by Centre of Biological Engineering and Department of Informatics at University of Minho, and Chr. Hansen A/S.
The context and motivation, goals and the structure of the current work are described in the present chapter.
1.1 c o n t e x t a n d m o t i vat i o n
Microbial environments are commonly described by microbial communities and their interactions (99). Understanding such interactions can be useful for several practical ap-plications (59). For instance, food fermentation processes are not usually carried out by a single strain, but a complex mixture of lactic acid bacteria (89). Thus, characteristics such as flavor or texture of the final food product are directly affected by culture functions and the metabolic interactions of the community members (71), making the study of such aspects of extreme economical value.
The emergence of high-throughput technologies led to a fast increase of fully sequenced genomes and systems biology assumes nowadays a leading role in biological sciences, as there is a clear need to decode all the information available (11; 78).
GSM network reconstructions can be obtained by combining genome sequence informa-tion with biochemical knowledge, resulting in a model containing detailed descripinforma-tions of all biochemical reactions, metabolites and genes for a specific organism, acting as a tool to predict an organism’s response to changes in genetic and environmental conditions (78). This approach is gaining attention as a promising way to understand interactions in micro-bial communities, whether competitive, mutualistic, commensal, or others.
Microbial interactions depend on the potential of each species and the nutrients available (8; 57; 99). Thus, the usage of systems biology approaches allows the understanding of how different species interact and affect the environment surrounding them.
Different tools and methods have been developed to aid the study of such microbial communities. Thus, frameworks such as SteadyCom (8), for predicting a stable
nity composition; OptCom (99), a comprehensive Flux Balance Analysis (FBA) framework for microbial communities; modelling approaches such as SMETANA (95); and dynamic modelling frameworks such as DFBAlab (26) and DyMMM (97) can be helpful for under-standing the interaction between modeled species and the dynamics of a community.
In this project, we will use GSM models and apply community modeling techniques to simulate and study interspecies interactions.
1.2 g oa l s
The main goal of this work is analyzing different tools’ performances in regards to the prediction of interactions between different species, using genome-scale metabolic models.
Thus, the process to achieve such goal is described by the following steps: • Selection of different case studies regarding known interspecies interactions; • Creation of the community models using different tools;
• Simulation of interactions using different methods; • Analysis of the obtained results;
• Performance assessment of the different tools.
1.3 s t r u c t u r e o f t h e d o c u m e n t
This document has the following structure: • Chapter 2: State-of-the-art
– Description of the GSM model reconstruction process
– Overview of methodologies used in microbial communities analysis – Single organism and community based computational tools
• Chapter 3: Materials and Methods
– Case studies and respective GSM models; – Software and tools;
– Definition of case studies’ environmental conditions; – Analysis using different tools;
– Comparison of the different tools performances. • Chapter 4: Results and Discussion
– Results obtained regarding the different community models’ structures, for each case study;
– The different tools’ performance, for each case study. • Chapter 5: Conclusion
– The best method to build a community model;
– The best method to run simulations for community models; – Future work;
2
S TAT E O F T H E A R TThe following chapter provides state-of-the-art methods on microbial community analy-ses. Specifically, the process to reconstruct an individual GSM model and a microbial com-munity model and individual and comcom-munity-based computational tools are described.
2.1 b a c k g r o u n d
Systems biology encompasses the quantification of cell components and analyses the interactions between them. Thus, it aims at predicting the whole-cell behavior through computer simulations of biochemical models (11).
Whole-genome high-throughput sequencing techniques allowed the whole-genome se-quencing of several organisms. From the genome sequence it is possible to identify gene products involved in biological processes. Thus, genomics arised as a field in which gene functions are determined (11).
As a genome does not change significantly over time, other omics emerged in the effort to identify and characterize additional cellular components, which regulate the expression lev-els of genes. These include proteomics, transcriptomics and metabolomics, which provide information regarding the physiological state of the system (11).
Genome-scale metabolic models have become an important tool in systems biology, as these allow decoding information of the increasingly higher number of fully sequenced genomes. Haemophilus influenzae was the first organism to have its complete genome se-quenced, and one of the first genome-scale reconstructions in systems biology as well (18).
Over time, progress has been achieved and modelling has transitioned from highly char-acterized organisms, such as Escherichia coli and Saccharomyces cerevisiae, to species with less information and characterization, which are of extreme importance to specific applications. As an example, study of pathogens allows the development of new strategies in metabolic engineering and facilitates patient treatment (47).
Efforts in automating the model reconstruction process have been made, as it is faster to obtain a new genome sequence than reconstructing its GSM model. These advancements,
in bioinformatics tools and algorithms, allowed the reconstruction of GSM models of less-characterized organisms (47).
Recently, the Assembly of Gut Organisms through Reconstruction and analysis (AGORA) resource presented 773 genome-scale metabolic reconstructions for human gut microbes (57). Approaches such as these, are a starting point of high-quality reconstructions.
It is well known that bacteria and microorganisms cohabit in dense, surface-associated communities with several species and strains (62; 94). Thus, members of the consortium affect each other by establishing different metabolic interactions (84). Such interactions play an important role in biotechnology, environment, human health and food industry as they have applications with great commercial value (27).
An effort to extend individual modeling techniques to community-level modeling has been made (94). In general, a model of metabolic interactions of microbes in co-culture accounts the metabolites that can be exchanged (91). Thus, constraint-based stoichiometric modelling in microbial communities is more complex than single organism modelling as both the exchange of metabolites and the biomass abundance of each organism have to be considered. Additionally, there are some challenges such as isolating individual members from the consortium and having poorly characterized species (37; 46).
There are few studies combining experimental and microbial communities metabolic models data (30). Stolyar and coworkers, performed the first study regarding a multispecies metabolic model and compared the results to experimental data on growth of a co-culture of methanogenic bacteria (88). To the date, purely computational studies have been con-ducted to determine the potential of a community's interactions, calculate biomass ratios and fluxes under balanced growth conditions of microbial communities (46) or designed medium compositions that enforce metabolic interactions (49).
In food fermentation, community-level modelling provides phenotype predictions of individual-strain and the community as a whole. Furthermore, community models’ ability to identify metabolic interactions between the community members is its most significant benefit (94). As an example, flavor compounds production can be optimized.
Computational studies can be used to investigate the potential interactions in a com-munity, such as competition, cross-feeding, syntrophy and mutualism (37; 88). Originally, the primary focus of such studies was mostly the prediction of a community phenotype. Currently, these are used to infer metabolic exchange fluxes between microorganisms from experimental data (30). For instance, the characterization of interactions between gut micro-biota and their interactions with diet and their host is important application of community-level models (94).
Community interactions are quantified by combining experimental data, regarding metabo-lite concentrations and specific growth rates, with stoichiometric metabolic models (30).
Although the medium composition determines the growth potential of an organism, on a community level, other members’ metabolic capabilities will affect the metabolism and growth of another particular species (27). There are three categories of effects that organ-isms cause on each other: positive, negative and neutral. These can then be classified as different interactions: mutualism, parasitism, competition, commensalism, amensalism and neutralism (83), as shown in Table 1 .
Table 1: The six main effector and target microorganism interactions.
Effect on target Effect on effector
Beneficial Detrimental Neutral
Beneficial Mutualism Commensalism
Detrimental Parasitism Competition Amensalism
Neutral Neutralism
Mutualism is a common interaction in microbial communities where two or more species provide benefit to one another, creating a dependency (83; 88). It is important to note that, although similar, it is different from commensalism, in which one organism benefits from the interaction but the other is not particularly affected. On the opposite side, parasitism arises from one species benefiting at the expense of another (84).
Amensalism is when an organism negatively affects the other without being affected itself. Such can happen when products from primary metabolism (e.g. alcohols) inhibit the growth of the other consortium individuals (84).
When both organisms suffer a negative effect from the interaction, there is competition. In fermentation, it is common to find microbes competing for energy sources and nutrients (e.g. competing for free amino acids in milk fermentation) (84).
Finally, when each organism can sustain growth without cross-feeding, the interaction is called neutralism. This kind of interaction can potentially lead to competition since the same resources could be consumed by both species (49; 61).
When studying microbial communities, it is important to consider the phylogenetic dis-tance between the interacting species (62; 95). For insdis-tance, considering a clonal group of cells, cooperative behavior is expected. Natural selection is expected to favor phenotypes that maximize the overall survival and reproduction of the genotype. However, cooperation is not guaranteed as loss-of-function mutations can occur at the loci driving the cooperative trait (62).
In Zeidan et al. (2010), an altruistic cooperation interaction was proposed. This is char-acterized by an individual species passing on its genes to the next generation indirectly, by aiding a closely related species to reproduce. Altruistic traits are visible in cases in which a specific cell is harmed to promote reproduction of other group members (62). However,
the precise mechanism for this interaction and the nature of the involved molecules, are yet not fully understood (62; 94).
Among different genotypes, the ecology of a system should also be taken into consid-eration. For instance, the overlap in metabolite intake in the niche indicates the degree of competition (95). Thus, if the number of metabolites that both organisms consume si-multaneously is high, it creates an overlap that implies strong competition for nutritional resources. Additionally, when a certain species is harmful to another, by consuming its nutritional resources, the second might increase competitiveness in return (61).
2.2 g e n o m e-scale metabolic models
The development of the high-throughput technologies generated bulk loads of informa-tion, which facilitates the study of cells metabolism (63). With the availability of whole-genome sequences and information regarding biochemical reactions in several biological databases, GSM networks can be generated (11). These networks represent a set of bio-logical reactions retrieved from enzymes encoded in the organisms genome. Thus, GSM networks describe reactions and the relations between them.
Even though GSM networks can represent some of the cell’s physiological and biochem-ical properties, GSM models allow predicting the metabolic capabilities of the biologbiochem-ical system. These models include energetic needs and biomass composition specificities, in addition to the network data (11). However, it is important to note that these networks do not consider enzyme kinetic information (46; 65). Kinetic modelling is used on a pathway scale rather than a genome scale. It models reaction fluxes and metabolite concentration as a function of time, thus requiring more information (85). As there is a lack of such information for the majority of the sequenced organisms, the usage of these models at a genome-scale has been held back (74).
GSM models are widely used in biotechnology and medicine (46; 56) as these contain most metabolic reactions of an organism, associated to genes encoding enzymes that cat-alyze such reactions, thus proving to be very powerful tools. As a result, these models are currently used, in silico, to identify possible drug targets and predict the microorganisms response to gene knockouts or nutritional changes (11).
An increase in the number of available GSM models is visible, as a consequence of the availability of tools that automate such process. Nevertheless, the lack of quality in such models can compromise its usage. Thus, the quality and accurate predictions should be priorities, and efforts in this topic are being performed (47).
2.2.1 Genome-scale metabolic models reconstruction
Several works, representing the bottom-up and top-down approaches to reconstruct a metabolic model, have been published (11), the first being the most common (56).
The bottom-up reconstruction approach begins by associating metabolic functions to the respective genes through means of genome annotation. From there on it is necessary to collect a set of biochemical reactions from a reaction database, such as Kyoto Encyclopedia of Genes and Genomes (KEGG) (44). As a result, a draft metabolic network is assembled and subsequently improved by manual curation procedures (56).
As previously stated, there is the alternative top-down approach. It begins by reconstruct-ing a universal model, which is manually curated and includes import/export reactions and a universal biomass equation. Then, the universal model is adapted to an organism, by removing reactions and metabolites that are not predicted to be in the organism (56).
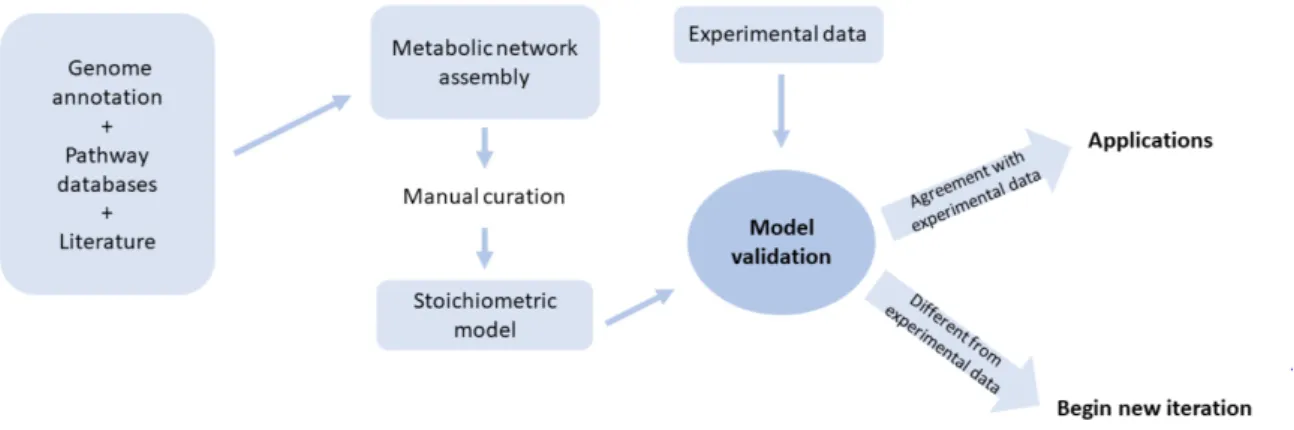
The process of reconstructing a model (Figure 1) is a laborious task. Four main stages constitute the process herein described, specifically genome annotation, metabolic network assembly, conversion of the network to a stoichiometric model and the validation of the metabolic model (11).
Figure 1: The reconstruction of a metabolic network is an iterative process. It begins by assessing in-formation about the organism metabolism. Then, the reaction set is constructed manually curated and a stoichiometric model arises. If its in silico predictions are in agreement with experimental values, the model is then applied to several ends. If in silico and experimental results are in disagreement, another iteration begins, where the process is repeated until results are satisfactory. Adapted from Rocha I., F¨orster J. and Nielsen (74)
2.2.1.1 Genome Annotation
The start of a GSM model reconstruction consists in the genome annotation, which is the assignment of functions to genes (90). Whole genome annotations can be downloaded
from online databases such as NCBI (77) or KEGG (44). However, such annotations must be reliable and updated. When annotations are not available, sequence alignment algorithms such as Basic Local Alignement Search Tool (BLAST) (1) or HMMER (17) should be used.
Notice that genes encoding enzymes or transport systems are labeled as metabolic genes and subunits of protein complexes should be identified, as several genes may be required to encode an enzyme. Enzymes’ information can be retrieved from curated databases such as BRENDA (42), where Enzyme Commission (EC) numbers and other metabolic items can be retrieved. Gene ontology (GO) information can also be used to find enzymes (90). Finally, biochemical reaction databases, such as KEGG (44), can be used to combine EC numbers with metabolic reactions.
After collecting the candidate metabolic genes and their potential reactions, the draft reconstruction can be assembled (90).
2.2.1.2 Assembling the Metabolic Network
This is the longest part of the reconstruction, due to extensive manual curation. Genes and reactions should be individually analysed and compared with organism-specific data, as organism-unspecific reactions can affect the predictive capacity of the model. If such information is not available in literature, phylogenetic close organisms can be considered.
Firstly, the network assembly starts by collecting information regarding transport systems and reactions catalyzed by enzymes encoded in the annotated genome. Genes-protein-reactions (GPR) associations are performed by analyzing literature and biological databases. Additionally, spontaneous and non-enzymatic reactions, available in KEGG or published literature, should be included in the network. After collecting the reactions, stoichiometry should be reexamined.
Subsequently, network reactions should be compartmentalized, assigning reactions to the organelles where these take place. Based on amino acid sequences and physiological characteristics of the organism, tools such as PSORTb (93), TargetP (20), LocTree3 (25), among others, can be used to predict subcellular localization.
Note that organism complexity affects results, as prokaryotic organisms are usually char-acterized by extracellular space, cytoplasm and periplasmatic space, whereas eukaryotic cells are complex and have several organelles. In higher eukaryotes, different tissues may also be considered.
Finally, as automatic methods are prone to missing information and to generate errors, manual curation should be performed. Reactions should be revised to correctly represent organisms specificities in literature and organism-specific databases. Likewise, reactions reversibility should also be assessed, and can be estimated from the Gibbs free energy of formation and of reaction (24; 90). Manual curation also addresses the following issues:
• Adding new organism-specific reactions;
• Assessing the reactions assigned to ambiguous identifiers, such as incomplete EC numbers (28).
Comparative genomics can be used to accelerate the process of reconstructing a GSM model. The draft network is compared with curated models from closely related organisms, known biological pathways or a combination of both. Moreover, gap finding and gap-filling of missing reactions in the network has to be performed. These gaps refer to missing reactions which would result in the accumulation of produced products and in the arrest of the pathway’s flux (11).
Additionally, organisms may differ in cofactors usage and directionality of certain reac-tions. Hence, organism-specific biochemical studies and organism-specific databases such as EcoCyc (45) can be used to find such information.
2.2.1.3 Conversion from Metabolic Network to Stoichiometric Model
This stage starts with the conversion of the network into a stoichiometric matrix. The co-efficients of each reaction are represented in a matrix and constraints representing reaction limits are added to the model (11; 65).
A biomass formation equation should be included in the GSM model’s reactions set. This equation, which represents all macromolecules and building blocks that establish the biomass, is necessary to simulate the growth rate (h-1) of the desired organism and can be represented as below:
p
∑
k=1
ck.Xk →biomass (1)
Where ckrepresents the coefficient of the metabolite Xk.
Such reaction is important for in silico simulations and its accuracy depends on retrieving information specific to the organism. Thus, the biomass composition should be determined experimentally (4; 38; 41), or estimated using organism-specific literature. When such infor-mation is unavailable, phylogenetically close organisms can be used (11).
The model is not complete without including energy requirements, both growth or non-growth associated (90). The first covers several cellular processes, for instance amino acid, protein and nucleotides polymerization. The latter, refers to non-growth ATP requirements of the cell to survive (90).
Chemical engineering principles are used to represent the behavior of metabolites concen-tration. Thus, each metabolite has a respective Ordinary Differential Equation (ODE) within the metabolic network, in which its stoichiometry along the reactions set is considered (11; 74).
The following equation represents the variation of a metabolite concentration over time: dXi dt = N
∑
j=0 Sij.vj+µX, i=1, ..., M (2)Where Xi is the metabolite i concentration, vj is the metabolic flux of reaction j, Sijis the stoichiometric coefficient of metabolite i in reaction j and µX is the system’s growth rate.
As there is an impossibility to collect and estimate kinetic rates and parameters from an organism’s genome, a steady-state approach is used. Accordingly, mass balance con-straints are applied, in which the total amount of any compound being produced equals the consumption, resulting in the following equation:
S.v=0 (3)
where S is the sparse matrix where each row represents an unique metabolite and each column a reaction, and v is a vector that represents the flux through all the reactions.
As most metabolic networks are undetermined systems and the number of fluxes is greater than the number of mass balance constraints, an infinite number of solutions may satisfy the mass balance constraints. Therefore, the establishment of these constraints can reduce the null space of S to a series of solutions, the flux cone of solutions.
Furthermore, reversibility and directionality define the stoichiometric matrix’s constraints. Hence, upper and lower bounds are set as model constraints for specific reactions as they impose a maximum or minimum desirable reaction fluxes (65; 70). The following inequality represents these constraints:
βj ≥vj ≥αj, j=1, ...N (4)
Where
• bj is the upper bound • aj is the lower bound • vj is the flux vector
Finally, the resulting representation of the mathematical model should be exported in a standard universal format such as the SBML (40).
2.2.1.4 Metabolic Model Validation
The last stage of the reconstruction relies on comparison between experimental data and the in silico prediction. Thus, the assessment of information regarding physiology, biochem-istry and genetics of the target organism is necessary to improve the model’s predictive capabilities.
This is an iterative process and when predictions and experimental values are not in agreement with experimental results, the stoichiometric model has to be reevaluated (74). As different environmental conditions are tested, the need for more iterations arises.
Constraint-based analyses of metabolic networks have become popular for simulations re-garding cellular metabolism. FBA (65) is the dominant approach for flux estimation (70; 34). It uses linear optimization by maximizing or minimizing an objective function to determine the steady-state reaction flux distribution in the metabolic network, providing one optimal solution (70). Maximization of biomass formation is the most common objective function. However, different simulations can be performed (e.g. maximizing/minimizing a target compound production).
The following expressions illustrate the FBA formulation: maximize/minimize→ Z
subject to→S.v=0
βj ≥ vj ≥αj, j = 1, ... N Where
• Z is the linear objective function to be maximized or minimized • S is the sparse stoichiometric matrix
• v is the flux vector
• βj and αj are the upper and lower bounds, respectively.
This method can be used in several reconstruction steps, such as model refinement, gap filling and energy requirements fine-tuning.
After a model is validated, one can determine how robust a metabolic model is in dif-ferent simulation conditions, using Flux Variability Analysis (FVA) (29). Minimum and max-imum fluxes for reactions in the network, while maintaining a specific state, can be deter-mined using this method.
Among the common applications of FVA is the studying of flux distributions under sub-optimal growth, optimization of process feed formulation for production of desired prod-ucts, understanding networks flexibility and optimal strain design procedures.
2.2.2 Microbial community models
Mathematical models provide information impossible to acquire with experimental data alone (35). Models consolidate experimental knowledge, underlying assumptions, and ex-pose gaps and inconsistencies in the knowledge. Once a model is finished, it can be used
to predict a system’s response to conditions that have not yet been tested experimentally or predict system properties that are not directly observed.
Identically to single organisms, communities might be modeled by using top-down or bottom-up approaches (6). Thereby, definitions such as Population-level Model (PLM) and Individual-based Model (IBM) arised (6; 35).
2.2.2.1 Population-level Models
The traditional approach to modelling a microbial consortium is based on PLMs. These represent a top-down approach and are simple models that provide general explanations. The biological variability among individual cells is not considered and all cells are grouped together and represent one single macroscopic variable (86).
For example, these can be used to understand predator-prey interactions and generate oscillatory population dynamics. When using differential equations, a PLM is applied to spatially homogeneous environments and when using partial differential equations these describe spatially structured environments. However, there are limitations regarding these models. As previously mentioned, the lack of information describing the state and behavior of individual microorganisms can lead to incorrect predictions (35; 86).
2.2.2.2 Individual-based Models
Alternatively, IBM uses individual cells as modelling unit (86). It models the properties, activities and interactions of individuals in the population. Important examples of such are:
• Biomass of an individual species
• Uptake of substrates from the environment
• Competitive, synergistic or parasitic interactions between individuals
IBMs use single cell data resulting in individual-level information. Consequently, the collective information results in population-level data (35). Thus, IBMs incorporate phys-ical, chemical and biological information at the individual bacterium level to produce a population-level output (86). Since IBMs account for individual organism and its interac-tions with the environment, the natural variability is simulated (23; 86).
On a final note, IBMs exhibit high computational demands (86) and alternative ap-proaches are also used (e.g. combining individuals in a population in a super-individual (92)).
2.2.2.3 Microbial Communities Design
FBA simulations represent an important part in reconstructing a high-quality GSM model (27; 65; 74). Furthermore, FBA has applications in GSM modeling in microbial communities. Three different approaches in the usage of this method have been proposed (31). They vary in complexity and the way individual species are handled (31). There is a steady-state compartmentalized approach (5; 88), a supra-organism approach (46; 76), and a dynamic compartmentalized approach, based on dFBA (37). Alternatively, these frameworks are also referred to as species compartmentalization, mixed-bag modeling and multi-species dynamic modeling, respectively (36; 71).
The compartmentalized approach is the most frequently used when studying microbial interactions (5). It assigns a compartment to each organism, and creates a shared compart-ment for metabolite exchanges between them. With this new common compartcompart-ment, the original external metabolites become internal ones in the community. Thus, they must be balanced following the mass balance equation (Eq. 3). The individual species’ exchange metabolites are combined so that they only exist once in the new community model.
In the individual organisms’ models, the specific growth rates’ unit was referred as h-1. Nevertheless, on a community level, the unit was changed to gDWi/gDWc/h, where i and c represent an individual and the community, as these are biomass synthesis reactions which produce the species’ into the shared compartment. On the same note, a community growth reaction is introduced, resulting from the different synthesized biomass to the community medium. The rate of this reaction represents the community growth rate (h-1).
The resulting community’s structure facilitates the comprehension of species interactions and provides a detailed insight on pathogen or mutualistic interactions, for example (46). The shared byproducts and exchange reactions flow through the shared compartment. For instance, Stolyar and coworkers, modeled a microbial community as a multi-compartment metabolic network and used FBA to characterize community-level fluxes. Optimal growth rate and metabolite fluxes were estimated and the biomass functions for each species were combined and weighted (88).
Rodr´ıguez and coworkers (76) used the supra-organism approach for the first time. All metabolic reactions from the community’s individuals were merged, resulting in a sole, larger, reaction set. Thus, species are not segregated and its boundaries are not considered. Afterwards, it was used to study the metabolic capabilities in terms of product and sub-strate variation of the community (5). Recently, biomass concentrations were successfully integrated in the compartmentalization approach (46).
Finally, the dynamic compartmentalized approach (37) implements dFBA through the usage of substrate uptake kinetics and cross-feeding between organisms. Instead of using specific substrate uptake values, dFBA calculates the time-varying consumption and
pro-duction of metabolites, changes in biomass, and effects of the metabolism in the community environment (5).
2.3 c o m p u tat i o na l t o o l s
Along with the development of high-throughput sequencing, techniques such as metage-nomics and meta-transcriptomics facilitate the access to genomic data (99). Despite the increasing amount of information, there is still a need to understand individual microor-ganisms contributions to the whole community, resulting in the need to develop modelling frameworks and approaches to elucidate such aspects (8; 99).
2.3.1 Single Organism Based Tools
2.3.1.1 merlin
Metabolic Models Reconstruction Using Genome-Scale Information (merlin) (12) is an in-house developed tool. It is user-friendly and is divided in two modules: annotation module and models reconstruction module. It aids in all GSM model reconstruction stages for a single-species model.
2.3.1.2 COBRA Toolbox and COBRApy
COBRA methods have been commonly used in field of metabolic pathway engineering (21; 22; 64).
COBRA Toolbox was released as a MATLAB package (78). It contains several in silico methods for quantitative prediction of cellular biochemical networks, with constraint-based modelling. In addition, it reads and writes models in the universal format SBML.
The latter version, COBRA Toolbox v3.0 (69), includes methods and tools implemented in several categories. Among these are:
• Gap filling • Network Reconstruction • Reconstruction refinement • FBA • Network visualization • FVA
After COBRA Toolbox creation, an extension was designed: COBRApy (16). A Python package that works in an object-oriented way and facilitates the representation of metabolism and gene expression.
2.3.1.3 OptFlux
OptFlux is an open-source and modular software used in metabolic engineering. It pro-vides easy access to a number of tools, due to its user-friendly interface (73)
Among the different algorithms and tools OptFlux offers, are: • Metabolic Flux analysis (MFA) (87)
• Evolutionary Algorithms (EA) (67), the OptKnock algorithm (7) or simulated annealing metaheuristics for strain optimization through identification of metabolic engineering targets(75).
• FBA, Minimization of Metabolic Adjustment (MOMA) (80) and Regulatory on/off minimization of metabolic flux changes (ROOM) (82).
• Model visualization module 2.3.1.4 CarveMe
CarveMe (56) is an open-source and user-friendly tool for reconstruction of both species and community models. Its novelty arises from the fact that a top-down reconstruction approach (Figure 2) is used.
Thus, a manually curated universal model is used for the automated reconstruction. It in-cludes a universal biomass equation, import/export reactions and does not contain blocked or unbalanced reactions.
To create an organism-specific model, reactions and metabolites not predicted to be present in the desired organism are removed, and the manual curation and structural prop-erties of the original model are maintained. Additionally, for the creation of a microbial community model, the desired single-species models are merged, resulting in a community network.
2.3.1.5 KBase
The DOE Systems Biology Knowledgebase (KBase) (3) is an open-source software and data platform. It aids comparative genomics of plants, prediction of microbiome interac-tions and metabolic modeling of microbes, by providing a set of applicainterac-tions for genome assembly, annotation, metabolic model reconstruction, FBA, expression analysis and com-parative genomics. Thus, it can be used in single organisms and community modeling.
Figure 2: The top-down approach of model reconstruction. A universal model is generated and manually curated. This is then used as a template for organism-specific model generation. Adapted from Machado et al. (56)
2.3.2 Community Based Tools
2.3.2.1 Community Flux Balance Analysis
Community Flux Balance Analysis (cFBA) (46) is a computational method whose primary focus is elucidating metabolic capabilities of a community and understanding metabolic interactions. It uses genome-scale stoichiometric models of metabolism, metabolic interac-tions between species in the community, abiotic processes and considers constraints deriv-ing from reaction stoichiometry, reaction thermodynamics, and the ecosystem.
Along with the abundance of all species present in the community, cFBA predicts fluxes distribution, growth rates and exchange fluxes between the microbes and the environment as well. It is a direct extension of FBA for single organisms to communities, by applying community-specific constraints.
Considering two organisms in a community, cFBA can be used after merging both species’ GSM model reconstructions, resulting in one stoichiometric matrix of the consortium which contains all the internal and transport reactions, unique extracellular reactions and cross feeding reactions. The latter are determined by analyzing the common set of exchange metabolites. Biomass abundances of the individual organisms are also considered, in addi-tion to the whole consortium simulaaddi-tions.
The problem definition of cFBA is non-linear if biomass fractions are considered a vari-able and the number of organisms in the community affects the number of linear programs to be solved. Even though this approach initially presents a non-linear programming prob-lem if the biomass fraction is variable, by fixing the individual biomass values, a Linear Programming (LP) problem arises, thus providing a result which identifies the optimal
spe-cific flux values. This approach states that the entire community is at steady state and thereby all metabolites mass balances equal zero and reaction rates stay constant. It should also be highlighted that the community growth rate does not need to equal the maximal growth rate of any individual organism. However, when considering a mutualistic interac-tion between growing organisms, to maintain a steady-state of the cross-feeding metabolite, producing and consuming organisms need to grow at an equal pace.
2.3.2.2 Dynamic Flux Balance Analysis
Dynamic Flux Balance analysis (dFBA) (37; 58) is another direct extension of FBA, used to simulate, analyse and optimize synthetic microbial communities in diverse contexts. In comparison to other modelling approaches, it provides the incorporation of GSM models in a dynamic model. Thus, the result is a better prediction of time-varying species metabolism and interactions, as it accounts for dynamic changes in the concentration of metabolites. However, one could consider the fact that substrate uptake kinetics needs to be determined, a limitation.
A steady-state community flux balance model is created by merging the stoichiometric matrices of the individual organisms into one and solving an objective function for the whole community, consequently calculating the unknown fluxes by solving a LP problem.
To develop a dynamic flux balance model for a community, the steady-state flux bal-ance model described above is combined with substrate and exchange metabolites uptake kinetics. This model also includes extracellular mass balances on substrates and products.
The following expression represents the LP problem representing the multispecies exten-sion of single-species FBA.
maxµ=µ1+µ2+...+µn =wTv Sv=0
β≥v≥ α
(5)
Where
• For a community of n organisms, µnis the respective individual growth rate • µ is the community growth rate
• w is a vector of biomass weighing coefficients containing the coefficients of the indi-vidual species
• S is the stoichiometric matrix • v is the fluxes vector
• β and α are the upper and lower bounds, respectively.
The extension of classical FBA is based on specifying substrate uptake fluxes of the indi-vidual species and solving equation (3) for the unknown fluxes. Although classical FBA is still used to compute the growth rate, intracellular fluxes v and the product secretion rates vp, extracellular substrate concentrations S and product concentrations P are now used for calculation of time-varying substrate uptake rates vs through expressions for the uptake kinetics, as described in Figure 3, a representation of the dFBA framework.
The substrate uptake rates describe the maximum rates possible caused by transport limitations and are incorporated as upper bounds on the uptake rates calculated in the FBA problem.
Figure 3: Representation of a dynamic flux balance analysis. Initial substrate, product and biomass concentrations are introduced. The subset of fluxes for substrate uptake and secretion rates changes as the concentration values are updated. For each change, a new objective function value is calculated. As a result, exchange values change continuously over time. Subsequently, available substrate and product concentration changes. Adapted from Hen-son et al. (37).
Ultimately, the dFBA approach provides certain advantages when studying communities due to its higher capability for capturing time-varying species metabolism and interactions. Nonetheless, its limitations are something to take into consideration. Substrate uptake kinetics determination is required, which has proved to be one of the main challenges of this approach.
2.3.2.3 DyMMM
Dynamic Multispecies Metabolic Modeling (DyMMM) (97) framework was implemented in MATLAB and is available as an add-on to COBRA toolbox. It is an extension of the aforementioned dFBA approach (58), which states that a steady state is reached as a conse-quence of changes in the extracellular environment. As FBA predicts rates, these are used to update the extracellular environment.
A community metabolic model must account for the metabolic exchanges between species and with the environment, as well as the changes in biomass of the modeled species. The DyMMM framework describes a community of N microbial species coexisting in an envi-ronment containing a specified number of metabolites. It integrates all the community’s microbial species growth rates, as well as the production/consumption (exchange) rates of all metabolic species in the environment.
The growth rate (dX/dt) of every microbial species in the community is given by equa-tion 6, whereas the consumpequa-tion/producequa-tion rate (dS/dt) of every metabolite in the envi-ronment is given by equation 7:
dXj dt =µjXj (6) dSi dt = N
∑
j=1 VijXj (7)Where j is a species in the community, Xj its biomass and µj its growth rate. As i is a metabolite, Si represents its concentration in the environment and Vijits consumption/pro-duction rate by the organism j .
Vij and µj values are calculated for each microbial species in the community, using FBA, as represented in the equation set 8:
Maximize µj =cTvj subject to Sjvj =0 vjmax ≥vj ≥vjminM ≥i≥1 N≥ j≥1
(8)
Where cT is the objective function, Sj is the stoichiometric matrix of the organism j, vjmaxand vjminare its flux capacity constraints, based on its respective genome-scale model. When considering external metabolites, vjmax and vjmin to the respective fluxes can be cal-culated environmental concentration of these metabolites, using either an On/Off method (if the uptake kinetics are not available) or the MichaelisMenten kinetics method (if kinetics information is available). M is the number of metabolites in the community and N the number of microbial species.
Given the flux constraints, a solution where the objective function (specific growth rate) is maximal is calculated by LP.
2.3.2.4 DFBAlab
Dynamic Flux Balance Analysis laboratory (DFBAlab) (26) is a MATLAB-based, dynamic simulation framework. Similarly to DyMMM, it is based on the dFBA approach.
Given a vector x0 that contains the initial concentrations of metabolites and biomass in a culture, after specifying metabolites’ exchange fluxes for each species (exchange fluxes), mass transfer rates, feed and discharge rates from the culture and other dynamic processes, a rate of change function f can be calculated for each of the elements of x0. After integrating the function f, the concentration profiles with respect to time, x(t), are assessed.
Lexicographic optimization is used by DFBAlab. Thus, objectives are ordered by priority. In this case, the first objective is the maximization of biomass, followed by maximization or minimization of the specified metabolites exchange fluxes.
Additionally, as LPs have a single optimal objective function value, such value changes continuously with changes in the lower and upper bounds of a species, in a dynamic ap-proach.
In sum, DFBAlab combines lexicographic optimization with a LP feasibility problem to generate an extended dynamic system for which the LP always has a solution.
2.3.2.5 µbialSim
µbialSim (68) is based on dFBA. Thus, dynamic shifts, as a consequence of the systems
dynamics are simulated. Additionally, the time course in terms of composition and activity of a community, in batch or chemostat may be predicted.
As the compartmentalized approach (88) is used to generate a community model, sepa-rate genome-scale metabolic network models are used to model the activity and growth of individual species. Additionally, each organism has access to a common pool of metabo-lites, enabling metabolite exchange. Compound exchange and growth rates are computed through FBA and used to update the state variables of the model.
Discontinuities in intracellular fluxes over time can occur in dFBA simulations, as differ-ent flux distributions can lead to the same maximal growth rate. However, to avoid such discontinuities, µbialSim has two features, which can be used individually or one succeed-ing the other:
• pFBA, determining a FBA solution with a minimal sum of fluxes;
• A methodology similar to MOMA, where the optimal growth rate is found by flux distributions
All the simulated exchange fluxes are calculated by µbialSim. Thus, fluxes for both the exchange reactions that are coupled to the pool compounds and those that are not, can be obtained.
2.3.2.6 OptCom
OptCom (99) uses a multi-level optimization structure. It assesses the interactions be-tween the species involved, either positive, negative or both.
It consists on two levels:
• An inner-level regarding individual fitness level of organisms • An outer-level regarding community fitness.
The existence of two levels ensures that the combined biomasses (individual organisms and the community) is maximum. It is important to note that it maximizes community fitness, while not compromising the fitness of its individual organisms.
If more constraints are provided, OptCom is also able to compute cases where organisms do not present their maximum growth, exhibiting cooperative behavior instead.
Additionally, a new perspective of OptCom arised with the creation of d-OptCom (98), which takes dynamics of the microbial communities into consideration. It integrates dy-namic mass balance equations referring to metabolite production, organism growth and substrate uptake. The result is the prediction of biomass and metabolite exchange between the community members.
Finally, a community-level objective function is obtained, subject to biomass maximiza-tion for each species.
2.3.2.7 SteadyCom
SteadyCom (8) is an optimization framework, integrated in COBRA Toolbox. It predicts the metabolic flux distribution, assuring that steady-state is imposed. In addition, it is compatible with flux balance analysis.
When a single organism is considered, the biomass flux is normalized by the organism’s rates of consumption or production. However, when multiple organisms are growing, there is not a constant growth rate for all microbes. Therefore, the fastest growing organism can outgrow the rest of the community members. Thus, SteadyCom imposes a steady-state condition, where an organism cannot secrete metabolites if it is not growing, to avoid these situations.
Additionally, SteadyCom considers an aggregate flux, which is described as the total biomass of a population. It quantifies the metabolites that an organism can consume or produce in a microbial community. Furthermore, an organism can only have non-zero fluxes if both its biomass production is non-zero as well.
2.3.2.8 micom
”micom” (microbial communities) (13) is a Python software package, based on the CO-BRApy Python package (16).
As aforementioned, FBA assumes a steady state for all fluxes in a biological system and optimizes an organism-specific biomass, calculating the approximate fluxes of the organ-ism.
Similarly, micom assumes that growth rates and relative abundances in the community are in steady state. Thus, its mathematical formulation is similar to the aforementioned mentioned OptCom and SteadyCom frameworks’ formulation, where there are two differ-ent classifications for growth rates: individual growth rates, which estimate the growth rate of a single organism, and the community growth rates, which represent the growth of the entire community.
To represent the community, a particular abundance for each organism (in gDW) is con-sidered and each organism is allocated to an external compartment which represents the community environment. Given a particular abundance of an organism, a sub-model in the whole community, micom scales the whole community’s internal exchange fluxes to the respective abundance value.
Finally, both transport (organism-common compartment) and community exchange reac-tions (which can be used to constrain the model) are added, resulting in the final community model.
2.3.2.9 RedCom
RedCom (51) consists of an approach to build community models, which is based of the compartmentalized model approach (88). Nevertheless, it builds reduced community models.
Firstly, the individual models are reduced by eliminating reactions that are not relevant for the individual organism’s growth. If the single organisms’ exchange fluxes in the com-munity models do not pass an imposed minimality criterion, these solutions are discarded and the respective reactions are removed. Subsequentely, the community model is created using the smaller models to avoid unrealistic solutions, where a species altruistically syn-thesizes large amounts of byproducts while not synthesising a corresponding proportion of biomass.
As the created models are smaller, smaller ranges of feasible community compositions and exchange fluxes are calculated.