Bruno André Cunha de Vallêra Jacques Pedras
SYNTHESIS, CHARACTERIZATION AND APPLICATIONS OF
NEW SCHIFF BASE FLUORESCENT CHEMOSENSORS FOR
METAL AND DNA INTERACTIONS: CONVENTIONAL AND
“GREEN” APPROACHES
- nº de arquivo
UNIVERSIDADE NOVA DE LISBOA
Faculdade de Ciências e Tecnologia
SYNTHESIS, CHARACTERIZATION AND
APPLICATIONS OF NEW SCHIFF BASE
FLUORESCENT CHEMOSENSORS FOR
METAL AND DNA INTERACTIONS:
CONVENTIONAL AND “GREEN”
APPROACHES
BRUNO ANDRÉ CUNHA DE VALLÊRA J. PEDRAS
Dissertação apresentada para a obtenção do Grau de Doutor em Química Sustentável, especialidade de Química-Física Inorgânica, pela Universidade Nova de Lisboa, Faculdade de Ciências e TecnologiaSupervisor: Prof. Dr. Carlos Lodeiro Espiño
Co-supervisores: Prof. Dr. Teresa Avilés e Prof. Dr. José Luís Capelo
“What we don’t understand, we explain to each other”
J. Robert Oppenheimer
“Se podes olhar, vê. Se podes ver, repara”
Agradecimentos
Começo por agradecer ao meu orientador principal, o Professor Doutor Carlos Lodeiro Espiño. Foi ele a pessoa que apostou em mim desde o princípio e me motivou para o mundo dos sensores e da fluorescência; transmitindo-me os seus conhecimentos, contribuiu para o meu processo de formação científica e pessoal, sempre tendo em mente que um Doutor não deve ser um especialista numa só área, mas sim um cientista polivalente e com condições de encarar qualquer desafio no futuro. Soube compreender a minha forma de trabalhar, não deixando de me chamar a atenção para os meus erros, mas sempre de uma forma construtiva e apoiando-me nos moapoiando-mentos apoiando-menos bons. Por tudo isto, o apoiando-meu enorapoiando-me obrigado!
Simultaneamente, quero agradecer aos meus co-orientadores. À Professora Doutora Teresa Avilés Perea, pela forma como me recebeu e me tratou ao longo destes anos, proporcionando-me as melhores condições para desenvolver o meu trabalho e pelos seus muitos e bons conselhos durante a síntese de grande parte dos compostos desta tese. Ao Professor Doutor José Luís Capelo, pelo seu espírito sempre optimista e motivador em todas as etapas desta tese e por tudo o que me transmitiu na área da Química Analítica.
À Fundação para a Ciência e a Tecnologia, agradeço o financiamento através da bolsa de doutoramento SFRH/BD/27786/2006.
Aos membros do BIOSCOPE (Lisboa) e restantes companheiros de laboratório, nomeadamente Elisabete, Vítor, Tiago, Carla, Marco, Hugo, Gonçalo, Ricardo, Mário e Luz. A los miembros del BIOSCOPE (Ourense) y demás compañeros de la Facultad de Ciencias de Ourense, que han hecho que mi estancia allí fuese inolvidable: Cristina, Javier, Jorge, Júlio, Profesor Juan Carlos Mejuto, Gonzalo, Óscar, Iago, Serxio, Antonio, Marta, Rosi y Vittorio.
Quiero agradecer al Profesor Dr. Guillermo Orellana Moraleda, por darme la oportunidad de trabajar en el GSOLFA, y por su valiosa colaboración en mi trabajo. A todos los miembros del Grupo, en particular a la Dra. Laura Tormo por su apoyo en los estudios con DNA, y a todos los que hicieron que mi primera estancia en un país extranjero fuera una de las experiencias más apasionantes de mi vida: David, Aurélien, Pilar, Ruymán, Sofia, Niko, Clara, Juan, y porque hay amistades que se quedan para siempre, Paco, Kássio, André e Irene. Muchas gracias a todos!
Aos meu grandes amigos Filipe Folgosa e Filipe Agapito, pelos pilares que têm sido ao longo dos anos, com as suas enormes amizade e generosidade e pelo apoio incondicional no dia-a-dia. Sem o primeiro, esta “aventura” não teria sequer começado, e sem o último esta nunca teria chegado a bom porto.
Agradeço à Cris todo o apoio que me deu durante os primeiros anos. Ao Bruno Rosíndio, agradeço os mais de 20 anos de amizade.
A Manoli, te agradezco todo lo que eres y lo que significas en mi vida. Sin ti nada de esto tendría la mitad del sentido. Gracias por tu comprensión, sobre todo durante este período largo de escrita, y por tu amor incondicional!
Abstract
The work presented in this thesis, which has as its central subject the synthesis and applications of new fluorescent chemosensors and probes, can be divided in two major groups. The first one deals with Schiff base-derived fluorescent chemosensors, with application in the detection of metal cations, and the second group concerns the development of new Ru(II) polypyridyl luminescent molecular probes for DNA.
Before the description and discussion of the performed work, a general introduction is presented in Chapter I, where emphasis is put on the applications of
molecular fluorescence to chemical sensing, in order to obtain a better understanding of the photophysical processes that underlie molecular recognition. This connection is made by defining concepts and giving examples when necessary. A brief mention to the studied analytes and the instrumental methods used both in developing the chemosensors and in their applications is also made.
In Chapter II, two new chemosensors possessing crown ether moieties linked
through a Schiff base to a bithiophene group are presented. These systems were synthesized and fully characterized, and their application in the sensing of Ni(II), Pd(II), Hg(II) and Na(I) was tested by absorption and emission spectroscopies, and MALDI-TOF MS.
Chapter III describes two new pincer-type ligands, in which a thiophene unit is
linked through a Schiff base either to pyrene or naphthalene chromophores. Sensing applications for Ni(II) and Pd(II) were investigated by different techniques, and solid complexes with the aforementioned metals were also synthesized.
A new tripodal ligand derived from indole and containing three Schiff base groups is introduced in Chapter IV, and its complexes with Zn(II), Cu(II), Ni(II), Hg(II)
and Pd(II) are also described. Metal ion titrations of the free ligand with the respective metal salts have been performed, helped by DFT calculations, in order to investigate the role of the central tertiary amine in metal coordination.
The search for new luminescent molecular probes to be used in DNA binding is the subject of Chapter V, in which a new family of six Ru(II) polypyridyl complexes
Chapter VI returns to cation sensing, but it is included in the end of the thesis
because this work is still in progress. It reports the synthesis of three new quinoline-derived chemosensors for Zn(II) and Cu(II), and a dinuclear Zn(II) complex with potential application as water sensor by fluorescence quenching. With this last compound, only preliminary studies have been performed.
The general conclusions of this work are collected in Chapter VII.
Resumo
O trabalho apresentado nesta tese, que tem como tema principal a síntese e aplicações de novos quimiossensores e sondas fluorescentes, pode dividir-se em dois grupos principais. O primeiro diz respeito a quimiossensores fluorescentes derivados de bases de Schiff, com aplicação na detecção de catiões metálicos, e o segundo grupo trata do desenvolvimento de novos complexos de Ru(II) polipiridilo como sondas moleculares luminescentes para ADN.
Antes da descrição e discussão do trabalho efectuado, é apresentada uma introdução geral no Capítulo I, onde se dá ênfase às aplicações da fluorescência
molecular em química de sensores, de modo a obter um melhor conhecimento dos processos fotofísicos subjacentes ao reconhecimento molecular. Esta ligação é feita definindo conceitos e exemplificando sempre que necessário. Faz-se também uma breve menção aos analitos estudados e aos métodos instrumentais utilizados, quer no desenvolvimento dos quimiossensores, quer na sua aplicação.
No Capítulo II são apresentados dois novos quimiossensores dotados de
unidades éter-coroa ligadas através de uma base de Schiff a um grupo bitiofeno. Estes sistemas foram sintetizados e completamente caracterizados, e a sua aplicação na detecção de Ni(II), Pd(II), Hg(II) e Na(I) foi testada por espectroscopias de absorção e emissão, e MALDI-TOF MS.
O Capítulo III descreve dois novos ligandos do tipo pinça, nos quais uma
unidade de tiofeno está ligada através de uma base de Schiff a cromóforos pireno ou naftaleno. Aplicações como sensores de Ni(II) e Pd(II) foram investigadas por diferentes técnicas, e foram também sintetizados complexos sólidos com os metais supracitados.
Um novo ligando tripodal derivado de indol e contendo três grupos base de Schiff é introduzido no Capítulo IV, e os seus complexos com Zn(II), Cu(II), Ni(II),
Hg(II) e Pd(II) são também descritos. Foram ainda realizadas titulações do ligando livre com os respectivos sais metálicos, e com a ajuda de cálculos DFT, investigou-se o papel da amina terciária central na coordenação de metais.
A procura de novas sondas moleculares luminescentes para aplicações em
estudos de união ao ADN é o tema do Capítulo V, onde uma família de seis
O Capítulo VI aborda novamente o tema dos sensores de catiões, mas vem
incluído no final da tese pois este trabalho ainda se encontra em fase de realização. É descrita a síntese de três novos quimiossensores para Zn(II) e Cu(II) derivados de quinolina, bem como um complexo dinuclear de Zn(II) com potencial aplicação como sensor de água através da supressão de fluorescência. Com este último, apenas foram realizados estudos preliminares.
As conclusões gerais deste trabalho são apresentadas no Capítulo VII.
List of Symbols and Abbreviations
A Absorbance
Acceptor
a.u. Arbitrary units
bpy 2,2’-Bipyridine
CHEF Chelation Enhancement of Fluorescence
CHEQ Chelation Enhancement of Quenching
CT Calf thymus
Charge transfer
d Doublet
D Donor
DMF Dimethylformamide
DMSO Dimethyl sulfoxide
DNA Deoxyribonucleic acid
dppz Dipyrido[3,2-a:2’,3’-c]phenazine
ds double-stranded
δ Chemical shift
ETBr Ethidium bromide
EI Electronic impact
ESI Electrospray ionization
ESIPT Excited-State Intramolecular Proton Transfer
ε Molar absorption coefficient
ΦF Fluorescence Quantum Yield
FRET Förster Resonance Energy Transfer
HOMO Highest Occupied Molecular Orbital
1H-NMR Proton Nuclear Magnetic Resonance
Hz Hertz
I Intensity of emission
IR Infrared
IUPAC International Union of Pure and Applied Chemistry
Kb Intrinsic DNA binding constant
kq Quenching rate constant
LMCT Ligand to Metal Charge Transfer
LUMO Lowest Unoccupied Molecular Orbital
λ Wavelength
λem Emission wavelength
λexc Excitation wavelength
λmax Wavelength of maximum emission or absorption
m Multiplet
MALDI-TOF Matrix Assisted Laser Desorption/Ionization Time of Flight
MC Metal Centered
MS Mass Spectrometry
MV2+ Methyl Viologen
MLCT Metal to Ligand Charge Transfer
m/z Mass-to-charge ratio
OS Oscillator strengths
PET Photoinduced Electron Transfer
PCT Photoinduced Charge Transfer
PPT Photoinduced Proton Transfer
phen 1,10-Phenanthroline
RNA Ribonucleic acid
s Singlet
SPT Single-photon timing
t Triplet
TD-DFT Time-Dependent Density Functional Theory
THF Tetrahydrofuran
τ Emission lifetime
τm Pre-exponential weighted emission lifetime
TREN Tris(2-aminoethyl)amine
TRIS Tris(hydroxymethyl)aminomethane
General Index
Chapter I – Introduction …….………1
I.1 Concept of chemosensor ……….………3
I.2 Fluorescent chemosensors. Advantages and general classification ……….….4
I.3 Mechanisms of transduction: PET, ESIPT, ET, excimer and exciplex formation, PCT ………6
I.3.1 Photoinduced electron transfer (PET)……….…….7
I.3.2 Excited state proton transfer……….…….8
I.3.3 Excited state energy transfer……….……9
I.3.4 Excimer and exciplex formation ……….…..11
I.3.5 Photoinduced charge transfer (PCT) ………...12
I.4 Cation sensing ……….….12
I.4.1 Crown ethers ……….….13
I.4.2 Schiff bases ……….….15
I.5 Ruthenium(II) polypyridyl complexes as luminescent probes for DNA……….18
I.6 Sensing targets: metal ions and DNA ……..……….23
I.6.1 Metal ions ...………....23
I.6.1.1 Sodium ...23
I.6.1.2 Nickel……...24
I.6.1.3 Copper ……….………..24
I.6.1.4 Zinc ……….………..25
I.6.1.5 Palladium ……….………..25
I.6.1.6 Mercury ……….………...25
I.6.2 DNA ……….………..26
I.7 Scope of the present thesis...………...28
I.8 Instrumental methods……..………..29
I.8.1 UV-Vis and steady-state fluorescence spectroscopies………29
I.8.2 Time-resolved fluorescence spectroscopy: Single Photon Timing (SPT).………..30
I.8.3 Synthetic techniques……….………31
I.8.3.1 Microwave irradiation………31
I.8.3.2 Ultrasounds………31
Chapter II – Synthesis, characterization and spectroscopic studies of two new
Schiff-base bithienyl pendant-armed 15-crown-5 molecular probes………37
Resumo………...39
Abstract………...40
Introduction / Results and Discussion / Conclusions………...41
Acknowledgements………52
References / Experimental………...53
Chapter III – Sensing Metal Ions with Two New Azomethine-Thiophene Pincer ligands (NSN): Fluorescence and MALDI-TOF MS applications………....59
Resumo………...61
Abstract………...62
Introduction / Results and Discussion / Conclusions………...63
Acknowledgements………...69
References / Experimental………...69
Supplementary Material………74
Chapter IV – A new tripodal poly-imine indole-containing ligand: Synthesis, complexation, spectroscopic and theoretical studies………..79
IV.1 Resumo………...81
IV.2 Abstract………...82
IV.3 Introduction……….83
IV.4 Results and Discussion………84
IV.4.1 Synthesis and characterization. Complexation Studies………..84
IV.4.2 Conformational Study………90
IV.4.3 TD-DFT Calculations……..…..……….93
IV.5 Conclusions ……...………...……97 IV.6 Experimental ……….……….98
IV.6.1 Chemicals and Starting materials ………98
IV.6.2 Instrumentation………...98
IV.6.3 Computational Details……….100
IV.6.4 Synthesis of L………...101
IV.6.5 Synthesis of the metal complexes. General Procedure……….101
IV.8 References………104
IV.9 Supplementary material………..107
Chapter V – Novel Ru(II) thienyl-imidazo-phenanthroline polypyridyl complexes: synthesis, characterization, photophysical studies and interaction with DNA………..113
V.1 Resumo……….115
V.2 Abstract……….116
V.3 Introduction………...117
V.4 Experimental Section………..118
V.4.1 Materials………118
V.4.2 Instrumentation……….119
V.4.3 Synthesis………...120
V.4.3.1. General procedure for the synthesis of imidazo[4,5-f][1,10]phenanthrolines 5 and 6……….121
V.4.3.2. Synthesis of the Ru(II) Complexes……….123
V.5. Results and Discussion………..125
V.5.1 Synthesis………...125
V.5.2 Spectroscopic characterization………..127
V.5.3 Interaction of Ru(II) complexes with DNA………127
V.5.4 Emission quenching studies………..132
V.6 Conclusions………..136
V.7 Acknowledgments………137
V.8 References………137
V.9 Supplementary Material………..142
Chapter VI – New quinoline α-diimine ligands as fluorescent probes for metal ions: ultrasound-assisted and conventional synthetic methods………....167
VI.1 Resumo……….169
VI.2 Abstract……….170
VI.3 Introduction………...171
VI.4 Results and discussion………...172
VI.4.1 Synthesis and characterization of compounds 1 to 4………172
VI.4.2. X-ray diffraction characterization of 1………..175
VI.5 Conclusions………..182
VI.6 Experimental section………...183
VI.6.1 General………..183
VI.6.2 Synthesis………..184
VI.6.2.1 Synthesis of 1………184
VI.6.2.2 Synthesis of 2………185
VI.6.2.3 Synthesis of 3………185
VI.6.2.4. Template synthesis of 4………..185
VI.6.3 Crystal structure determination………186
VI.7 Acknowledgments………186
VI.8 References………187
VI.9 Supplementary Material………..190
Chapter VII – Conclusions………..193
Index of Figures
Figure I.1 – Schematic representation of a chemosensor. 4 Figure I.2 – Main types of fluorescent molecular sensors of ions or molecules. 6 Figure I.3 – Principle of cation recognition by PET-based sensors. 8 Figure I.4 – Electron movements taking place in long-range Coulombic energy
transfer. 10
Figure I.5 – Electron movements taking place in short-range energy transfer by the
exchange mechanism. 11
Figure I.6 – Dibenzo-18-crown-6. 13
Figure I.7 – Crown-containing PET sensor. 14
Figure I.8 – Crown-containing PCT sensor. 15
Figure I.9 – Schiff-base PET chemosensor for Zn(II). 17 Figure I.10 – Simplified molecular orbital diagram for Ru(II) polypyridyl complexes in
octahedral symmetry. 19
Figure I.11 – Ru(II) polypyridyl chemosensor functionalized with a macrocyclic
polyamine. 20
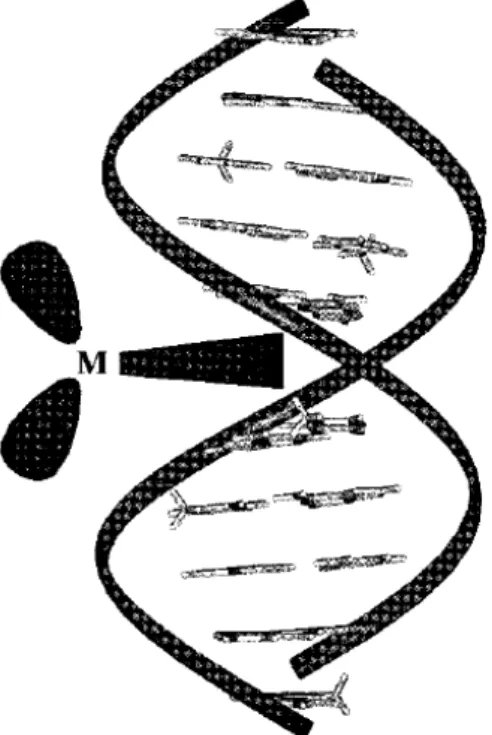
Figure I.12 – Simplified representation of an intercalating complex oriented with
respect to the DNA double helix. 21
Figure I.13 – Structure of [Ru(bpy)2(dppz)]2+ 22 Figure I.14 – Watson-Crick model for the structure of DNA. (a) Schematic representation, showing dimensions of the helix. (b) Stick representation showing the
backbone and stacking of the bases. (c) Space-filling model. 27
Figure I.15 – DNA nucleobases. 28
Figure II.1 – A) Absorption spectrum of L1 and absorption and emission spectra of L2 in acetonitrile solution ([L1] = 1.04 x 10⁻⁵M; [L2] = 4.02 x 10⁻⁵M, exc= 361nm). B) Absorption (○) and emission (□) spectra of the organic precursor 2,2’ -bithiophene-5-carbaldehyde. ([BTP] = 4.65x10⁻⁶M, exc = 354nm) and absorption (●) and emission
(■) spectra of the precursor 4’-aminobenzo-15-crown-5 [4AMC] = 8.82 x10⁻⁶M, exc=
298nm) in acetonitrile. 45
-5M, exc= 361nm). The insets show the absorption at abs = 341 and 385 nm (Pd(II)
complex) and fluorescence emission at 410 and 481 nm (Pd(II) complex). 47
Figure II.3 – A) MALDI-TOF-MS spectra of L1 in the presence of one equivalent of Na(I) without matrix in acetonitrile solution. B) MALDI-TOF-MS spectra of L1Na after
the addition of one equivalent of Pd(II). 49
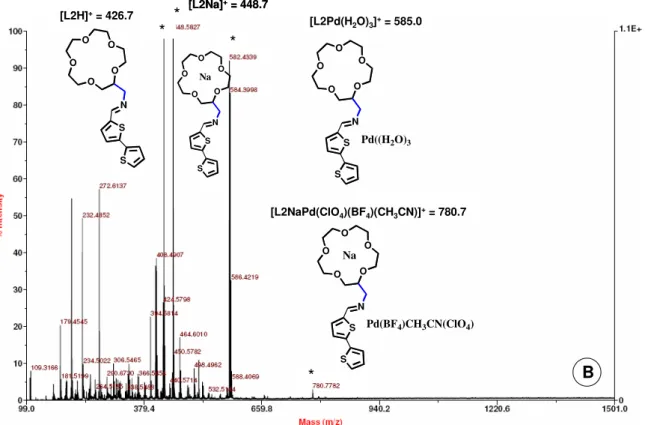
Figure II.4 – A) MALDI-TOF-MS spectra of L2 in the presence of one equivalent of
Na(I) without matrix in acetonitrile solution. 50
Figure II.4 – B) MALDI-TOF-MS spectra of L2Na after titration with one equivalent of
Pd(II). 51
Figure III.1 – Synthesis of L1 and L2 receptors. 64 Figure III.2 – Excimer-monomer emissions in ligand L2 upon metal complexation. 65 Figure III.3 – Absorption spectra of L1 in the presence of Ni(II) (up) and Pd(II) (down) in the concentration range of 0 - 3 equivalents, in dichloromethane solution ([L1] = 1 x 10⁻⁵M.). The insets show the absorption at abs = 317 and 355 nm (Ni(II) complex)
and absorption at 316 and 345 nm (Pd(II) complex). 66
Figure III.4 – MALDI-TOF-MS spectra of free ligand L1 (top), and L1 in the presence of one equivalent of Ni(II) (middle) and Pd(II) (bottom), in dichloromethane. 67 Figure III.5 – Absorption (A) and fluorescence (B) spectra of L2 in the presence of Ni(II) in the concentration range of 0 - 2 equivalents, in dichloromethane solution ([L2] = 1 x 10⁻⁶M. exc = 350 nm). Inset shows (A) absorption at 365 nm and (B) intensity of emission as a function of [Ni(II)]/[L2] at em = 379 nm (monomer) and 502
nm (excimer). 68
Figure SM III.1 – Absorption spectrum of L1 (left) and absorption, emission and solid state fluorescence spectra of L2 (right). ([L1] = 1 x 10⁻⁵M; [L2] = 1 x 10⁻⁶M. exc
= 350 nm). 76
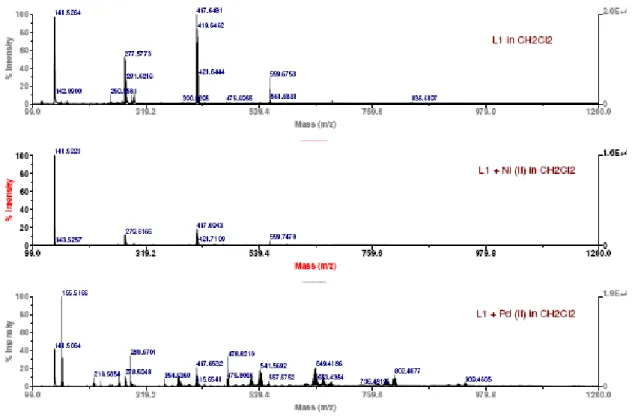
Figure SM III.2 – MALDI-TOF-MS fragmentation of L1. 76 Figure SM III.3 – MALDI-TOF-MS spectra of the ligand L1 and its corresponding
solid complexes with Ni(II) and Pd(II) in dichloromethane. 77
Figure SM III.4 – Absorption (A) and fluorescence (B) spectra of L2 in the presence of Pd(II) in the concentration range 0 to 2 equivalents, in dichloromethane solution ([L2] = 1 x 10⁻⁶M. exc = 350 nm). Inset shows (A) absorption a 368 nm and (B) intensity of emission as function of [Pd(II)]/[L2] at em = 392 nm (monomer) and 500
nm (excimer). 78
Figure IV.2 – Absorption titrations of L with Zn(CF3SO3)2 (A), Cu(CF3SO3)2 (B) and Ni(BF4)2·6H2O (C) salts in absolute ethanol solution, in the concentration range 0-2
equivalents ([L] = 9.35 x 10⁻⁶ M. Room temperature). 86
Figure IV.3 – Main fragmentation peaks observed in the MALDI-TOF-MS spectra of
L in different solvents without matrix. 88
Figure IV.4 – MALDI-TOF-MS spectra of ligand L in acetonitrile and its metal
complexes of Zn(II), Cu(II), Ni(II), Pd(II) and Hg(II). 89
Figure IV.5 – Minimized energy molecular structures for L in its different possible
conformations. 90
Figure IV.6 – Minimized energy molecular structure of [Zn·1b]2+ complex. 91 Figure IV.7 – Minimized energy molecular structure of [ZnL]2+ complex (L = 1a, left
and 3, right). 91
Figure IV.8 – Simulated spectra from the TD-DFT calculations for the zinc complexes
of 1a (solid line), 1b (dashed line) and 3 (dotted line). 93
Figure IV.9 – Isodensity representation of the orbitals of InTREN ligand involved in
the lowest energy transitions. 95
Figure IV.10 – Isodensity representation of the orbitals of the [ZnL]2+·H2O complex
involved in the lowest energy transitions. 97
Figure SM IV.1 – Absorption spectrum of L in absolute ethanol solution ([L] = 9.35 x
10-6M; room temperature). 108
Figure SM IV.2 – MALDI-TOF-MS spectra of ligand L in different solvents without
matrix. 109
Figure SM IV.3 – Simulated spectra from the TD-DFT calculations for 2. 110 Figure SM IV.4 – Simulated spectra of conformer 1a with different basis sets. 111 Figure V.1 – (A) Absorption spectra of C3, 4.9 μM in TRIS buffer, in the absence
(···), and presence of CT-DNA in ratios of 5 (---) and 10 to 30 (—). (B) Emission
spectra of C3, 4.9 μM in TRIS buffer, in the presence of increasing amounts of CT
-DNA (-DNA/Ru ratio of 0 – 80, in base pairs). λexc = 465 nm. Inset: changes in the emission intensity, I/I0 (●), and emission lifetime, τ/ τ0 (○), of C3 as a function of
DNA/Ru ratio. 129
Figure V.2 – (A) Absorption spectra of C5, 10.5 μM in TRIS buffer, in the presence of
increasing amounts of CT-DNA (DNA/Ru ratio of 0 – 80, in base pairs). (B) Emission
spectra of C5, 10.5 μM in TRIS buffer, in the presence of increasing amounts of
emission intensity, I/I0 (●), and emission lifetime, τ/ τ0 (○), of C5 as a function of
DNA/Ru ratio. 130
Figure V.3 – Emission spectra of CT-DNA + C3 (Ratio 30/1) in the presence of increasing amounts of methyl viologen (0 – 200 μM). [C3] = 4.90 μM. [DNA]stock =
2.82 mM. [MV2+]stock = 5 mM. λexc = 465 nm. 133
Figure V.4 – Emission spectra of CT-DNA + C5 (Ratio 30/1) in the presence of increasing amounts of methyl viologen (0 – 200 μM). λexc = 465 nm. [C5] = 10.5 μM.
135 Figure V.5 – Stern-Volmer emission intensity (●) and lifetime quenching plot for
C3+DNA (ratio 1:30) in the presence of increasing amounts of methyl viologen
(MV2+). Both fast (short) (▲) and slow (long) (○) components of the emission decay
are represented. λexc = 405 nm. Emission collected at 610 nm. 136
Figure SM V.1 – Absorption spectra of C1 to C6 in TRIS buffer. (Room temperature, pH = 7. [C1] = [C6] = 10 μM. [C3] = 9.43 μM. [C4] = 9.85 μM. [C2] = [C5] = 10.5 μM).
142 Figure SM V.2 – Emission spectra at room temperature of C1 to C6 in TRIS buffer. (pH = 7. [C1] = [C6] = 10 μM. [C3] = 9.43 μM. [C4] = 9.85 μM. [C2] = [C5] = 10.5 μM.
λexc = 370 nm for C1, C2 and C3; 460 nm for C4, C5 and C6). 143 Figure SM V.3 – (A) Absorption spectra of C4, 9.85 μM in TRIS buffer, in the
presence of increasing amounts of CT-DNA (DNA/Ru ratio of 0 – 80, in base pairs). (B) Emission spectra of C4, 9.85 μM in TRIS buffer, in the presence of increasing
amounts of CT-DNA (DNA/Ru ratio of 0 – 80, in base pairs). λexc = 460 nm. Inset:
changes in the emission of C4 at λ = 600 nm as a function of DNA/Ru ratio. 145
Figure SM V.4 – Changes in the emission intensity, I/I0 (●), and emission lifetime, τ/
τ0 (○), of C4 in the presence of increasing amounts of CT-DNA. 147
Figure SM V.5 – (A) Absorption spectra of C6, 10.0 μM in TRIS buffer, in the
presence of increasing amounts of CT-DNA (DNA/Ru ratio of 0 – 80, in base pairs).
(B) Emission spectra of C6, 10.0 μM in TRIS buffer, in the presence of increasing
amounts of CT-DNA (DNA/Ru ratio of 0 – 80, in base pairs). λexc = 460 nm. Inset:
changes in the emission of C5 at λ = 600 nm as a function of DNA/Ru ratio. 148
Figure SM V.6 – Changes in the emission intensity, I/I0 (●), and emission lifetime, τ/
τ0 (○), of C6 in the presence of increasing amounts of CT-DNA. 149
Figure SM V.7 –Plot of [DNA]/(εa- εb) vs. [DNA] for the absorption titration of C3 with
Figure SM V.8 –Plot of [DNA]/(εa- εb) vs. [DNA] for the absorption titration of C4 with
DNA. [C4] = 9.85 μM. [DNA]stock = 2.82 mM. Kb = 3.02 x 10⁵ M-1. 150
Figure SM V.9 – Plot of [DNA]/(εa- εb) vs. [DNA] for the absorption titration of C5 with
DNA. [C5] = 10.5 μM. [DNA]stock = 2.82 mM. Kb = 1.32 x 10⁵ M-1. 151
Figure SM V.10 – Plot of [DNA]/(εa- εb) vs. [DNA] for the absorption titration of C6
with DNA. [C6] = 10.0 μM. [DNA]stock = 2.82 mM. Kb = 1.63 x 10⁵ M-1. 151
Figure SM V.11 – (A) Absorption spectra of CT-DNA + C3 (Ratio 30/1) in the presence of increasing amounts of ethidium bromide (0 – 30 μM). [C3] = 4.90 μM.
[DNA]stock = 2.82 mM. [ETBr]stock = 1mM. (B) Emission spectra of ethidium bromide (---) and of CT-DNA + C3 (Ratio 30/1) in the presence of increasing amounts of ethidium bromide (0 – 30 μM). [C3] = 4.90 μM. [DNA]stock = 2.82 mM. [ETBr]stock = 1
mM. λexc = 465 nm. 152
Figure SM V.12 – (A) Absorption spectra of CT-DNA + C3 (Ratio 30/1) in the presence of increasing amounts of potassium ferrocyanide (0 – 400 μM). [C3] = 4.90 μM. (B) Emission spectra of CT-DNA + C3 (Ratio 30/1) in the presence of increasing amounts of potassium ferrocyanide (0 –400 μM). [C3] = 4.90 μM. λexc = 465 nm. 154 Figure SM V.13 – Absorption spectra of CT-DNA + C5 (Ratio 30/1) in the presence of increasing amounts of methyl viologen (0 – 200 μM). [C5] = 10.5 μM. [DNA]stock =
2.02 mM. [MV2+]stock = 5 mM. 155
Figure SM V.14 – (A) Absorption spectra of CT-DNA + C4 (Ratio 30/1) in the presence of increasing amounts of methyl viologen (0 – 200 μM). [C4] = 9.85 μM.
[DNA]stock = 2.02 mM. [MV2+]stock = 5 mM. (B) Emission spectra of CT-DNA + C4 (Ratio 30/1) in the presence of increasing amounts of methyl viologen (0 – 200 μM). λexc = 465 nm. [C4] = 9.85 μM. [DNA]stock = 2.02 mM. [MV2+]stock = 5 mM. 156 Figure SM V.15 – (A) Absorption spectra of CT-DNA + C6 (Ratio 30/1) in the presence of increasing amounts of methyl viologen (0 – 200 μM). [C6] = 10.0 μM.
[DNA]stock = 2.02 mM. [MV2+]stock = 5 mM. (B) Emission spectra of CT-DNA + C6 (Ratio 30/1) in the presence of increasing amounts of methyl viologen (0 – 200 μM). λexc = 465 nm. [C6] = 10.0 μM. [DNA]stock = 2.02 mM. [MV2+]stock = 5 mM. 158 Figure SM V.16 – Stern-Volmer emission intensity (●) and lifetime quenching plot for
C4+DNA (ratio 1:30) in the presence of increasing amounts of methyl viologen (MV2+). Both fast (short) (▲) and slow (long) (○) components of the emission decay
are represented. λexc = 405 nm. Emission collected at 613 nm. 159
(MV2+). Both fast (short) (▲) and slow (long) (○) components of the emission decay
are represented. λexc = 405 nm. Emission collected at 613 nm. 160
Figure SM V.18 – Stern-Volmer emission intensity (●) and lifetime quenching plot for
C6+DNA (ratio 1:30) in the presence of increasing amounts of methyl viologen
(MV2+). Both fast (short) (▲) and slow (long) (○) components of the emission decay
are represented. λexc = 405 nm. Emission collected at 613 nm. 161
Figure SM V.19 – Stern-Volmer lifetime quenching plot for C3+DNA (ratio 1:30) in the presence of increasing amounts of ethidium bromide (ETBr). Both fast (short) (●)
and slow (long) (▲) components of the emission decay are represented. λexc = 405
nm. Emission collected at 610 nm. 162
Figure SM V.20 – (A) Absorption spectra of C1, 10 μM in TRIS buffer, in the absence (---) and presence (—) of increasing amounts of CT-DNA (ratio DNA/Ru: 0 –
10, in base pairs). [DNA] = 2.82 mM. (B) Emission spectra of C1, 10 μM in TRIS
buffer, in the presence of increasing amounts of CT-DNA (ratio DNA/Ru: 0 – 10, in
base pairs). λexc = 370 nm. [DNA] = 2.82 mM. 163
Figure SM V.21 – (A) Absorption spectra of C2, 10.5 μM in TRIS buffer, in the
absence (---) and presence (—) of CT-DNA (ratio DNA/Ru = 30, in base pairs). (B)
Emission spectra of C2, 10.5 μM in TRIS buffer, in the absence (---) and presence
(—) of CT-DNA (ratio DNA/Ru = 30, in base pairs). λexc = 370 nm. [DNA] = 2.82 mM. 164 Figure SM V.22 – (A) Absorption spectra of C3, 9.43 μM, in TRIS buffer (···) and
with DNA 1:30 (—). (B) Emission spectra of C3, 9.43 μM, in TRIS buffer, pH = 7
(normal lines) and with CT-DNA 1:30 (bold lines). λexc = 340 nm (---), 370 nm (···) and
465 nm (—). 165
Figure VI.1 - ORTEP view (ATOMS) of compound 1 with partial labeling scheme. Only one molecule of the asymmetric unit is presented, for clarity. The ellipsoids enclose 50% of the electronic density. Dashed lines indicate intramolecular hydrogen
bonds. 176
Figure VI.2 – Packing diagram of compound 1 in projection in the (a,c) sheet. Only
iron atoms are represented as spheres. 178
Figure VI.3 – (A) Absorption spectra of compound 1, 10 μM in CH2Cl2, in the presence of increasing amounts of Zn2+. Inset: changes in the absorption of 1 at 340
nm (●) and 550 nm (▲) as a function of the number of Zn2+equivalents. (B) Emission
Zn2+. λexc = 340 nm. Inset: changes in the emission of 1 at 455 nm, as a function of
the number of Zn2+equivalents. 179
Figure VI.4 – Emission spectra of compound 1, 10 μM in CH2Cl2, in the presence of increasing amounts of Cu2+. λexc = 340 nm. Inset: changes in the emission of 1 at
455 nm, as a function of the number of Cu2+ equivalents. 180
Figure VI.5 – (A) Emission spectra of compound 3, 10 μM in CH2Cl2, in the presence of increasing amounts of Zn2+, λexc = 360 nm. Inset: changes in the emission of 3 at
475 nm (●), as a function of the number of Zn2+ equivalents. (B) Emission spectra of 3, 10 μM in CH2Cl2, in the presence of increasing amounts of Cu2+. λexc = 360 nm. Inset: changes in the emission of 3 at 462 nm (○), and 500 nm (▲) as a function of
the number of Cu2+ equivalents. 181
Figure VI.6 – Emission spectra of 4, 5 μM in DMSO, in the presence of increasing
amounts of H2O. λexc = 330 nm. 182
Figure SM VI.1 – Absorption (A) and emission (B) spectra of 1 (—), 2 (---) and 3 (···) in CH2Cl2. [1] = [2] = [3] = 10 μM. λexc = 340 nm for 1, 390 nm for 2, and 360 nm for 3.
Room temperature. 190
Figure SM VI.2 – Absorption and emission spectra of compound 4, 5 μM in DMSO.
λexc = 330 nm. 190
Figure SM VI.3 – Absorption and emission spectra of the precursor 8-aminoquinoline, in different solvents: acetonitrile (—), ethanol (---), DMSO (···),
dichloromethane (▬). (λexc = 345 nm, room temperature). 191
Figure SM VI.4 – (A) Absorption spectra of compound 2, 10 μM in CH2Cl2, in the presence of increasing amounts of Zn2+. Inset: changes in the absorption of 2 at 390
nm (●) as a function of the number of Zn2+ equivalents. (B) Emission spectra of 2, 10
μM in CH2Cl2, in the presence of increasing amounts of Zn2+. λexc = 390 nm. Inset: changes in the emission of compound 2 at 462 nm (○), and 500 nm (▲) as a function
of the number of Zn2+ equivalents. 191
Figure SM VI.5 – Emission spectra of compound 2, 10 μM in CH2Cl2, in the presence of increasing amounts of Cu2+. λexc = 390 nm. Inset: changes in the emission of
Index of Schemes
Scheme I.1 – Imine synthesis. 16
Scheme I.2 – Dioxotetraaza PET sensor for Cu(II). 17 Scheme II.1 – Examples of crown ether ligands used for transition metal-alkaline
metal combinations. 41
Scheme II.2 – Synthesis of L1 and L2 receptors, and computer drawn structures for both ligands produced with HYPERCHEM version 7.0, for illustration purposes only
(bottom). 43
Scheme IV.1 – Synthesis of ligand InTREN (L). 84
Scheme V.1 – Synthesis of phenanthroline-derived ligands. 121
Scheme V.2 – Ruthenium(II) Complexes. 125
Index of Tables
Table I.1 – Cation diameters for alkali metals and crown ether cavity sizes. 14 Table IV.1 – Calculated relative free energies in solution for the different conformers
discussed in the text. 92
Table IV.2 – Calculated TD-DFT low-energy singlet excitation energies, wavelengths
and oscillator strengths (OS) and experimental data for L. 94
Table IV.3 – Calculated TD-DFT low-energy singlet excitation energies, wavelengths
and oscillator strengths (OS) and experimental data for [ZnL]2+·H2O. 96
Table SM IV.1 – Calculated TD-DFT low-energy singlet excitation energies, wavelengths and oscillator strengths (OS) and experimental data for [ZnL]2+. 112
Table V.1 – Ligand characterization data. 126
Table V.2 – MLCT (d-π*) absorption and emission maxima, molar absorption coefficients (in Tris buffer) and fluorescence quantum yields (in air-equilibrated
DMSO) of complexes C1 to C6. 127
Table V.3 – Luminescence lifetimes of 1:30 C3:DNA at different MV2+ concentrations.
[C3] = 4.90 μM. λexc = 405 nm. λem = 610 nm. [DNA] = 2.82 mM. [MV2+] = 10 mM. 134
Table V.4 – Luminescence lifetimes of 1:30 C5:DNA at different MV2+ concentrations.
[C5] = 10.5 μM. λexc = 405 nm. λem = 613 nm. 135
Table SM V.1 – Luminescence lifetimes of C3 at different Ru:DNA ratios. [C3] = 4.90
μM; λexc = 405 nm; λem = 610 nm. [DNA]bp = 2.82 mM. 143 Table SM V.2 – Luminescence lifetimes of C5 at different Ru:DNA ratios. [C5] = 10.5
μM. λexc = 405 nm. λem = 613 nm. [DNA]bp = 2.02 mM. 144
Table SM V.3 – Luminescence lifetimes of C4 at different Ru:DNA ratios. [C4] = 9.85
μM. λexc = 405 nm. λem = 613 nm. [DNA]bp = 2.02 mM. 146
Table SM V.4 – Luminescence lifetimes of C6 at different Ru:DNA ratios. [C6] = 10.0
μM. λexc = 405 nm. λem = 613 nm. [DNA]bp = 2.02 mM. 149
Table SM V.5 – Luminescence lifetimes of 1:30 C3:DNA at different ETBr
concentrations. [C3] = 4.90 μM. λexc = 405 nm. λem = 610 nm. [DNA] = 2.82 mM.
[ETBr] = 1 mM. 153
Table SM V.6 – Luminescence lifetimes of 1:30 C3:DNA at different K4Fe(CN)6
concentrations. [C3] = 4.90 μM. λexc = 405 nm. λem = 610 nm. [DNA] = 2.82 mM.
Table SM V.7 – Luminescence lifetimes of 1:30 C4:DNA at different MV2+
concentrations. [C4] = 9.85 μM. λexc = 405 nm. λem = 613 nm. [DNA] = 2.02 mM.
[MV2+]stock = 5 mM. 157
Table SM V.8 – Luminescence lifetimes of 1:30 C6:DNA at different MV2+
concentrations. [C6] = 10.0 μM. λexc = 405 nm. λem = 613 nm. [DNA] = 2.02 mM.
[MV2+] = 5 mM. 159
Table SM V.9 – Luminescence lifetimes of C1 in TRIS buffer in the absence and presence of CT-DNA (ratio 1:30). [C1] = 10 μM. λexc = 371 nm. λem = 610 nm. 164 Table SM V.10 – Luminescence lifetimes of C2 in different media. [C2] = 10 μM. λexc
= 371 nm. λem = 610 nm. 165
Table SM V.11 – Luminescence lifetimes of C3 in different media. [C3] = 9.43 μM.
λexc = 371 nm. λem = 610 nm. 166
Table VI.1 – Absorption and emission maxima and molar absorption coefficients of
compounds 1 to 4. 174
Table VI.2 – Fluorescence quantum yields of compounds 1 to 4, in different solvents.
Parent: quinine sulphate in 0.5 M H2SO4. 175
Table VI.3 – Analysis of Hydrogen Bonds in compound 1 with PLATON (Equivalent
Position Code: $1 = 1-x,-1-y,-z ; $2 = -x,-2-y,-z). 177
Chapter I
In this chapter are presented and explained some definitions and concepts that serve as a complement for the introductions of the remaining chapters. Throughout this thesis, molecular fluorescence is used as a tool for chemical sensing; as a consequence, the approach for this chapter is to make a bridge between photophysics and its applications in sensing, instead of an exhaustive and detailed description of the basic principles of photophysics and photochemistry.
I.1 Concept of chemosensor.
The desire and need to monitor everything that surrounds us have led to a growing effort of developing something that can receive information and turn it into a form which is compatible with our perception, knowledge and understanding. This would be the simplest and most common definition of what a sensor, in general, might be. Sensors are not only man-made; our body, for example, is provided with a vast number of sensors that respond to stimuli such as light, heat, odor, etc.
Unfortunately, these intrinsic sensors are not sufficiently capable of providing us with objective knowledge about what happens inside and outside of our body and what benefits or threats us as individuals, or the society as a whole. Being able to tell the difference between useful and harmful compounds, or to monitor the environment by searching for heavy metal pollutants in waters or the presence of bacteria in drinking water, are achievements only accomplishable with the help of man-made sensors.
Among the great variety of sensors synthesized by man, there are those which allow us to detect chemical species. This particular type is called a chemical sensor,
and is defined by IUPAC as ―a device that transforms chemical information, ranging
from the concentration of a specific sample component to total composition analysis,
into an analytically useful signal‖.1 This device can be either macroscopic (e.g. a pH measuring electrode) or microscopic, which leads us to the next definition. In a strict sense, a chemosensor is a molecule (or an assembled supra-molecular unit) that can selectively bind the target analyte and furnish information about this binding, and thus act as a microscopic chemical sensor.
to modify the geometry of the system and tune the electronic interaction between the two other components.2
Figure I.1 – Schematic representation of a chemosensor.
Chemosensors can be classified according to the nature of the signal emitted by the active unit. They can be, for example, electrochemical, optical or calorimetric. In optical sensors, a spectroscopic measurement is associated with the recognition process, e.g. absorbance, reflectance or luminescence measurements.
I.2 Fluorescent chemosensors. Advantages and general classification.
Recalling the general representation of a chemosensor given in Section I.1, the active unit in the case of fluorescent chemosensors is called a fluorophore, and it is responsible for converting the information (presence of an analyte) into an optical signal which is then expressed through changes in the photophysical properties of the fluorophores.
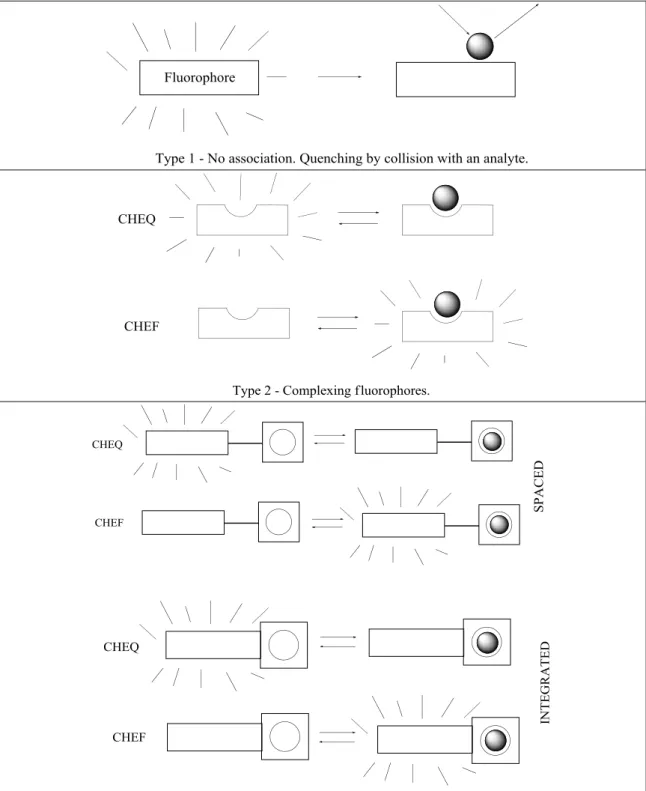
Three types of fluorescent chemosensors8 can be distinguished (Figure I.2): - Type 1: fluorophores that experience fluorescence quenching motivated by collision with an analyte (e.g. O2).
- Type 2: fluorophores able to bind the analyte in a reversible manner. In the case of the analyte being a proton, the term ―fluorescent pH indicator‖ is employed. If it is an ion, the term ―fluorescent chelating agent‖ is normally used. Two processes can occur upon analyte binding: Chelation Enhancement of Quenching (CHEQ), which means that the fluorescence emission is quenched, and Chelation Enhancement of Fluorescence (CHEF), where an increase in the emission intensity is observed. These compounds, in which the fluorophore is simultaneously responsible for binding and signaling, are usually called fluorogenic (in the case of CHEF).
Figure I.2 – Main types of fluorescent molecular sensors of ions or molecules.
I.3 Mechanisms of transduction: PET, ESIPT, ET, excimer and exciplex formation, PCT.
reactions that usually do not occur in the ground states are able to take place. From the point of view of chemical sensing, some of these reactions are found to be interesting, since they enable a one-step deactivation of the excited state (quenching) and, sometimes, formation of new emission bands corresponding to the products of these reactions. Upon analyte binding to chemosensors, it is possible to modulate some of these reactions (since they depend on the interaction of reaction sites with enhancers or quenchers of their emission), and thus take advantage of the different mechanisms for signal transduction.
I.3.1 Photoinduced electron transfer (PET).
Absorption of light changes dramatically the redox properties of molecules. As an electron is promoted to a higher energy level, the molecule becomes simultaneously a better electron donor (reducing agent) and a better electron acceptor (oxidizing agent) than it was in its ground state.11 Photoinduced electron transfer(PET) is the process by which an electron is transferred between an excited-state species and a ground-excited-state species. The direction of electron transfer is determined by the oxidation and reduction potential of the ground and excited states, which means that the excited fluorophore can be either the electron donor or the acceptor. This process requires closeness in space of the two species and the matching of their redox potentials. Thus, the distances for this process are much shorter than for FRET (see section I.3.3), since it needs the overlapping of electronic wave functions of both species. Covalent bonding between donor and acceptor via a short spacer can make the process easier to occur.
This process finds vast application in the design of pH indicators and cation sensors. Since the former are out of the scope of this thesis, although the principle is the same for both types, only a brief description of the latter is given.
free form) to that of the fluorophore. This new electron inhibits the decay of the previously excited one, and in this way fluorescence is quenched. Cation binding raises the redox potential of the donor, and the HOMO that was involved in the PET process has now a lower energy (stabilization arising from the dative covalent bonding between the donor and the metal ion, which requires both electrons). As a consequence, PET becomes impossible, and fluorescence intensity is enhanced.
LUMO
HOMO
HOMO
E
EXCITED FLUOROPHORE
FREE RECEPTOR
LUMO
HOMO
HOMO
E
h
EXCITED
FLUOROPHORE RECEPTORBOUND
Figure I.3 – Principle of cation recognition by PET-based sensors.
I.3.2 Excited state proton transfer.
density after light absorption. Molecules that are more acidic or basic in the excited state than in the ground state (photo-acids and photo-bases, respectively) are able to undergo excited state proton transfer upon excitation.
The two excited-state forms can reach an equilibrium on a very short time scale and, in aqueous solution, this equilibrium can be shifted by changing, for example, the solvent pH.
When the same molecule contains both proton-donor and proton-acceptor groups in a close proximity, the solvent loses influence, since the proton can be transferred directly from the acidic site to the basic site. This process is named excited-state intramolecular proton transfer (ESIPT).9 The proton-donor group is commonly a hydroxyl and the basic proton acceptor should be either a heterocyclic nitrogen atom or a carbonyl oxygen. These two groups normally form hydrogen bonds in the ground state, and this bond in the excited state facilitates proton transfer.
I.3.3 Excited state energy transfer.
Two molecules with similar excited-state energies can exchange their energies under certain conditions and through different mechanisms. When the emission spectrum of a fluorophore (donor, D) overlaps with the absorption spectrum of another molecule (acceptor, A), energy transfer occurs. For the sake of simplicity, only non-radiative energy transfer mechanisms will be described.
When the molecules are separated by long distances, an interaction through space occurs, via a transition dipole vector. The electron in the LUMO of the excited donor (D*) returns to the ground state, causing the simultaneous promotion of an electron in the acceptor (A) to a higher excited-state orbital (Figure I.4). The mechanism is analogous to that of electronic excitation produced by the electric vector of a light wave, but in this case the excitation is produced by a transition dipole vector, originated in the relaxation of D* to D. For this reason, the mechanism is designed as Coulombic (dipole-dipole) energy transfer, or resonance energy transfer.10,11 A detailed theory of this mechanism was developed by Förster, so the name Förster resonance energy transfer is also used. This acronym is frequently presented as ―Fluorescence Resonance Energy Transfer‖, which is not correct, since
inversely proportional to the sixth power of the distance between both molecules. As a consequence, FRET can be used to determine distances between donor and
acceptor fluorophores (the so called ―molecular ruler‖).11
LUMO
HOMO
E
1
2
Coulom bic inte
raction
D* A
Figure I.4 – Electron movements taking place in long-range Coulombic energy transfer.
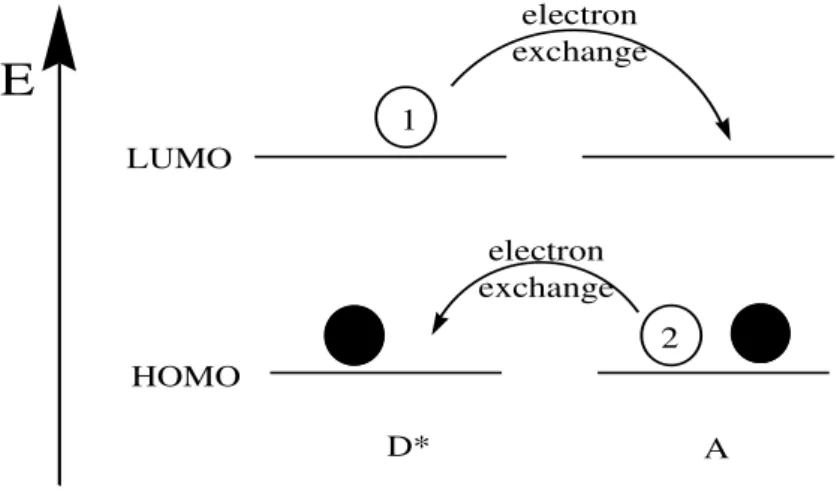
In addition to the previously mentioned mechanism, there is another one that involves close approach between the two molecules. The so called exchange mechanism of transfer, or Dexter mechanism, requires overlap between regions of electron density, so that electrons are exchanged between the two molecules. It
LUMO
HOMO
E
1
2
D* A
electron exchange
electron exchange
Figure I.5 – Electron movements taking place in short-range energy transfer by the exchange mechanism.
It is important to note that, while in PET the excited state can be an electron donor or an acceptor, in energy transfer it is exclusively an energy donor.
I.3.4 Excimer and exciplex formation
A molecule in the excited state can associate with an unexcited molecule like itself, giving rise to a dimer in the excited state,8,9 which is called excimer (from
―excited dimer‖). The excimer emission spectrum differs substantially from that of monomers; it is normally broad, shifted to longer wavelengths and does not show vibrational resolution. One famous example is the excimer of pyrene (see Chapter III).
If the collision takes place between molecules that differ in structure (e.g. an electron donor and an acceptor), an excited state complex is formed, and is named
exciplex (from ―excited complex‖).
I.3.5 Photoinduced charge transfer (PCT)
This process is, in principle, also an electron transfer. The two (PET and PCT) phenomena are easily distinguished by their absorption and emission spectra.8 In PET, strong quenching takes place and no spectral shifts are observed. On the other hand, the PCT states are usually fluorescent but exhibit a Stokes shift, caused by the change in the dipole moment that results from PCT from an electron-donating group (usually an amino group) to an electron-withdrawing group (conjugated to the former).
In terms of cation sensing, it is predictable that a complexed cation will diminish the electron-donating character of the electron donor, causing a reduction in conjugation and a consequent blue-shift of the absorption spectrum. Oppositely, if the acceptor group (e.g. a carbonyl group) interacts with a cation, its electron-withdrawing character is enhanced, the conjugation is increased, and a red-shift in the absorption spectrum is observed. The fluorescence spectra are usually shifted in the same way as the absorption spectra.
I.4 Cation sensing
Cations are extremely important in fields such as biology, chemistry, medicine and environment. Metal cation roles in biological processes range from maintaining potentials across cell membranes to triggering muscle contraction, among other functions. They also have catalytic functions at the active sites of many enzymes. On the other hand, pollutant metals like lead, mercury or cadmium show the undesirable side of the coin, in environmental terms.
Due to their importance in so many areas, the chemistry of cation complexation has played an important role in the origin of the field of molecular recognition. A great range of selective receptors for cationic species has been prepared and, by coupling those receptors (ionophores) to the adequate fluorophores, powerful chemosensors have been developed.13,14 The characteristics of the ionophore in terms of the ligand topology and the number and nature of the complexing atoms must be adequate to the type of cation being studied.
I.4.1. Crown ethers
The crown ethers are simultaneously some of the simplest and most attractive macrocyclic (constituted by a large ring) ligands, and can be applied both in the sensing of metal ions or neutral molecules. These compounds are constituted by a cyclic array of ether oxygen atoms linked by organic spacers, normally —CH2CH2—
groups.15 Comparing the metal coordinating ability of simple ethers (e.g. diethyl ether) with crown ethers, it is observed that the latter bind much more effectively, due to the simultaneous chelate and macrocyclic effects.16 The chelate effect states that bidentate ligands (e.g. ethylenediamine) form more stable complexes than the corresponding unidentate ligands. The macrocyclic effect has to do not only with the chelation of the metal by multiple binding sites, but also with a certain ―pre
-organization‖ or arrangement of the binding sites in space, which require less energy
to perform the chelation.
Crown ethers have been firstly discovered by Pedersen,17 in the mid-1960s, when he accidentally synthesized the compound dibenzo-18-crown-6 (Figure I.6). This nomenclature was suggested by Pedersen in his pioneering papers, not only because the systematic names to these compounds were extremely long, but also
due to their ―crown-like‖ conformation in molecular models. In this particular case,
―18‖ refers to the total number of atoms in the macrocycle and ―6‖ to the number of
oxygen atoms in the ring.
O
O
O
O O
O
Figure I.6 – Dibenzo-18-crown-6.
a way that if the cavity is too large (e.g. 18-crown-6) for a very small cation (e.g. Na+),
the crown ether becomes distorted, ―wrapping‖ itself around the metal in order to
maximize the electrostatic interactions, but simultaneously increasing the ring strain and, consequently, its stability.
Cation Diameter (Å) Crown Ether Cavity Diameter (Å)
Li+ 1.36 12-crown-4 1.2 – 1.5
Na+ 1.94 15-crown-5 1.7 – 2.2
K+ 2.66 18-crown-6 2.6 – 3.2
Cs+ 3.34 21-crown-7 3.4 – 4.3
Table I.1 – Cation diameters for alkali metals and crown ether cavity sizes.
If oxygen atoms in the crown moiety are replaced with softer donor atoms, like
nitrogen or sulfur, transition metals can also be sensed, according to Pearson’s rules
for hard and soft acids and bases.19
Many crown-containing sensors are based in PET sensing mechanism, like the ones developed by de Silva and coworkers.4 One such example is shown in Figure I.7,20 where the complexing of K+ hinders the photoinduced electron transfer from the crown donor atoms to the anthracene fluorophore, resulting in a strong CHEF effect.
O O
N
O O
O
There are also crown-containing sensors whose mechanism is based on PCT, e.g. those where a nitrogen atom contained in an azacrown moiety is conjugated to an electron-withdrawing group. In the case of the sensor represented in Figure I.8,21 upon complexation by alkaline-earth metal cations the absorption and emission spectra experienced hypsochromic shifts, following the mechanism explained in section I.3.5.
O O
N O O
O NC
CN
Figure I.8 – Crown-containing PCT sensor.
Since Pedersen’s pioneer work in this field, an enormous variety of
functionalized and derivatized crown ethers have been developed as sensors for ions.22,23 Some very interesting systems include simultaneous recognition of a transition metal ion and an alkali or alkaline earth metal ion,24,25,26,27 which is very useful to modulate different interesting properties.
Other useful applications of crown ethers include their uses as artificial membranes28 (ionic channels), new smart materials,29 active components of molecular machines30 and biomedical applications as potential antitumor agents.31
I.4.2. Schiff bases
A Schiff base (also called imine, or azomethine) is a functional group with general formula RR’C=N-R’’, where the nitrogen atom is never connected to a
dehydration, the presence of dehydrating agents (such as MgSO4) usually favours the formation of the desired product. During the purification step, however, some precautions must be taken in order to avoid degradation. Silica gel chromatography columns can cause hydrolysis of the imine; the alternative purification method is crystallization.32
R-NH2 + R
O R
R
N H
OH R
R
R
R N
R
hemiaminal
-H2O
imine
Scheme I.1 – Imine synthesis.
Schiff bases have been very important in the development of coordination chemistry,33,34 in part due to their capability to form stable complexes35,36,37 with the majority of the transition metals. The ability to stabilize most metals in different oxidation states also enhances their performance in catalytic processes.32 In the field of bioinorganic chemistry, Schiff base complexes have received careful attention, due to their role in providing synthetic models for the metal-containing sites in metallo-proteins and enzymes.
Regarding their applications in chemical sensing, more specifically in cation detection, Schiff bases offer the advantage of possessing a good electron-donating group, the nitrogen atom, that with its lone electron pair can easily coordinate metal ions.38 Upon coordination, the properties of the system can be modulated, accordingly to the type of cation and its oxidation state.39,40 Two different behaviors can be observed, for example, for Zn(II) and Cu(II) upon coordination to two PET based systems.
OH
N NH2
Figure I.9 – Hydrazone PET chemosensor for Zn(II).
The compound is weakly fluorescent in the absence of Zn(II), probably due to PET of the nitrogen lone pair to the pyrene fluorophore. After complexation, it experiences a large fluorescence enhancement, which can be assigned to blocking
of the PET process. This is a typical case of an ―OFF-ON‖ system, which means it experiences a CHEF effect upon cation binding. It is noteworthy that this particular system was applied in monitoring the level of Zn2+ in pancreatic cells, offering a very important biological application.
A different situation has been verified in the system depicted in Scheme I.2,43,44 applied in Cu(II) sensing:
Scheme I.2 – Dioxotetraaza PET sensor for Cu(II).43
moiety. It is worth noting that this ligand is not a Schiff base, but shows a similar behavior, since all the nitrogen atoms are involved in the coordination.
The fusion between Schiff bases and other coordinating entities (e.g. a crown-ether moiety)45 expands the number of metal ions that can be detected by the same molecule simultaneously. Moreover, if the molecule is functionalized with a group that can contribute at the same time with coordinating atoms and intrinsic fluorescence, the possibilities are enhanced. An example of such groups is thiophene and its
oligomers (oligothiophenes).46 These compounds offer many advantages as
fluorescent markers, since their fluorescence frequencies can be tuned in the whole visible range,47 and their applications include recognition events in biological systems and ion sensing.48
Many interesting Schiff base systems can be found in the development of ion selective membrane sensors,49 among other applications.
The possible instability of Schiff bases and their tendency to hydrolysis, which could be considered as drawbacks, are easily overcome by treating the imine with adequate reducing agents, with the consequent formation of the corresponding amine derivative, which is less sensitive to hydrolysis, more flexible and has an increased water solubility. However, upon reduction of the imine, the interaction with
metals will become weaker, because the back-bonding interactions with the C=N π*
orbital will be lost.16
I.5 Ruthenium(II) polypyridyl complexes as luminescent probes for DNA.
Among the numerous classes of luminescent metal complexes, ruthenium(II)
introduction to its electronic configuration and photophysical processes upon excitation by light.
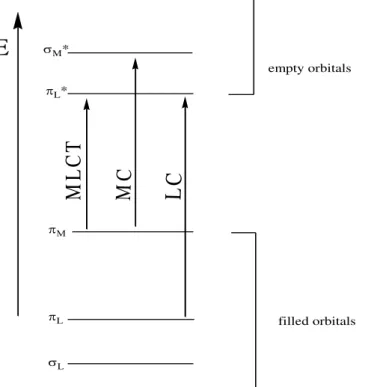
Ru2+ is a d6 metal ion, and the polypyridine ligands possess σ donor orbitals localized on the nitrogen atoms and π donor and π* acceptor orbitals more or less
delocalized on aromatic rings. In a simplified molecular orbital diagram for this type of complexes (Figure I.10) are represented the types of transitions that can take place after irradiation. Promotion of an electron from a πM metal orbital to the πL* ligand orbitals originates the singlet metal-to-ligand charge transfer (1MLCT) excited state, that then experiences intersystem crossing and populates the triplet 3MLCT state.50,51 The complex can then follow
M
L
C
T
M
C
L
C
E
empty orbitals
filled orbitals
L L
L*
M*
Figure I.10 – Simplified molecular orbital diagram for Ru(II) polypyridyl complexes in octahedral symmetry.
slow radiationless transitions and for this reason exhibits relatively long lifetime and intense luminescence emission.
Adding to the aforementioned properties, the great stability and flexibility of these complexes when compared to other metallic compounds is enormous, which opened the door to a vast synthetic chemistry. Due to all these extraordinary features, Ru(II) polypyridyl complexes have found applications in a great number of areas, such as solar energy applications,54 molecular devices,55,56 optical sensing,57 polymer modified electrodes,58 electroluminescent displays, and interactions with nucleic acids and other biomolecules.
Concerning their use as optical chemosensors, the most common applications are sensing of oxygen,59 carbon dioxide60 and pH.61,57 Also frequent are applications in anion sensing,62 by functionalizing the polypyridyl ligands with anion receptors, and cation sensing,63 by inserting recognition units such as crown ethers. Figure I.11 shows an example of a chemosensor in which one of the bipyridyl ligands is functionalized with a large macrocyclic receptor unit containing five amine groups:64
N N N
N
N N Ru
H
N HN
HN HN N H
2+
Figure I.11 – Ru(II) polypyridyl chemosensor functionalized with a macrocyclic polyamine.
This polyamine unit is capable of complexing cationic or anionic substrates, depending on its level of protonation.
ago.65,66,67,68,69 The principle of interaction between Ru(II) polypyridyl complexes with DNA has been a very discussed topic,70,71 since complexes are positively charged and can interact with the negatively charged phosphate backbone (for details on DNA structure, see section I.6.2) and can also bind through intercalation of a planar portion of the molecule into the stacking of bases (provided that at least one of the ligands has a large planar heteroaromatic system).72 Figure I.12 shows a simplified illustration of an intercalating complex with respect to the DNA double helix:65
Figure I.12 – Simplified representation of an intercalating complex oriented with respect to the DNA double helix.65
N N N
N
Ru
2+
N
N N
N
Figure I.13 – Structure of [Ru(bpy)2(dppz)]2+.
This particular complex behaves as a ―light-switch‖ for DNA in aqueous
solution,73 since it is practically non-emissive in its free form, but strongly enhances its fluorescence emission upon binding to DNA. The explanation for this behavior lies in the lowest-lying excited state swap that takes place in protic solvents (when the complex is not bound to DNA, the polarity of the solvent prompts the formation of a new MLCT species, which decays non-radiatively),74 combined with the intercalative binding mode to DNA of Ru(II)-dppz and related complexes,75,76,77 that protects them from quenching by oxygen and solvent molecules. Very recently, these complexes have been studied as multifunctional biological agents for direct DNA imaging in living cells.78 Absorption MLCT bands in the visible region of the spectrum allow a wide range of biological applications. Through DNA binding it is possible to develop new chemotherapeutic agents, as an alternative to the more toxic and long time used Pt(II) compounds.


![Figure III.3.- Absorption spectra of L1 in the presence of Ni(II) (up) and Pd(II) (down) in the concentration range of 0 - 3 equivalents, in dichloromethane solution ([L1] = 1](https://thumb-eu.123doks.com/thumbv2/123dok_br/16483476.732625/98.892.231.554.126.800/figure-absorption-spectra-presence-concentration-equivalents-dichloromethane-solution.webp)