M
ASTER
A
CCOUNTING
,
T
AXATION AND
C
ORPORATE
F
INANCE
M
ASTER
´
S
F
INAL
W
ORK
D
ISSERTATION
A
N ESSAY ON STRATEGIC USE OF NON
-GAAP
REPORTING AND
ACCRUAL
-
BASED EARNINGS MANAGEMENT
F
RANCISCO
A
RANDA
C
ORREIA
M
ASTER
A
CCOUNTING
,
T
AXATION AND
C
ORPORATE
F
INANCE
M
ASTER
´
S
F
INAL
W
ORK
D
ISSERTATION
A
N ESSAY ON STRATEGIC USE OF NON
-GAAP
REPORTING AND
ACCRUAL
-
BASED EARNINGS MANAGEMENT
F
RANCISCO
A
RANDA
C
ORREIA
S
UPERVISION:
P
ROFESSORD
OUTORA
LCINOT
IAGOC
RUZG
ONÇALVESi
ABSTRACT
This study aims at analysing the association between Earnings Management and non-GAAP reporting practices taking into account an apparent increase of the managers´ desire in disclosing non-GAAP earnings (Jeanjean, Martinez and Davrinche, 2018). I perform a research based on data collected from Factiva and Amadeus databases. The study sample is composed by 2 122 listed companies, from 14 European countries, covering a time horizon from the years 2011 to 2018. To measure Earnings Management, I use the Jones model (1991), adjusted by Kothari, Leone and Wasley (2005), in order to estimate abnormal accruals. Empirical findings suggest that this kind of disclosures is correlated with higher levels of accrual-based earnings management (AEM) signifying that a disclosure of non-GAAP numbers follows an opportunistic motive. I also provide evidence indicating that the practice of non-GAAP reporting is correlated with downward AEM indicating that are strategically used as complement tools. This assumption is not consistent with Doyle, Jennings and Soliman (2013) and Black, Christensen, Taylor and Schmardebeck (2017) conclusions. Additionally, the obtained results suggest that executives who managed their earnings downwards are more likely to disclose non-GAAP reports. Moreover, the company´s complexity and the presence of a Big 4 auditing firm influence the practice of non-GAAP disclosures. My work contributes to extant research enabling the development of knowledge about an association of these two widely addressed academic fields, so far weakly explained by prior research.
Keywords: Earnings management; Accruals; Non-GAAP earnings; Non-IFRS earnings; Europe
ii
RESUMO
O propósito deste estudo é analisar a associação entre gestão de resultados e a divulgação de resultados non-GAAP tendo em conta o aparente aumento do desejo, por parte dos gestores, em divulgar este tipo de resultados (Jeanjean, Martinez e Davrinche, 2018). Foi realizada uma pesquisa baseada em dados obtidos através das bases de dados
Factiva e Amadeus. A amostra do estudo é composta por 2 122 empresas cotadas, de 14
países europeus, cobrindo um horizonte temporal dos anos de 2011 a 2018. De modo a calcular a medida de gestão de resultados, foi utilizado o modelo de Jones (1991), ajustado posteriormente por Kothari, Leone and Wasley (2005), de maneira a estimar
accruals discricionários. Os resultados mostram que a divulgação de relatórios non-GAAP se rege por um motivo oportunista, tendo em conta que, forneço evidência empírica
que indica que este tipo de divulgação está correlacionado com altos níveis de gestão de resultados baseada em accruals (AEM). As descobertas empíricas sugerem ainda que, a prática de divulgação non-GAAP está relacionada com AEM negativa, indicando que são estrategicamente utilizadas como métodos complementares. Estes resultados não são consistentes com as conclusões obtidas por Doyle, Jennings and Soliman (2013) e Black, Christensen, Taylor e Schmardebeck (2017). Tendo em conta a direção da gestão de resultados baseada em accruals, os resultados obtidos indicam que os gestores que manipulam os seus resultados financeiros com o intuito de reduzi-los são mais propensos a divulgar relatórios non-GAAP. Adicionalmente, a complexidade da empresa, e a presença de uma firma de auditoria Big 4 são vistos como fatores que influenciam a prática de divulgação de relatórios non-GAAP. As conclusões obtidas através desta pesquisa permitem o desenvolvimento do conhecimento inerente a uma, até então debilmente explicada, associação entre dois campos académicos largamente abordados pela literatura existente.
Palavras-Chave: Gestão de resultados; Accruals; Resultados GAAP; Resultados non-IFRS; Europa
iii
ACKNOWLEDGMENTS
First, I want to thank Professor Tiago Gonçalves for his encouragement and precious guidance.
I want to thank my family for their unconditional support.
Finally, I would like to thank all my friends who accompanied and supported me through this challenging journey.
iv TABLE OF CONTENTS Abstract ... i Resumo ... ii Acknowledgments ... iii Table of Contents ... iv Table of Figures ... v Glossary ... vii 1. Introduction ... 1 2. Literature Review ... 3
2.1. Accrual Earnings Management, Real Earnings Management and Classification Shifting ... 4
2.1.1. The impact of Financial Crisis on Earnings Management ... 6
2.2 Non-GAAP Earnings ... 7 2.1.1. No-GAAP Regulation ... 11 2.2 Hypotheses Development ... 12 3. Methodology ... 15 3.1 Sample Characterization ... 15 3.2 AEM Measure ... 16 3.3 Empirical Models... 17 3.3.1. Control Variables ... 19 4. Results ... 20 4.1 Descriptive Statistics ... 20
4.2 Person´s Correlation Matrix ... 21
4.3 Regression Results ... 23
5. Additional Analysis ... 28
5.1 The effect of companies from France and Germany ... 28
5.2 Direction of accrual-based earnings management and non-GAAP reporting 31 6. Conclusion ... 32
References ... 35
v TABLE OF FIGURES
TABLE I – Descriptive Statistics. ... 21
TABLE II – Pearson´s Correlation Matrix. ... 22
TABLE III – Results from regression models (ABS_ACC and ACC). ... 25
TABLE IV – Results from logit regression model ... 27
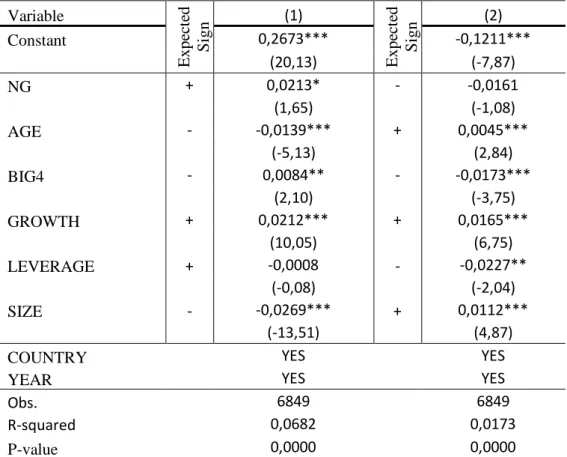
TABLE V– Results from regression models (ABS_ACC and ACC) without French and German companies. ... 29
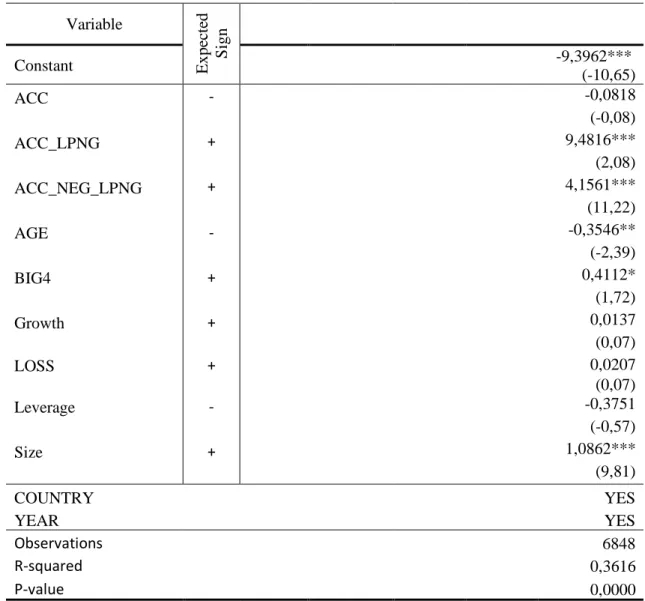
TABLE VI – Results from logit regression model without French and German companies.. ... 30
vi GLOSSARY
AEM – Accrual Earnings Management
CESR – Committee of European Securities Regulators
EBITDA – Earnings Before Interests, Taxes, Depreciations, and Amortizations EPS – Earnings per Share
ESMA – European Securities and Markets Authority IFRS – International Financial Reporting Standards
IOSCO – International Organization of Securities Commission GAAP – General Accepted Accounting Principles
R&D – Research & Development REM – Real Earnings Management
SEC – Securities and Exchange Commission SOX – Sarbanes-Oxley Act
1 1. Introduction
Earnings are a recognised reflection of the financial performance of a company. Managers are allowed to strategically use the relative flexibility given by GAAP (or IFRS when applied) to manage their earnings, although without straying from implicit rules. The purpose of these manipulations differs but it is generally associated with the achievement of operational, financial or investing objectives and related to an illustration of a wealthy image of the company. This practice is known as earnings management. Non-GAAP reporting is considered as an alternative option to this behaviour, characterised by the exclusion of unusual events and arbitrary accounting adjustments from GAAP earnings. This kind of reports is available, for all financial information users, through unconventional routes, such as press releases.
This research aims at analysing a possible strategic association between earnings management practices and non-GAAP earnings reporting. Therefore, the main objective of this study is exploring to what extent the practice of earnings management may influence, or not, a disclosure of non-GAAP earnings.
Both practices have a rich body of previous literature. There is a considerable number of alternative earnings management mechanisms managers could apply including accrual earnings management (AEM), real earnings management (REM) and classification shifting. All previously mentioned tools are used within GAAP, that is, are regulated and several rules and principles must be followed. However, companies have an alternative way to manage their earnings beyond regulated disclosure channels through a report of the well-known non-GAAP earnings. This type of disclosure is an attractive alternative perception management instrument since external auditors are not required to audit non-GAAP earnings, which grows the potential to be used for opportunistic purposes. In fact, in Europe, there are just recommendations attend to this practice, and no mandatory rules regulate non-GAAP reporting.
To measure earnings management, I use the total and absolute value of abnormal accruals using the modified Jones model (Dechow, Sloan and Sweeney, 1995) developed later by Kothari, Leone and Wasley (2005), which is widely used in literature.
2
The difficulty in analysing this kind of disclosures lies in differentiating honest from opportunistic disclosures (Black, Christensen, Kiosse and Steffen, 2017). Prior research debates that managers use non-GAAP earnings to give transparency to their numbers or, in opposition, these type of disclosures are used to avoid reporting losses or to portray better performance as an opportunistic move (Doyle, Lundholm and Soliman, 2003; Christensen, 2007; Black and Christensen, 2009; Malone, Tarca and Wee, 2015).
There is a probability that both metrics are used as substitutes of each other, consistent with Doyle, Jennings and Soliman (2013) finds, who provided statistical evidence supporting the idea that AEM and non-GAAP reporting are considered as substitutes and not complement tools. Supported by this idea, I perform a test to investigate whether these practices simultaneously applied promote a substitution effect.
Besides, there is a possible sequential notion behind the occurrence of these events, since a report of non-GAAP earnings can be made after the decision to use AEM. This idea is supported by the fact that the implicit adjustments in non-GAAP numbers do not affect actual operating and financial reported GAAP earnings. Therefore, I investigate what level of earnings management will lead to non-GAAP reporting considering a timeline of events.
The main motivation related to this research is linked to an apparent increase in managers´ desire to disclose non-GAAP numbers (Jeanjean, Martinez and Davrinche, 2018). This study contributes to extant research linked with both academic fields: earnings management within GAAP and non-GAAP reporting. Several other studies compare non-GAAP and GAAP earnings metrics to explore which one is more relevant for assessing company´s performance (Brown and Sivakumar, 2003; Marques (2006) and, more recently, Black and Christensen, 2009; Doyle et al., 2013; Black, Christensen, Kiosse and Steffen, 2017). There is prior research that investigates the strategical association between earnings management and non-GAAP reporting (Doyle et al., 2013; Black, Christensen, Taylor and Schmardebeck, 2017). While Doyle et al. (2013) settled a time horizon from 1988 to 2009 in their main analysis, Black et al. (2017) limit their tests to observations in the sample of 1998 through 2006. In this study, I use a research sample based on post-crisis observations since this event created a deviation of the common use of earnings management (Filip and Raffoumier, 2012; Iatridis and Dimitras,
3
2013; Dimitras, Kyriakou and Iatridis, 2015). Moreover, Doyle et al. (2013) and Black et
al. (2017) sample was built on a US companies’ basis. In 2003, the Securities Exchange
Commission (SEC) creates a regulation – Regulation G – aimed at controlling and regulating the measure of non-GAAP earnings. In Europe, several recommendations aim also to promote the transparency of non-GAAP earnings. Nevertheless, they are just recommendations and therefore are not mandatory. Thus, the practice of such disclosures may be differently affected by imposed regulation. Consequently, I use a sample composed by data from European listed companies, precisely, a sample of 2 122 listed firms, from 14 European countries.
The results showed that a disclosure of non-GAAP numbers follows an opportunistic motive and suggests that both practices are strategically used as complement tools, inconsistent with both Doyle et al. (2013) and with Black., Christensen, Taylor, Schmardebeck (2017) conclusions. I perform an additional analysis which supports the main analysis results regarding the positive correlation between negative accruals and non-GAAP earnings disclosures. Considering the direction of accrual-based earnings management, the obtained results suggest that executives who managed their earnings downwards are more likely to disclose non-GAAP reports. I also develop an additional test to guarantee the robustness of the obtained results.
This study is divided into six sections. In the second chapter we can find the literature review and the hypotheses of investigation. Chapter 3 refers to the used methodology. Chapter 4 shows the analysis of the obtained results. Chapter 5 describes additional analyses performed. Finally, chapter 6 presents the study`s main conclusions and limitations.
2.LITERATURE REVIEW
There is a countless number of previous researches concerning earnings management. It is possible to find several articles addressing, its causes and consequences (Putra et al., 2018), comparisons and correlations between their different strands (Cohen, Dey and Lys 2008; Badertscher, 2011; Yang, Ying and Zang, 2013), its influence on the quality of earnings themselves (Lo, 2008) or even the relation between the generality of financial information users (auditors, investors or regulators) and manipulated earnings (Miranda, Machado and Macedo, 2018; Safitri, Kustono and Miqdad, 2018). However, only a few
4
are making a direct bridge between earnings management and non-GAAP earnings. There is a considerable number of alternative mechanisms to manage earnings and influence the perception of financial information users, executives could apply, some within and others beyond regulated disclosure channels, including accruals earnings management, real earnings management, classification shifting, and non-GAAP reporting. Since each accounting choice has implicit benefits and costs, it is the net incentive of each one that will determine the final management´s decision. In fact, Marquardt and Wiedman (2003) discussed the potential costs of earnings management organised in two groups: “detected” and “undetected” earnings management, referring to cases that executives use methods to manage earnings that becomes publicly known and to cases that firms use these mechanisms but there is no clear events that would expose its existence to the public. They conclude that the method used by firms to manage earnings depends on a combination of cost and benefits related to each choice and the cost associated to “detected” earnings management tends to be lower. In addition, potential costs linked with such practices may diverge for different income statement´s items. In prior studies, the respective authors usually tend to differentiate recurring from non-recurring items and make their research samples analysis in accordance with both factors (Bradshaw and Sloan, 2002; Palmrose and Scholz, 2004). They find that firms are increasingly defined a large percentage of their expenses as non-recurring.
2.1. Accrual Earnings Management, Real Earnings Management and Classification
Shifting
Accrual Earnings Management (AEM) may be considered an attractive and popular choice, being a measure of earnings distortion, by two main reasons. Firstly, because it has no direct effect on cash flows and, in consequence, it is less probable to have an effect in firm´s future value. Secondly, it can be performed in agreement with GAAP´s standards. However, the reversing feature linked to AEM can arise some problems as the company has to overcome the potential reversal of last period´s accruals management first in order to create impact in the current year (Badertscher, 2011), which may be allied with a decreasingly desire in practice continued AEM over time. In fact, companies become increasingly constrained in use AEM after multiple periods (Bradshaw, Richardson, and Sloan, 2001; Dechow, Hutton, Kim, and Sloan, 2012).
5
Another measure related to earnings management is the real earnings management (REM), which can be classified by a purposeful changing in the timing of an operating, financing or even an investing decision. In other words, is defined as a group of management decisions that diverge from normal business practices (Roychowdhury, 2006). Extant research find evidence that suggests that some executives use REM to achieve strategic targets (Badertscher, 2011; Zang, 2012). Bens, Lin and Sbaraglia, (2002) provide evidence that executives finance the repurchase of stock by reducing R&D expenditure, owing to an apparent fear of earnings per share (EPS) dilution. Thus, if management cuts R&D expenditures to improve net income of the current year, the firm future value may be negatively affected because of the lost opportunities due to decreased R&D. Bhojral, Hribar, Picconi and Mclnnis (2009) shows that companies have worse operating subsequent performance when they try to beat analyst forecast by combining AEM and REM. In contrast, there is evidence suggesting that companies that practice REM have better operating performance in the subsequent three years than firms that do not engage in such practice (Gunny, 2010).
An alternative method mentioned in previous literature is classification shifting. The presence of this management strategy can be validated when managers move and misclassify items within the income statement while net income remains unchanged (McVay, 2006). The most common practice of classification shifting seems to be the action of moving operating expenses to income-decreasing discontinued operations (Barua, Lin, and Sbaraglia, 2010). Haw, Ho and Li (2011) and Zhang and Guo (2016), who analysed a sample composed by Asian companies, defend that classification shifting is used to mislead investors about company´s performance since information users seem to be confused by this measure of earnings management. In conclusion, classification shifting seems to have impact on earnings quality.
Zang (2012), for example, provide evidence that companies appear to use a combination of these tools (AEM and REM) to meet or beat analysts’ expectations but there is also prior research suggesting that executives make trade-offs between both earnings management mechanisms based on relative benefits and costs of these decisions (Cohen et al. 2008; Badertscher, 2011). Zang (2012) finds that executives use REM before AEM, explained by the fact that AEM´s practices tend to take place after, or near, the end of the fiscal year while REM takes place during the fiscal year. This preference
6
may also be partially driven by the increased regulation regarding AEM in the post-Sarbanes-Oxley (Cohen, et al., 2008; Zang, 2012). Nevertheless, there is literature suggesting that listed companies tend to adopt AEM and reduce REM, in order to not damage the company's future value, when they have high executive compensation and lower executive shareholding (Yang et al. 2013). This tendency may be explained by the fact that REM is costlier than AEM, because of its hostile impact on cash flows and, consequently, on business operations, which will grow its potential to pull down firm´s future value. On the other hand, AEM is costlier than REM since it is subject to auditor restrictions at higher level.
Abernathy, Beyer and Rapley (2014) argue that executives are making trade-offs between different earnings management´ methods, based on their costs, restrictions and timing (AEM, REM and classification shifting). Based on Abernathy et al. (2014) research, classification shifting is privileged over REM when the firm is characterised by poor financial condition, high levels of institutional ownership and low industry market share. On the other hand, they found that managers seem prefer classification shifting over AEM when the former is constrained by low accounting system flexibility. Concluding, classification shifting may be a substitute financial instrument to manage reporting outcome since it is not used in complementarity with other measures.
Overvaluation is another important determinant of executives´ earnings management decisions. In fact, it seems that overvalued firms are more likely to engage in GAAP earnings management in order to sustain the overvalued equity (Badertscher, 2011). The same author argues that during the sustained period of overvaluation, managers privilege AEM over REM in the early years while non-GAAP earnings management is only practiced as a last resort.
2.1.1 The Impact of the Global Financial Crisis on Earnings Management Given the alterations in the economic environment affected by the global financial crisis of 2008, several studies examined its impact on financial reporting. Prior research argues that firms appear to engage in earnings management during financial crisis to attempting meet debt covenants and analysts´ expectations (Lisboa, 2017). However, there is statistical evidence suggesting that companies tend to reduce earnings management practices during crisis and recession years, regarding a few exceptions
7
according to the characteristics of the country, such as high debt level and low liquidity, where the companies run its business activity (Iatridis and Dimitras, 2013; Dimitras, Kyriakou and Iatridis, 2015). Filip and Raffoumier (2012), in order to evaluate the effect of global financial crises in Europe, performed a research covering a period from 2006 to 2009 and observed that the scope of earnings management practices has decreased during crisis years in comparison with previous periods. Yet, this conclusion is not verified for all European countries. Francis, Hasan and Wu (2013) defend that this event increases the request for high quality financial reporting, while LaFond and Watts (2008) argue that conservatism reduces the ability of executives in applying earnings´ manipulation methods since this fact increase the quality of earnings . Thus, following Cimini, (2015)´s conclusions, a strict monitoring activity from auditors correlated with an increase of conservatism, towards a reporting quality increase, during crisis years are linked with the reduction of earnings management practices.
2.2. Non-GAAP Earnings
Managers have a fourth choice to manage their earnings and stakeholder perceptions, applying non-GAAP reporting. Following the Securities and Exchange Commission (SEC) rule 33-8176, the non-GAAP financial measure can be defined as a “numerical measure of a registrant’s historical or future financial performance, financial position or cash flows that includes amounts that are not part of the most directly comparable GAAP measure or excludes amounts that are part of the most directly comparable GAAP measure”1, meaning the exclusion of unusual events and arbitrary accounting adjustments
from GAAP earnings. This type of disclosures is not required to be audited by external auditors which makes this type of disclosure an attractive alternative perception management instrument that may be used to mislead information users. Besides, there is other advantage since the cost related with Non-GAAP reporting is probably lower compared with AEM and REM due to the implicit regulation being generally not so strict. Furthermore, this kind of disclosures is helpfulness for time-series comparisons than GAAP, by the fact that is characterised by the exclusion of unusual events (Halsey and Soybel, 2002).
1 I use “non-GAAP earnings”, “non-IFRS earnings” and “pro forma earnings” as denominations with similar meaning.
8
Non-GAAP earnings may represent a process of communication with analysts and general financial information users. “Adjusted earnings” is a well-known concept for most investors, therefore, non-GAAP disclosures may help enhance consistency in the financial communication process (Young, 2014). Although, it is difficult to identify the motive behind this communication, whether it is the users´ demand or the company´s decision to provide information attempting to give clearer financial information. Thus, a non-GAAP disclosure may be associated to motives related with external or internal nature. There is evidence stating that analysts´ forecasting errors and dispersion are lower in the subsequent year for those companies that disclose non-GAAP earnings, indicating the utility this kind of disclosures might have for external market agents (Malone, Tarca and Wee, 2015). Then, stick with Malone et al. (2015) conclusions, it seems that these disclosures are not following an opportunistic move practiced by managers.
These adjustments may reflect a divergence of underlying motives, that are hard to disentangle to market agents, such as investors, auditors or regulators. The differentiation of honest disclosures, which managers attempt to highlight their core earnings sustainability, from an opportunistic point of view that may be motivated by the desire of managers to overstate firms performance, might be seen as a problematic topic (Black, Christensen, Kiosse, and Steffen, 2017). The discretionary nature of non-GAAP measures allows managers to find an opportunity to distort financial information users´ perception utilising communication methods, such as impression management, to convince them that these reported numbers are a better and clearer representation of the firm´s performance (Guillamon-Saorin, Isidro and Marques, 2017). These authors provide evidence suggesting that managers use a combination between impression management and non-GAAP reports characterised by exclusions of recurring items, but the market recognise when high levels of this communication technique are applied. However, Doyle, Lundholm and Soliman (2003) defend that stakeholders fail to fully understand the implication of these exclusions for firm´s future performance, which increases the probability of being deluded by this kind of disclosures.
Some previous research pointed out what statements´ items are more willing to be disclosed through a non-GAAP report. For example, the non-GAAP EBITDA, adjusted earnings per share (EPS) or adjusted net income disclosures differ. It seems that adjusted EBITDA is the most common measure to be reported beyond GAAP channels (Isidro and
9
Marques, 2008). Following the same authors, the other two most representative measures are adjusted EPS and adjusted net income. The disclosed item may differentiate the reason behind such reports since these authors argue that managers are not aware that EBITDA disclosures relate to non-GAAP measures giving the impression that executives tend to inform the market when disclose such item.
Managers have the ability to disclose non-GAAP numbers after the decision to use either AEM or REM (related with GAAP metrics), since the implicit adjustments that characterised this type of disclosures do not disturb the actual financial statements reported within GAAP. Following empirical evidence provided by Gelb and Zarowin (2002), there is an association between greater information disclosures and stock prices which will benefit investors, supporting an important Doyle et al. (2003)´ argument, that GAAP earnings may need to be supplemented by non-GAAP earnings since the former may not provide enough value relevant information. Brown and Sivakumar (2003) and Marques (2006) highlight that non-GAAP earnings are more relevant than GAAP earnings in terms of representation of firms performance and some stakeholders rely severely on these numbers (Bhattacharya, Black, Christensen and Mergenthaler, 2007), although this disclosed earnings may not be considered reliable by all users of financial statements information. Additionally, prior research defend that these disclosures are appropriate to reduce the information asymmetry by providing value relevant information to stakeholders, along with other information users, and better reflecting core earnings being more permanent than GAAP results (Bhattacharya, Black, Christensen and Larson (2003); Doyle et al., 2003; Black and Christensen, 2009).
Black and Christensen (2009) and Doyle et al. (2013) provide evidence suggesting that the managers´ desire to meet strategic earnings targets influences a disclosure of earnings on a non-GAAP basis whether the GAAP measures give the impression to be unsatisfactory. According to Bowen, Davies and Matsumoto (2005) managers usually strategically emphasise the numbers related to the most favourable profitability rate, which is, in most cases, the non-GAAP numbers since are generally related with adjusted calculations characterised by exclusions of expenses items. Prior literature documents that, when AEM measure seems to have a higher cost due to balance sheet restrictions, managers are more likely to exclude expenses from non-GAAP earnings in order to meet or beat analyst expectations, indicating that both metrics are used as substitute tools
10
(Doyle et al., 2013). Overall, managers tend to practice non-GAAP reporting when within GAAP earnings management is constrained (Doyle et al., 2013; Black, Christensen, Taylor and Schmardebeck, 2017). Still concerning an association between GAAP and non-GAAP earnings, Black, Christensen, Taylor and Schmardebeck (2017) argue that companies that used earnings management mechanisms in prior periods, are more likely to report non-GAAP earnings that exclude recurring items.
There is a focus in prior literature in exploring what types of exclusions may promote the outcome of a non-GAAP report. Previous research suggest that the type of the excluded item influence the motive behind non-GAAP reporting, being linked with opportunistic or informative non-GAAP disclosures (Christensen, 2007). Christensen (2007) found evidence suggesting that managers are more likely to exclude recurring items, such as depreciation and R&D expenses, on a non-GAAP basis to achieve strategic earnings benchmarks. This is consistent with Isidro and Marques (2015) finds, arguing that executives in countries with strong institutional and economic conditions are more likely to exclude expenses such as R&D, amortizations and tax expenses. In addition, Malone et al. (2015) investigated the extent to which IFRS earnings fair value remeasurements are associated with the voluntary disclosure of non-GAAP earnings, observing that companies seem to highlight unrealised items or those related with ambiguity measures, such as impairment expenses, along with considered non-recurring items. Moreover, some firms seem to report lower non-GAAP earnings numbers compared with GAAP numbers before extraordinary items since managers exclude non-recurring gains, that are connected with exceptions of normal business activity, indicating that at least some managers seem making this kind of disclosures guided by honest motivations (Black and Christensen, 2009). They also argue that the motive behind non-GAAP reporting may be explained through a combination between the nature of earnings exclusions with the achievement of strategic targets on non-GAAP basis, which may differentiate it in informative or opportunistic motivation.
The manipulation of GAAP numbers has an extra cost since are within accounting standards connected with an implicit reporting regulation. On the other hand, non-GAAP earnings disclosures benefit from being lightly regulated2 and self-defined by managers.
11
Accordingly, the rules and principles regarding financial reporting can be defined as an external force that affects disclosures (Bushman, Piotrski and Smith, 2004). Yet, it is not the only factor that may influences managers´ disclosure practices since there is prior literature indicating that the country´s institutional features, where the company runs its activity, may influence managers. Consequently, these factors create impact on reported earnings (Burghstahler, Hail and Leuz 2006; Leuz, 2010). The pressure experienced by managers to meet expectations or desired benchmarks, which will affect decisions about information disclosures, seems to be stronger in legally and economically developed countries, characterised by strict regulation implementation and high scrutiny over financial reporting, which is related to a reduction of earnings management practices (Isidro and Marques, 2015). According to this statement, the same authors provide evidence suggesting that in countries with “efficient legal systems, strong investor protection, developed capital market and good communications channels” (Isidro and Marques, 2015, p. 124), managers have an extra incentive to use non-GAAP reporting to meet earnings benchmarks since manipulation within GAAP is constricted.
2.2.1. Non-GAAP Reporting Regulation
With the Sarbanes-Oxley Act (SOX), in 2002, and with the enactment of the Securities and Exchange Commission (SEC) regulation – the Regulation G – in 2003, aimed at controlling and regulating the measure of non-GAAP earnings, there is statistical evidence that the use frequency of this type of disclosure initially declined (Entwistle, Feltham and Mbagwu, 2006), but increased sharply in the years after that (Brown, Christensen and Elliot, 2012). Following SEC, this regulation, item 10(e), required that non-GAAP reporting must follow two different principles related to GAAP: (i) “present the most directly comparable financial measure calculated and presented in accordance with GAAP” and (ii) “reconcile the differences between the non-GAAP financial measure and the most directly comparable GAAP measure”. More recently, as a result of the financial crisis in 2008, the SEC has renewed its emphasis on non-GAAP reporting and declared it a “fraud risk factor” resulting in additional regulation in January 2010 (updated on July 2011) and again in May of 2016 (updated in October of 2017). As seen, Regulation G may be considered an external force that affects opportunistic non-GAAP disclosures. Jennings and Marques (2011) found no evidence that non-GAAP earnings mislead investors after the adoption of Regulation G in the USA, indicating that
12
regulation may decrease opportunistic disclosures. Black, Christensen, Kiosse and Steffen (2017) examined the influence of SOX and Regulation G on a sample pre-SOX and post-SOX non-GAAP reports. They provide evidence that even though this regulation has achieved its intended purpose and negatively influenced aggressive3 non-GAAP
disclosures, some managers still appear to approve recurring items exclusions from non-GAAP reports. European financial bodies, such as CESR, ESMA and IOSCO, also create several recommendations with the underlying objective of give transparency and consistency to non-IFRS earnings (Jeanjean et al, 2018). However, these European financial bodies only formulate recommendations, and therefore are not mandatory. Up to the present day, no rule or regulation, with similar characteristics of Regulation G, was applied in Europe.
2.3 Hypotheses Development
Executives have several earnings and perception management alternative tools they could apply, where their selection between each one seems to be associated to the net incentive of each one (excluding the costs from the benefits). In this study, I emphasise the relation between earnings management (focusing on AEM) and non-GAAP disclosures. Consequently, the main question that I will explore is ascertain if executives that already manage their earnings, using earnings management mechanisms, will also report non-GAAP earnings.
As seen in the previous section, prior international literature debates what motives are behind non-GAAP reporting. The majority agrees that there are two designed underlying motivations. There is an information (or honest) motive, when managers only attempt to highlight their sustained core earnings, or an opportunistic motivation connected with the managers´ desire to overstate firms´ performance misleading information users´ perception. The difficulty lies in differentiate them. Doyle et al. (2003) defend that managers are making non-GAAP earnings disclosures, trying to provide clearer financial information to the market. This is consistent with Black and Christensen (2009) and Malone et al. (2015) conclusions, who defend that non-GAAP reporting follows an information (or economic) motive rather than opportunistic. However, Christensen
3 “Aggressive” non-GAAP exclusions and “recurring items” non-GAAP exclusions are used in literature as denominations with similar meaning.
13
(2007) defends that the exclusion of recurring items from non-GAAP reports follows an opportunistic move by managers. Besides, since in Europe this type of disclosures is not regulated, managers have an extra incentive for an opportunistic practice of non-GAAP reporting which enhances the likelihood of investors being misled in European countries.
I start by investigating the motive behind these type of financial information disclosures related with the level of earnings management practiced by managers, a differentiation between economic and opportunistic motivations. In order to do it, I will use adjusted net income disclosures as a reference for non-GAAP reporting.
As seen in the section 2.2., previous academic literature usually connect non-GAAP earnings with motivations related to meet or beat analyst´s expectations and essentially to portray better performance. These factors will lead to higher non-GAAP numbers comparing with GAAP, concluding that such type of disclosure is typically used to improve earnings. In fact, Isidro and Marques (2015) and Jeanjean et al. (2018) point that disclosed non-GAAP earnings are, in most cases, higher than reported GAAP operating earnings. Although, Black and Christensen (2009) provide evidence about the fact that some firms exclude non-recurring gains on their non-GAAP reports resulting in lower earnings comparing with GAAP numbers before extraordinary items, indicating that some managers appear to report adjusted earnings just for economic reasons. However, the exclusion of recurring gains does not affect the ultimate purpose of reporting non-GAAP earnings, it just makes its potential number be higher than the actual one, continuing being greater than GAAP number. Thus, a disclosure of such kind is related with an improvement of earnings such as an upward earnings management (positive accruals).
Hypothesis 1: If managers perform accrual-based earnings management, a
disclosure of non-GAAP earnings follows an opportunistic move, thus leading to more earnings management.
Following the last reasoning, I expect that economic motive behind this type of disclosures is related to low levels of accruals, while opportunistic motive is associated with higher intensity of accruals.
Within an opportunistic motive there are 2 possible variations to have into consideration. Firstly, it is possible that both metrics (earnings management and
non-14
GAAP reporting), when simultaneously used, promote the effect of complementarity. Such disclosures correlated with upward earnings management will cause the same result, that is increase earnings. So, if a manager uses both metrics, he or she will use them for the same reason, substituting a metric with the other, consistent with Doyle et al. (2013) finds, who provided statistical evidence supporting the idea that AEM and non-GAAP reporting are considered as substitutes and not complement tools. Secondly, there is a probability that both metrics are used as complements of each other. As opposition, I expect that an opportunistic motive is related to positive discretionary accruals. Non-GAAP reporting correlated with downward earnings management will lead to similar results. While a manager uses a non-GAAP disclosure to show improved earnings, he or she is, at the same time, improving them by using upward earnings management (positive accruals). Thus, it will be created a substitution effect between both metrics.
Hypothesis 2: Earnings management and non-GAAP reporting are used as substitute tools.
The last hypotheses (1 and 2) do not explore the presence of these events in terms of chronology. These disclosures can be made after the decision to use accrual earnings tools since the implicit adjustments do not affect actual operating and financial reported statements. Thus, I intend to explore what level of earnings management will lead to a report of non-GAAP earnings. I expect that downward accruals, or no earnings management at all, are the motive that will trigger the desire of reporting non-GAAP earnings. If executives manage their earnings upwards will nullify the earnings management effect upon the non-GAAP disclosure. Moreover, upward earnings management will consequently higher up the fiscal burden, so there is no economic sense in reporting non-GAAP earnings after that. However, when executives manage their earnings downwards there is a “loss” in need of being compensated. In this case, it is necessary an existence of a future disclosure in order to explain and reimburse that “loss”.
Hypothesis 3: If firms use more downwards AEM, they are more likely to report non-GAAP earnings
15
3. METHODOLOGY 3.1. Sample characterization
I collected non-IFRS earnings data from press releases by searching on Factiva database from January 2011 to December 2019. In order to identify non-GAAP reporting, it was used different keywords such as “non-GAAP”, “non-IFRS”, “proforma”, “pro-forma” and “core earnings”. It was coded a company-year observation as practicing non-GAAP reporting if the company discloses non-non-GAAP earnings (adjusted net income) quarterly or just as a final yearly report. The remaining data has been extracted from
Amadeus database. The time horizon was set from the year of 2011 to 2018 and takes into
consideration European listed companies from Euro 154 with available data to perform the statistical tests. Companies linked with financial, insurance or public administration industries, was readily excluded from the study sample since have specific accounting system and regulation, which will affect the practice of earnings management on a different way. Additionally, was excluded industries with less of 6 related companies (industry Education - P - was excluded). Then, industries Agriculture, forestry and fishing (A), Mining and quarrying (B), Human health and social work activities (Q) and Arts,
entertainment and recreation (R) were also excluded for the motive that any related
company presents non-IFRS reporting. Besides, companies from Luxemburg were also excluded from the sample for the same reason.
The final sample contains 2 122 firms, from 14 European countries, originating 12 465 company-year observations. The proportion of companies practicing non-IFRS reporting is 7,00%.
France, Germany and Sweden are the countries with higher representation on the sample, with 24,30%, 20,75% and 14,81% observations respectively. This information is available in Appendix – Table I.
Professional, scientific and technical activities (M), Manufacturing (C) and Information and Communication (J) are the industries with higher representation on the
4 Euro 15 is a group of 15 European countries used in empirical analyses composed by Austria, Belgium, Deutschland, Denmark, Spain, Finland, France, Great Britain, Greece, Ireland, Italy, Luxembourg, Netherlands, Portugal, and Sweden.
16
sample, representing 34,23%, 24,81% and 13,74% of the observations respectively. This information is available in Appendix – Table II.
3.2. AEM measure
Different models have been developed in order to detect earnings management. Following innumerable prior studies, I use abnormal accruals to proxy to earnings management. I follow one of the most recognised and widely used approaches to separate discretionary5 accruals from total accruals. Specifically, I use the modified Jones model (1991), developed later by Kothari et al. (2005), who includes return-on-assets from the beginning of the year as variable to control the impact of company´s performance on abnormal accruals, and use the residuals from the cross-sectional modified Jones model as abnormal accruals (equation 1).
(1) 𝑇𝐴𝑖,𝑡 𝐴𝑇𝑖,𝑡−1= 𝛼0+ 𝛼1( 1 𝐴𝑇𝑖,𝑡−1) + 𝛼2 (∆𝑅𝐸𝑉𝑖,𝑡 ) 𝐴𝑇𝑖,𝑡−1 + 𝛼3 𝑃𝑃𝐸𝑖,𝑡 𝐴𝑇𝑖,𝑡−1+ 𝛼4𝑅𝑂𝐴𝑖,𝑡−1 + 𝜀𝑖,𝑡 Where:
𝑇𝐴𝑖,𝑡 : Total Accruals for company i, in year t
𝐴𝑇𝑖,𝑡−1 : Total Assets for company i, at the beginning of year t
∆REV𝑖,𝑡 : Change in Total Revenue (sales) for company i, from t-1 to t 𝑃𝑃𝐸𝑖,𝑡 : Gross Property, Plant and Equipment for company i, in year t
ROA𝑖,𝑡 : Return-on-Assets of company i, in year t, calculated as the ratio of Net income in year t and Total Assets in year t-1
𝜀𝑖,𝑡 : Abnormal Accruals (ACC)
From this equation (1) were estimated the α coefficients for every single year within a period of 8 years (from 2011 to 2018) and for each of the 13 industries existing on the sample, with a regression for each industry individually. The estimation of the previous regression has the objective of getting total accruals, considering the regression residuals as discretionary accruals.
17
I define Total Accruals (TA) as presented in the following formula in accordance with the same authors (equation 2):
(2) 𝑇𝐴𝑖,𝑡 = ∆𝐶𝐴𝑖,𝑡 − ∆𝐶𝐿𝑖,𝑡 − ∆𝐶𝑎𝑠ℎ𝑖,𝑡 + ∆𝑆𝑇𝐷𝑖,𝑡 − 𝐷𝑒𝑝𝑖,𝑡 Where:
∆CA𝑖,𝑡 : Change in Current Assets for company i, from year t-1 to t ∆CL𝑖,𝑡 : Change in Current Liabilities for company i, from year t-1 to t ∆Cash𝑖,𝑡 : Change in Cash and equivalents for company i, from year t-1 to t ∆STD𝑖,𝑡 : Change in short-term debt for company i, from year t-1 to t
Dep𝑖,𝑡 : Amortizations and Depreciations for company i, in year t
Thus, the earnings management measure will be built as the form of accruals by total (ACC) and absolute value (ABS_ACC) and later by direction (downward, reducing earnings and upward, improving earnings).
3.3. Empirical Models
In this chapter, it will be defined and explained the models used to test the previously presented hypotheses.
To explore what kind of motives are behind the desire of managers to report non-GAAP earnings and what type of effect a correlation between this practice with earnings management can occur and, consequently, test hypotheses 1 and 2, I developed the next empirical model (equation 3).
(3) 𝐴𝐶𝐶𝑖,𝑡 = 𝛽0 + 𝛽1 𝑁𝐺𝑖,𝑡 + 𝛽2 𝐴𝐺𝐸𝑖,𝑡 + 𝛽3 𝐵𝐼𝐺4𝑖,𝑡+ 𝛽4 𝐺𝑅𝑂𝑊𝑇𝐻𝑖,𝑡 + 𝛽5 𝐿𝐸𝑉𝐸𝑅𝐴𝐺𝐸𝑖,𝑡 + 𝛽6 𝑆𝐼𝑍𝐸𝑖,𝑡+ 𝑣𝑖,𝑡
The index i and t concerns each company and year, respectively.
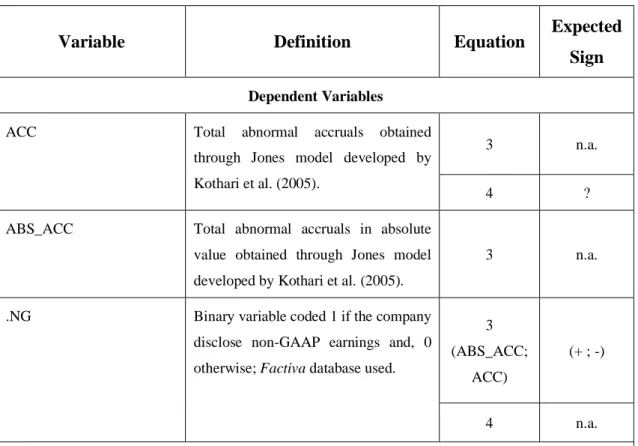
The variable ACC corresponds to abnormal accruals calculated through the modified Jones model developed by Kothari et al. (2005), as the previous section indicates, in absolute terms (ABS_ACC) and total value (ACC). The following variables are defined and explained in section 3.3.1..
18
Then, I examine the direct relation between earnings management practices and reports beyond regulated disclosure channels, specifically accrual-based earnings management, and non-GAAP reporting. This analysis is made concerning a possible sequential notion related with the events occurrence. To estimate hypothesis 3, I developed a logit regression (equation 4), following models already presented in previous literature (Isidro and Marques, 2015; Black, Christensen, Taylor and Schmardebeck, 2017), although it is built with the necessary adjustments related with the study´s topic.
(4) Pr(𝑁𝐺𝑖,𝑡 = 1)
= 𝛽0+ 𝛽1 𝐴𝐶𝐶𝑖,𝑡+ 𝛽2 𝐴𝐶𝐶_𝐿𝑃𝑁𝐺𝑖,𝑡+ 𝛽3 𝐴𝐶𝐶_𝑁𝐸𝐺_𝐶𝑂𝑁𝑇𝑖,𝑡 + 𝛽4 𝐴𝐺𝐸𝑖,𝑡 + 𝛽5 𝐵𝐼𝐺4𝑖,𝑡+ 𝛽6𝐿𝑂𝑆𝑆𝑖,𝑡+ 𝛽7 𝐺𝑅𝑂𝑊𝑇𝐻𝑖,𝑡 + 𝛽8 𝐿𝐸𝑉𝐸𝑅𝐴𝐺𝐸𝑖,𝑡 + 𝛽9 𝑆𝐼𝑍𝐸𝑖,𝑡 + 𝑤𝑖,𝑡
The index i and t concerns each company and year, respectively.
The dependent variable NG corresponds to a dummy variable coded 1 if the company reports non-GAAP earnings, and 0 otherwise, as described in the sample characterization section. Concerning the remaining variables, firstly I include ACC, corresponding to abnormal accruals calculated through modified Jones model developed by Kothari et al. (2005) in total value as the previous section indicates. The model also contains a variable (ACC_LPNG), coded 0 if the company did not report non-GAAP earnings on the last period. This variable is representing the company need of reporting non-GAAP earnings continually in order to avoid a break of information that will possibly lead to a loss of confidence by financial information users. Investors and other information users may see this discontinuity action as attempting to disrupt their perception. Besides, this variable will capture what level of accruals, in the current year, is related with a non-GAAP disclosure, in the previous period.
Finally, the dummy variable ACC_NEG_LPNG is defined as a supplement of the previous one. I include this variable to capture the probability of a non-GAAP report when managers perform such disclosures in the previous period and manage their earnings downwards in the current year. It’s coded 1 if the company presents negative accruals when there is a disclosure of non-GAAP in the last period and 0 otherwise.
19
3.3.1. Control Variables
Regarding the previous models, it was included several control variables for factors that prior research identifies as associated to voluntary accounting decisions and related with previous studies about earnings management and non-IFRS earnings.
With the objective of capture the company´s complexity, I include the variables Age and Size. Age, corresponds to the age of the company measured as the logarithm of years (Black, Christensen, Taylo and Schmardebeck 2017). Additionally, there is a possible relationship between the size of the company with the degree of earnings management practices. Prior research suggest that larger companies tend to have lower levels of earnings management than smaller companies (Watts and Zimmerman, 1978). On the other hand, Tendeloo and Vanstraelen (2005) provided evidence that there is no relation between both factors. Next, Jeanjean et al. (2018) argue that complex firms are more likely to disclose non-GAAP earnings for two different reasons: one in which managers tend to have opportunistic behaviour in influencing users´ perception since complex firms are difficult to monitor and another in which managers only may want to reduce earnings asymmetry and provide clearer financial information seeing that GAAP earnings alone may be insufficient. In fact, Jeanjean et al. (2018) found a positive correlation with the size of the company. Thus, it was included a variable to control for company´s size, measured as the logarithm of the firm´s total assets.
I include a variable to control for the international well-known of auditing firms (BIG4), coded 1 if the company is audited by a Big4 auditing firm and, 0 otherwise. According to DeAngelo (1981), Big4 firms provide higher quality services since they have increased pressure to maintain a wealthy reputation which may reduce the ability of executives in managing their earnings through GAAP channels. With a certain association to these results, Becker, DeFond, Jiambalvo and Subramanyam (1998) and Tendeloo and Vanstraelen (2005) has shown that Big4 auditing firms restrict earnings management practices resulting in a direct link between both elements. Additionally, Francis and Wang (2008) state that earnings quality is greater as investor protection becomes stronger, but only for clients of Big4 firms.
Since scrutiny of shareholders is expected to influence non-GAAP disclosures (Jeanjean et al., 2018), I include two variables as measures of scrutiny: decreasing
20
performance and debt level. In order to explore situations of decreasing performance, it was included a dummy variable named Loss (Jeanjean et al., 2018). It is coded 1 if the company has a negative net income and, 0 otherwise. Statistical evidence, provided by previously mentioned authors, suggests that the lower the company´s debt level the higher the probability of non-GAAP disclosures. In order to control for debt level, I include a variable Leverage measured as the sum of long and short-term debt dividing by total assets. Additionally, according to DeFond and Jiambalvo (1994) and Roychowdhury (2006), there is a positive correlation between debt level and the degree of earnings management, meaning that, the higher the leverage rate the higher the intensity managers have in managing their earnings.
According to Butler, Leone and Willenborg (2004), growing companies have greater pressure to maintain their performance when they are leading with financial distress. These factors may motivate an increase in earnings management practices to sustain these needs. Linked with this statement, Tendeloo and Vanstraelen (2005) demonstrate that growth rate has a positive effect on earnings management. In opposition, Gunny (2010) defend that growing companies are less willing to manipulate their earnings through earnings management mechanisms. Additionally, following Kolev, Marquadt and McVay (2008), it is expected that sales growth is correlated with non-GAAP earnings. Thus, I control for performance, including in both models the variable Growth, measured as the percentage of change in sales.
4. RESULTS
4.1. Descriptive Statistics
The table I provides the descriptive statistics for all company-year observations between 2011 and 2018 with available data to perform the tests. According to the results, 2,704% of the sample are related to non-GAAP earnings disclosures and the average level of abnormal accruals of European listed companies is -0,0283, meaning that, on average, companies practice earnings management to reduce them. There is, on average, a slightly tendency to reduce earnings by accruals management tools when a company discloses non-GAAP earnings on the previous period (-0,0008). Finally, about 2,7% of the observations are linked with companies that exhibit negative accruals and report on last period non-GAAP earnings.
21
Analysing the control variables, while the average age of Euro 15 listed companies is about 29 years (𝑒3,370257), the average growth rate is 12,593%. Lastly, 29,02% of the sample companies reported negative net income at the established study time horizon and the average company presents a leverage rate of 22,51%.
Table I. Descriptive Statistics
Variable Obs. Mean Median
Standard-Deviation Min. Max.
NG 12465 0,0270 0 0,1622 0 1 ACC 12465 -0,0283 -0,2422 0,1732 -4,5078 6.,3912 ABS_ACC 12465 0,0832 0,0481 0,1545 0 6,3911 ACC_LPNG 12465 -0,0008 0 0,0134 -0,3820 0,4440 ACC_NEG_LPNG 12465 0,0207 0 0,1424 0 1 AGE 12465 3,3703 3,2958 0,7456 0 6,3172 BIG4 12465 0,4551 0 0,4980 0 1 GROWTH 12465 0,1259 0,0403 0,7695 -0,9987 18,8928 LOSS 12465 0,2902 0 0,4539 0 1 LEVERAGE 12465 0,2251 0,1530 0,2251 0 0,9982 SIZE 12465 5,2171 5,1284 1,0707 1,8987 8,6610
Variables: NG Dummy coded 1 if the company disclose non-GAAP earnings and, 0 otherwise; ACC Total abnormal accruals; ABS_ACC Total abnormal accruals in absolute value; ACC_LPNG Total abnormal accruals if the company disclose GAAP earnings on the last period; ACC_NEG_LPNG Dummy coded 1 if the company disclose non-GAAP earnings having negative accruals and, 0 otherwise; AGE Logarithm of the company´s age in years; BIG4 Dummy coded 1 if the company is audited by a Big 4 auditing firm and, 0 otherwise; GROWTH Growth rate by percentage of change in sales; LOSS Dummy coded 1 if the company has negative net income and; 0 otherwise;
LEVERAGE Debt level (short and long-term) in percentage of total assets; Size Logarithm of company´s total assets.
4.2 Pearson´s correlation matrix
Table II provides the Pearson´s correlation among all variables. Overall the variables present low levels of correlation between each other. The results allow us to assess existence of a negative correlation between the dependent variable NG and ACC, consistent with Black, Christensen, Taylor and Schmardebeck (2017) results. The results suggest that the higher the size of the company, age or its debt level the higher the desire
22
of reporting non-GAAP earnings. In opposition, lower the growth rate lower the desire to practice such disclosures. In opposition, the fact that the company is audited by a Big 4 or presents negative net income is correlated with downwards AEM. Additionally, leverage is also negatively correlated with ACC. The fact of a company has a positive net income or, consistent with Black, Christensen, Taylor and Schmardebeck (2017) results, be associated with a BIG 4 auditing firm are positively correlated with non-GAAP reporting.
Table II. Pearson´s Correlation Matrix
NG ACC ABS_ACC ACC_LPNG ACC_NEG_LPNG AGE BIG4 Growth LOSS LEVERAGE SIZE
NG 1 ACC -0,0024 1 ABS_ACC -0,0260 0,0427 1 ACC_LPNG -0,1738 0,0681 -0,0060 1 ACC_NEG_LPNG 0,4240 -0,0228 -0,0228 -0,5903 1 AGE 0,0544 0,0243 -0,1422 -0,0143 0,0446 1 BIG4 0,0473 -0,0174 -0,0194 -0,0081 0,0414 0,0882 1 GROWTH -0,0053 0,1096 0,1604 0,0039 -0,0545 -0,1036 0,0024 1 LOSS -0,0532 -0,1354 0,1445 0,0179 -0,0545 -0,1833 -0,1006 0,0218 1 LEVERAGE 0,0222 -0,0037 -0,0388 -0,0078 0,0267 0,0279 -0,0379 -0,0332 0,1333 1 SIZE 0,2440 0,0421 -0,1913 -0,0934 0,2221 0,3521 0,2820 -0,0747 -0,3218 0,1557 1
Variables: NG Dummy coded 1 if the company disclose non-GAAP earnings and, 0 otherwise; ACC Total abnormal accruals; ABS_ACC Total abnormal accruals in absolute value;
ACC_NG Total abnormal accruals if the company disclose non-GAAP earnings on the last period; ACC_NEG_NG Dummy coded 1 if the company disclose non-GAAP earnings
having negative accruals and, 0 otherwise; AGE Logarithm of the company´s age in years; BIG4 Dummy coded 1 if the company is audited by a Big 4 auditing firm and, 0 otherwise;
GROWTH Growth rate by percentage of change in sales; LOSS Dummy coded 1 if the company has negative net income and; 0 otherwise; LEVERAGE Debt level (short and
23
Regarding the sign of AEM, measured by ACC variable, there is a positive correlation with age, growth, and size. This means that growing companies or those which have high levels of complexity are correlated with upwards AEM.
Finally, the intensity of AEM, measured by ABS_ACC variable, is negatively correlated with the general of the remaining variables. It seems that there is a tendency to low levels of earnings management in the current year if the company disclose non-GAAP earnings in the last period since ACC_LPNG and ACC_NEG_LPNG exhibit negative coefficients (-0,0060 and -0,0228, respectively). These results also suggest that the intensity of AEM has a positive correlation with growth rate and with a negative net income launch by the company on its income statement.
Additionally, all considered independent variables added to the model have low levels of correlation between them, confirming their independence.
4.3 Regressions Results
On the following table (table III), I present the results obtained from the estimation of the first regression model defined in section 3.3., discriminated in two different equations where the related dependent variable differed in ABS_ACC (1) and ACC (2). While the analysis of regression (1) allows a study concerning the earnings management intensity practiced by companies, an analysis of regression (2) permits an investigation about the direction of accrual-based earnings management. In order to validate hypotheses 1 and 2 is necessary a simultaneous framework of both regressions. It is important to state that the majority of the coefficient signs are according with expectations.
There is a greater intensity on the practice of earnings management when associated with a report of non-GAAP earnings. This assumption comes from the fact that NG variable has a positive coefficient (0,0187) on regression (1) with 95% statistical confidence. Therefore, regarding the underlying motive, I may conclude that a manager who practices such disclosures tends to follow an opportunistic motive, since it applies greater intensity to the management of the company´s earnings. In conclusion, the first hypothesis is validated according to inherent expectations. The coefficients of age and size variables in regression (1) are negative (-0,0151 and -0,0244, respectively), meaning a lower intensity of earnings management. Thus, the higher the company´s complexity the lower the level of accruals earnings management.
24
The negative correlation exhibited by the size variable is consistent with Watts and Zimmerman (1978) study who provide evidence that smaller companies have a greater probability of managing earnings since bigger companies are subjected to higher scrutiny in terms of regulation.
In opposition, when a company is growing in sales or it is audited by a Big 4 auditing firm, since these variables exhibit positive coefficients (0,0279 and 0,0052, respectively), meaning a higher intensity of earnings management. The positive correlation presented by the growth variable follows Tendeloo et al. (2005) conclusions. These results concerning Big 4 auditing firms are not consistent with Becker et al. (1998) and Tendeloo et al. (2005), which respective studies point to a negative correlation, but are consistent with the correlation matrix presented in previous section.
Concerning the shareholders´ scrutiny captured by the leverage variable, it appears that that the higher the debt level the higher earnings management intensity (0,0008). This conclusion concurs with DeFond and Jimabalvo (1994) and Roychowdhury (2006) studies results. However, no statistical-based conclusion can be made since this variable is not statistically significant.
On the other hand, an analysis of regression (2) might be used to explore the second hypothesis concerning the established idea about the possible effect of substitution promoted by the simultaneous use of both practices. The negative coefficient (-0,0165), with a level of statistical significance of 10%, presented by NG variable, allows to confirm that a non-GAAP disclosure is correlated with negative accruals, that is, a downward earnings management. This fact suggests that both practices are simultaneously used for different purposes. Non-GAAP reporting is used to improve earnings, while AEM is used to reduce them. Therefore, I may conclude that there is complementarity effect. These results are not in accordance with Doyle et al. (2013) and Black, Christensen, Taylor and Schmardebeck (2017) studies, settling that both practices are used as substitute tools. In sum, hypothesis 2 is not validated.
According to the results, I provide evidence that company´s complexity influences the direction of accruals. The coefficient signs of age and size variable are positive (0,0037 and 0,0093, respectively). Thus, the higher company´s complexity, which is reflected by company´s age and size, the higher is the sign of accruals.
25
Additionally, it seems that companies tend to manage their earnings downwards when they have the presence of a Big 4 auditing firm (-0,0102). Big 4 firms have an increased pressure to provide higher quality services and maintain good reputation (DeAngelo, 1981), consequently this negative correlation may be explained by the possible force that Big 4 auditing firms apply on their clients to not improve earnings through AEM, in order to avoid a loss of financial numbers´ transparency traced to disrupt investors´ perception. Contrarily, a growing firm appears to practice AEM to improve earnings, seeing that the growth variable presents a positive coefficient (0,0259). These coefficient signs concur with Pearson´s correlation matrix results showed in the previous section.
Table III. Results from the regression models (ABS_ACC and ACC) Variable Expe ct ed S ign (1) Expe ct ed S ign (2) Constant 0,2615*** -0,0969*** (26,25) (-8,46) NG ? 0,0187** ? -0,0165* (2,20) (-1,68) AGE ? -0,0151*** + 0,0037* (-7,70) (1,64) BIG4 - 0,0052* ? -0,0102*** (1,66) (-2,85) GROWTH + 0,0279*** + 0,0259*** (15,91) (12,84) LEVERAGE + 0,0008 ? -0,0126 (0,10) (-1,49) SIZE +/- -0,0244*** + 0,0093*** (-7,70) (5,45)
COUNTRY YES YES
YEAR YES YES
Obs 12465 12465
R-squared 0,0669 0,0188
P-value 0,0000 0,0000
*,**,*** indicate statistical significance at 10%, 5% and 1% levels respectively. The t test statistics is presented in parenthesis.
(1) Regression results (ABS_ACC) ; (2) Regression results (ACC)
Variables: ACC Total abnormal accruals; ABS_ACC Total abnormal accruals in absolute value ; NG Dummy coded 1 if the company disclose non-GAAP earnings and, 0 otherwise; AGE Logarithm of the company´s age in years; BIG4 Dummy coded 1 if the company is audited by a Big 4 auditing firm and, 0 otherwise; GROWTH Growth rate by change in sales; LEVERAGE Debt level (short and long-term) in percentage of total assets; Size Logarithm of company´s total assets.
26
Finally, regarding the only non-statistically significant variable, leverage has a positive correlation (regression 2) suggesting that managers improve earnings through AEM mechanisms the higher the debt level presented by companies. Yet, no statistical-based conclusion can be made.
In order to validate hypothesis 3, I developed a second model defined also in the section 3.3.. This model was advanced for the objective of analysing a possible correlation between non-GAAP reporting and AEM concerning a timeline of events. Thus, it explores what levels of earnings management higher up the probability of managers disclose non-GAAP earnings. The results obtained by the estimation of the mentioned model are presented in the table below (table IV).
By the analysis made from the table IV, the probability of a manager disclose non-GAAP earnings seems to be higher when they manage their earnings downwards through AEM channels since the coefficient of ACC variable presents a negative sign. However, this variable is not statistically significant, so no statistical-based conclusion can be made. Continuing the analysis, the variable ACC_NG coefficient is positive, with a statistical significance level of 1%. Thus, there is a higher probability of a non-GAAP report in the current year when a company practice AEM and reported non-GAAP earnings in the previous year. There is a possibility that financial information users see non-GAAP reporting´s discontinuity as attempting to mislead their perception. Although, I interpret this result as evidence indicating that managers try to put away that possibility since the result suggest that managers privilege non-GAAP earnings reporting´s continuity.
Additionally, the variable ACC_NEG_LPNG also exhibits a positive coefficient (statistical confidence of 99%), suggesting that, there is a higher probability of a non-GAAP disclosure if the company practices downward AEM in the current year and made such disclosure in the last period. These results also confirm the predicted expectations about the idea of continuity of such disclosures. Therefore, the downward AEM fact allied to a continued non-GAAP reporting positively affect the probability of such reports. The hypothesis 3 is validated.
Based on the obtained results, there is a tendency to practice such disclosures when a company has a lower age and is growing in sales (AGE has a positive coefficient with statistical significance of 90% of confidence).