The Relevance of the Informational Content of Book-Tax Differences
for Predicting Future Income: Evidence from Latin American
Countries
Alessandra Vieira Cunha Marques
Universidade Federal de Uberlândia, Faculdade de Ciências Contábeis, Uberlândia, MG, Brazil
Patrícia de Souza Costa
Universidade Federal de Uberlândia, Faculdade de Ciências Contábeis, Uberlândia, MG, Brazil
Pablo Rogers Silva
Universidade Federal de Uberlândia, Faculdade de Gestão e Negócios, Uberlândia, MG, Brazil
Received on 01.16.2015 – Desk Acceptance on 01.28.2015 – 3rd version accepted on 08.05.2015.
ABSTRACT
This study aims to investigate whether the different types of book-tax differences are useful for predicting the future income of publicly traded companies in five Latin American countries. This is possible since these differences convey information about transitory compo-nents of income, which can be used by investors for predicting future income. However, little is known about the relationship between tax variables and companies’ future results. The sample analyzed here is composed of 580 publicly traded companies from five Latin American countries (Argentina, Brazil, Chile, Mexico, and Peru) with information available in the Economatica® database covering 2002 to 2013. In terms of methodology, regressions are employed in order to find a connection between the different types (total, permanent, temporary, and the negative and positive variations) of book-tax differences and companies’ current and future earnings per share, as well as some control variables suggested by previous literature. The model’s coefficients were estimated through panel data techniques: fixed effects. The results obtained suggest that the information gathered in the different types of book-tax differences (total, permanent, temporary, positive and negative variations) is relevant in predicting future income. Total, permanent and temporary differences contribute to the uncertainty in future income prediction, given that results are more transitory and less persistent in years with higher book-tax differences. Positive and negative variations, on the other hand, attribute higher income in coming years to greater variations in book-tax differences, repre-senting increased timeliness of results and a reduction in off balance sheet funding for the publicly traded companies from these countries.
1 INTRODUCTION
types of BTDs can have diferent usefulness for investors in each country.
In scenarios with lower FTC, that is, in countries where accounting standards and tax rules are diferent, higher levels of BTDs (Hanlon, 2005) are veriied, and accounting information is more relevant than tax infor-mation (Yoon, 2008). In scenarios with higher FTC, that is, in countries where accounting standards and tax rules are aligned, there are lower levels of BTDs and tax infor-mation is more highly valued by investors than reported accounting numbers (Yoon, 2008). hus, the information gathered in BTDs can have diferent usefulness in each jurisdiction.
Institutional theory argues that companies tend to adopt practices that are institutionalized in society, with the intention of increasing their legitimacy in the market in which they operate, oten without taking into consi-deration whether the accounting norms are or are not the most suitable (Meyer & Rowan, 1977). herefore, the types of BTDs that are relevant to investors estimating companies’ future results in the United States may not be the same as those for Brazilian companies; this may be the result not only of the accounting practices adopted, but also of the investor culture and of the country’s political system, among other features.
hus, in the context of Latin American countries, kno-wn for high levels of FTC and developing capital markets (La Porta, De-Silanes, & Shleifer, 2008), it is possible to ind – for the usefulness of BTDs – diferent results from those obtained in previous studies. Faced with the context presented, this study investigates the types of book-tax di-ferences that are relevant in forecasting future results in Latin American countries.
To do this, the connections between diferent types of BTDs (total, temporary, permanent, positive and negati-ve) and future results forecasts for publicly traded compa-nies in ive countries in Latin America (Argentina, Bra-zil, Chile, Peru, and Mexico) were tested. In some studies (Hanlon, 2005; Ayers, Laplante, & Mcguire, 2010; Costa, 2012), the relevance of total, temporary, permanent, po-sitive and negative BTDs to economic agents was inves-tigated separately; however, no studies have been found – until now – that conciliate all these types of BTDs into a single study, and particularly, with relation to the context of these ive Latin American countries. Given that they are countries with their own peculiarities, they may exhi-bit diferent behaviors to those obtained in previous stu-dies regarding the usefulness of diferent types of BTDs. he aim is thus to bridge this gap.
his study can contribute to literature on BTDs in pro-viding international evidence regarding the implications of the diferences between accounting norms and tax ru-les in the usefulness of inancial statements for investors in various developing economies. Furthermore, it aims to build upon previous studies (Hanlon, 2005; Tang, 2006, he information gathered in the diferences
betwe-en accounting income and taxable income – known as book-tax diferences (BTDs) – can be useful for investors, analysts and creditors to forecast companies’ future re-sults (Lev & Nissim 2004; Hanlon, 2005; Tang, 2006). his usefulness can be explained by the fact that BTDs are able to provide additional information about the transitory components of companies’ current proits and of future cash low. Yet, this usefulness is questioned, given that tax information is complex, incomplete and non standardi-zed (Weber, 2009).
he usefulness of the information contained in the diferences between accounting income and taxable in-come for economic agents can be demonstrated with the connection between BTDs and predicting future results. Generally, the greater the diferences between accounting income and taxable income, the lower the estimates for future results (Tang, 2006). his negative relationship is justiied by the fact that higher levels of BTDs mean that current proits are more transitory and less persistent, signaling poorer performance in following years (Tang, 2006).
In many jurisdictions, the information captured in BTDs is more relevant than the value of reported proit itself (Tang, 2006). he importance attributed to the di-ferences between accounting income and taxable income can be explained by the fact that they ofer information about the quality of proits reported, such as persistence, management aggressiveness, value relevance, and accoun-ting conservatism (Hanlon, 2005; Heltzer, 2009; Blaylock, Shevlin, & Wilson, 2012). hus, BTDs can be useful for market participants when evaluating the quality of ear-nings reported.
Each type of BTD can result in diferent implications for predicting future results (Blaylock et al., 2012), name-ly: temporary BTDs present information regarding the persistence of companies’ earnings and regarding earnin-gs management (Hanlon, 2005); in turn permanent BTDs are suitable for identifying aggressive inancial and tax re-ports – managing accounting income upwards and taxa-ble income downwards (Frank, Lynch, & Rego, 2009); and (positive and negative) variations in levels of BTDs show the levels of conditional and unconditional conservatism present in inancial statements (Heltzer, 2009). hus, each type of BTD can contribute in diferent ways to economic agents’ uncertainty regarding companies’ future results.
2014), by providing evidence about which types of BTDs afect future results forecasts in some Latin American countries.
his study can also make a contribution for economic agents, since diferent types of BTDs are able to reveal in-formation about the quality of companies’ results. hus, investors in irms in these Latin American countries could improve their own expectations regarding upcoming ear-nings with a more complete analysis of the information
contained in BTDs.
Beyond this introduction, this study goes on to consi-der: the theoretical framework, with an emphasis on the relevance of the informational content of the accounting numbers in book-tax diferences and in their types (sec-tion 2); the methodology used to carry out the empirical tests (section 3); the calculation and analysis of the results obtained (section 4); and the concluding remarks regar-ding the study (section 5).
2 THEORETICAL FRAMEWORK
2.1 Book-Tax Differences
Book-tax differences are defined as the differences between accounting income and taxable income. Ac-counting results can differ from taxable results due to at least three reasons, namely: firstly, due to the different purposes of the two forms of calculating results – one in accordance with generally accepted accounting prin-ciples (GAAP), with the aim of reducing information asymmetry, and the other designed to calculate taxable income, and obeying tax rules (Shackelford, Slemrod, & Sallee, 2011).
The second reason accounting income and taxable income can be different is that whereas corporate ac-counting records the economic fundamentals of transac-tions in an objective and verifiable way, tax accounting is designed to induce or compensate individual behavior (Shackelford et al., 2011). For example, for accounting purposes, the value of company equipment is deprecia-ted (an expense which reduces company results) each period, based on estimates for the useful lifespan of this asset. For taxation purposes, the value of this equipment is depreciated (reducing taxable income) each period in accordance with legal rules, without taking into consi-deration the real deterioration of the good. Due to this legal definition, depreciation for tax purposes will rarely be the same as the real depreciation estimate for equip-ment used for company purposes. Therefore, accounting results and taxable results may be different.
The third reason for BTDs is the fact that there are incentives to mislead both of the information recipients – financial market users and the government (Shackel-ford et al., 2011). The practice which affects profit re-ported to tax authorities, resulting in tax evasion acti-vities, is known as tax management (Desai, 2005). This practice mostly consists of manipulating – downwards – taxable income (Frank et al., 2009). BTDs thus contain useful information about the quality of results reported by companies to the government.
The differences between accounting results and ta-xable results can affect the informational quality of fi-nancial statements and, consequently, their usefulness for users. Within the quality indicators of company re-sults, value relevance, persistence of rere-sults, conditional conservatism and income smoothing are proxies that
are able to show the reasons for the emergence of BTDs (Nakao, 2012). When companies report higher levels of BTDs, they have less persistent financial results (Han-lon, 2005; Tang, 2006), which justifies the fact that BTDs contribute to investor uncertainty regarding company accounting numbers.
2.2 Relevance of Informational Content of
Accounting Numbers
Accounting numbers will be considered relevant if they have been used by investors, inluencing them in their decision making (Barth, Beaver, & Landsman, 2001). hus, information contained in the diferences between accounting income and taxable income is consi-dered relevant if it assists investors in forecasting future results. his is possible since such diferences not only provide information on transitory components of pro-it, but also on the predictability of future results and on company cash low, that is, regarding the quality of pro-its (Hanlon, 2005; Tang, 2006). As these are some of the features of companies afected by BTDs, observing them may assist economic agents with regards to company eva-luations (Hanlon, 2005).
Tang (2006) researched – using publicly traded Chi-nese company data – whether information gathered in BTDs could be used in order to evaluate forecasts for future income and for return on company shares; the author found a negative connection between BTD levels and earnings forecasts, suggesting that book-tax diferen-ces exhibit transitory components of current proit and of company cash low. he uncertainty of possible reversals of these transitory components contributes to underes-timating future results. herefore, economic agents can use the information contained in BTDs to evaluate future company performance.
into their forecasts.
If diferences between accounting income and taxable income can have an impact on companies’ results, then an interpretation of the information gathered in BTDs may assist investors in forecasting future company results. he irst study hypothesis emerges in light of this:
H1: he higher the level of total BTDs, the lower ex-pectations are regarding future results for publicly traded companies in Latin America.
his hypothesis is reinforced by the results of the stu-dy by Hanlon (2005) carried out with data for companies from the United States, in which companies with higher levels of BTDs have less persistent future earnings than companies with smaller diferences between accounting income and taxable income. Furthermore, in countries with higher inancial and tax compliance, future results are less persistent and more weakly correlated with future cash lows (Atwood, Drake, & Myers, 2010). he coupling of total BTDs with a history of greater links between ac-counting norms and tax rules in Latin American coun-tries ofers evidence that those companies – the subject of this study – with higher levels of BTDs will have lower performance in following years.
In order to improve the interpretation of the content of BTDs, it would be ideal to analyze them by type, given that separation provides additional information for inves-tors. Each type of BTD ofers diferent information about the quality of reported results (Tang & Firth, 2012).
2.3 Types of Book-Tax Differences
A detailed understanding of the information contai-ned in BTDs assists in analyzing the quality of current results and in forecasting future results. Earnings mana-gement and tax manamana-gement practices can be revealed by analyzing the content of diferent types of BTDs (Com-prix, Graham Jr., & Moore, 2011). he consequences of such opportunistic management practices can compro-mise company cash low, results for a period, and, conse-quently, investor conidence in companies (Hanlon, 2005; Blaylock et al., 2012). hus, separating BTDs by type can make it possible for investors to make more precise infe-rences with regards to future company earnings.
Temporary and permanent BTDs can provide infor-mation that assists economic agents with their decision making regarding forecasts for future company results (Barth, Landsman, & Lang, 2008). Permanent BTDs emerge when an economic event (revenue and/or expen-se) is identiied for accounting purposes, but the tax ru-les impede recognition for tax purposes (Lev & Nissim, 2004). Temporary diferences, in turn, take place when an economic event is recognized with the same value for ac-counting and tax purposes, however at diferent moments. Temporary BTDs originate from earnings manage-ment, from tax management and from diferences be-tween accounting standards and tax rules (Hanlon, 2005; Frank et al., 2009; Blaylock et al., 2012). As tax rules are inlexible when compared to GAAP, they result in greater positive temporary diferences due to management
dis-cretion in accounting practice choices for releasing inan-cial reports (Blaylock et al., 2012).
Tax management, in turn, has the aim of delaying taxes by as long as possible, leading to greater levels of deferred tax expenses; however, unlike earnings manage-ment, it does not tend to be reversed the following year (Blaylock et al., 2012). Another motivation presented for the emergence of temporary BTDs simply derives from the diferences between accounting norms and tax rules, in which managers make accounting choices without ul-terior motives related to tax management and earnings management (Blaylock et al., 2012).
Hanlon (2005), in her analysis of the efects of higher temporary BTDS on future earnings and the persistence of accruals, claimed that discretionary accruals are less persistent than non discretionary ones. She also reported that companies with higher temporary BTDs present lo-wer future earnings and less persistence of accruals, when compared to companies with lower BTDs. For the author, when accounting income is higher than taxable income, results are of poorer quality, that is, less persistent. Accor-ding to this author, investors seem to correctly consider this informational content of temporary BTDs in wei-ghing up the quality of reported proits. hus, hypothesis H2 emerges for testing:
H2: he higher the level of temporary BTDs, the lower the expectations regarding future results for publicly tra-ded companies in Latin American countries.
It is expected, in the context of Latin American coun-tries, that the higher the level of temporary BTDs, the lower future company results. Yet, each jurisdiction can exhibit diferent behaviors for this relationship, given that the relevance of the components of accounting infor-mation is strongly suggested by the level of inluence of tax rules over accounting norms in each country (Yoon, 2008). hus, if a country exhibits strong (weak) alignment of accounting norms with tax rules, this can result in ac-counting with low (high) informational quality.
Wilson (2009) used another type of BTD – permanent diferences – to investigate the connection between tax planning, wealth generation for shareholders, and ear-nings management. his author found that the majority of cases of tax evasion signiicantly increase permanent BTDs for companies; that is, investors have created the belief that, if managers are willing to deceive tax authori-ties, they may also be willing to deceive investors (Hanlon & Slemrod, 2009).
hus, permanent diferences are more strongly asso-ciated with market participant uncertainty regarding fu-ture company results than temporary diferences (Com-prix et al., 2011). his statement is reasonable because future reversals of deferred tax assets and of deferred tax liabilities (temporary BTDs) are more predictable than tax authorities accepting a tax account that gives rise to a permanent diference. In light of this, the third study hypothesis is presented:
publicly traded companies in Latin American countries. The signs of BTDs are also used by investors as an indicator of the quality of reported accounting num-bers. The highest negative variations in BTDs signal a reduction in the quality of accounting numbers (Han-lon, 2005). Negative changes in BTDs can indicate that taxable income has increased with relation to accoun-ting income, which alludes to the fact that companies have elevated tax accounts and lower future cash flow (Ayres et al., 2010). Companies with greater positive va-riations in BTDs also exhibit lower future results and company cash flow (Hanlon, 2005). Thus, both varia-tions (positive and negative) in BTDs have an impact on forecasting accounting numbers.
The relationship between the sign of BTDs (posi-tive and nega(posi-tive) was also studied by Heltzer (2009), who investigated the connection between the quality of accounting information – using accounting conser-vatism as a proxy for quality – and the signs of BTDs. This author showed that in years in which companies presented negative BTDs, they exhibited greater uncon-ditional conservatism in accounting income and lower conditional and unconditional conservatism in taxable income. This fact points to a deterioration in the quality of results, since unconditional conservatism is related to earnings management practices (Qiang, 2007). This is due to companies less timely recognizing losses in ac-counting income.
In turn, in years with positive variations in BTDs, companies exhibit a decrease in conditional conserva-tism in financial statements, with relation to other years in the sample (Heltzer, 2009). In years in which compa-nies present positive variations in BTDs, they exhibited an increase in timely recognition of earnings, or rather, a reduction in conditional conservatism, with relation
to other years in the sample (Heltzer, 2009); however, this may be a sign of earnings management (Hanlon, 2005).
As well as investigating the signs (positive/negative) of BTDs, analysis of their variations is an important ele-ment in evaluating the quality of company results. So far as positive and negative changes in BTDs reveal in-formation about the quality of results and about off ba-lance sheet financing, such differences can be relevant for economic agents (Ayres et al., 2010).
Greater negative variations in BTDs can be indica-tors of a reduction in the quality of company results (Hanlon, 2005; Ayres et al., 2010). Since this involves situations in which taxable income has increased with relation to accounting income, it implies the fact that companies have higher tax accounts and lower available cash flow (Ayres et al., 2010). The greatest positive va-riations in BTDs can also be a sign of reductions in the quality of reported earnings and increases in off balance sheet financing, that is, accounting income has increa-sed in relation to taxable income (Ayres et al., 2010).
Thus, to calculate whether positive and/or negative changes in BTDs influence forecasts for future results for publicly traded companies from Latin American countries, the fourth study hypothesis is presented:
H4: There is an inversely proportional relationship between positive and negative variations in BTDs and future results for publicly traded companies from Latin American countries.
In light of this, it is believed that the higher the ne-gative/positive variation in BTDs, the lower the fore-cast for future company results (Hanlon, 2005; Heltzer, 2009; Ayres et al., 2010), given that the greatest varia-tions in BTDs have an impact on the quality of repor-ted earnings.
3 METHODOLOGY
3.1 Sample Selection Parameters and Collection
of Data
he subject population for this study consists of publi-cly traded companies from Latin American countries that traded their shares on the Stock Exchange between 2002 and 2013, and which have data available in the Economa-tica® database. Furthermore, countries that adopted Inter-national Financial Reporting Standard – compulsory for all publicly traded companies by 2012 - were selected, thus forming a sample with a single accounting standard.
Considering the population composed of twenty coun-tries, eight were excluded for not compulsorily adopting IFRS for all publicly traded companies by 2012, and seven countries for not having available data in the Economática® database. his resulted in the inal sample for this study, composed of ive jurisdictions, namely: Argentina, Brazil, Chile, Mexico, and Peru, which together are responsible for approximately 78% of the total GDP for Latin America.
It is thus veriied that the sample for this study represents the economy of the region in question, a fact that can war-rant generalization of the results found for the ive coun-tries in the sample for the Latin American context.
Regarding the procedures used for selecting the panies that compose the inal sample for this study – com-posed of 580 non inancial publicly traded companies – publicly traded companies with missing data and/or which did not have at least three consecutive values for the de-pendent variable EPSit+1, were excluded.
is, the US dollar, was used as a parameter for this study.
3.2 Empirical Models for Calculating Book-Tax
Differences
Five types of differences were used, which are: total (BTD), temporary (TEBDT), and permanent (PBTD),
tested by Costa (2012), and positive and negative va-riations (ΔBTD), tested by Ayers et al. (2010), and des-cribed below in Equations 1, 2, 3, and 4, respectively, with the intention of analyzing which of them may be relevant in forecasting future company results in Latin American countries.
In which:
BTDit = total diference between accounting income and taxable income for company i in year t; PBITit = accoun-ting proit before income tax for company i in year t; TIit = taxable income for company i in year t; TA it-1 = total assets of company i in year t-1 (lagged assets); TEBTDit = temporary diference between accounting income and taxable income for company i in year t; DITit = deferred income tax (proit and loss account) for company i in year t; Rit = maximum income tax rate: Argentina (35%), Brazil (34%), Chile (20%), Peru (30%), and Mexico (33%); PB-TDit = permanent diference between accounting income and taxable income for company i in year t; ΔBTDit = is the value of the diference between BTD of company i in year t and BTD for company i in year t-1. It shows whe-ther the variation in BTDs was positive or negative from year t to year t-1. All of the variables are pondered by total lagged assets.
Due to publicly traded companies’ non disclosure of taxable income (TI) values (Hanlon, 2003; Costa, 2012), a proxy resulting from calculating the relationship be-tween total income tax expenses (ITC) and the maxi-mum income tax rate in the country (R) was employed, as used by Hanlon (2005). For the five countries that are the subject of this study, information on TI was searched for in the financial statements published by the publicly traded companies; however, these companies did not re-port TI values. Accounting statements for 130 randomly selected publicly traded companies, covering 2002 to 2013, were analyzed.
Despite the fact that the efective rate (the ratio
betwe-en income tax expbetwe-enses and PBIT) can exhibit superior or inferior values to those of the maximum rate, there is evidence that the estimate for the taxable value – taking into consideration maximum income tax rates instead of companies’ efective rates – does not signiicantly afect the results of the equation (Lev & Nissim, 2004). his me-asure for taxable income has been used in some previous studies, such as in Hanlon (2005), Ayers et al. (2010), and Costa (2012).
he maximum rate of income tax is also used to calcu-late TEBTD. his diference is calcucalcu-lated by extrapolating deferred income tax (DIT) by the maximum rate. hus, TEBTD is a proxy for the temporary diference between accounting income and taxable income. here is a limi-tation in the accounting norm for recognizing DIT, whi-ch can afect TEBTD calculations; the same occurs with the maximum rate, which may not represent the efecti-ve rate. Howeefecti-ver, this proxy was used by (Lev & Nissim, 2004; Hanlon, 2005; Atwood et al., 2010; Nakao, 2012).
Ater calculating the components of BTDs, we proceed to the empirical regression model for forecasting future results. his model aims to investigate the efects of di-ferences between accounting income and taxable income on the informational relevance of the accounting num-bers reported, measured by future results. his model was developed from the methodology shown by Tang (2006), with the inclusion of control variables suggested in pre-vious literature (Yoon, 2008; Costa, 2012).
he original regression model for future results pro-posed by Tang (2006) examines the content of BTDs for forecasting future earnings, as shown in Equation 5:
1
2
3
In which:
EPSit+1 = value of net proit per share for company i in year t+1, scaled by the share price on April 30th, ater the
end of inancial year t-1; EPSit = value of net proit per share for company i in year t, scaled by the share price on April 30th, ater the end of inancial year t-1; εt+1 = error
term.
With Equation 6, the relationship between current earnings, the total, permanent, temporary, positive and negative types of BTDs, and some control variables, with future results forecasts for publicly traded companies in ive Latin American countries, is investigated.
In which:
Xit = represents the independent variables total BTD, permanent PBTD, temporary TEBTD, positive and nega-tive variations in BTDs (VNBTD = binary variable with value 1 for the variation from year t to year t+1in the BTD in the lowest quintile and 0 for the rest; VPBTD = binary variable with value 1 for the variation from year t to year t+1 in the BTD in the highest quintile and 0 for the rest); GFAit = level of ixed assets of company i in year t (gross ixed plus intangible assets scaled by total assets); NLTAit = Natural logarithm of total assets of company i at the end
of year t (indicates company size); ΔBTMit = Variation in BTM ratio of company i from year t-1 to year t. Where BTM is the natural logarithm of the ratio between the ac-counting value of net equity (NE) of company i in year t and the market value of the shares of company i in year t; Lit = Variation in leverage of company i from year t-1 to year t. L is calculated as long term debt delated by total assets for year t-1; εt+1 = error term.
he Chow, Lagrange Multiplier (LM) and Breusch-Pa-gan tests are used to choose the most suitable regression model to be used for the study data.
4 RESULTS
4.1 Descriptive Statistics
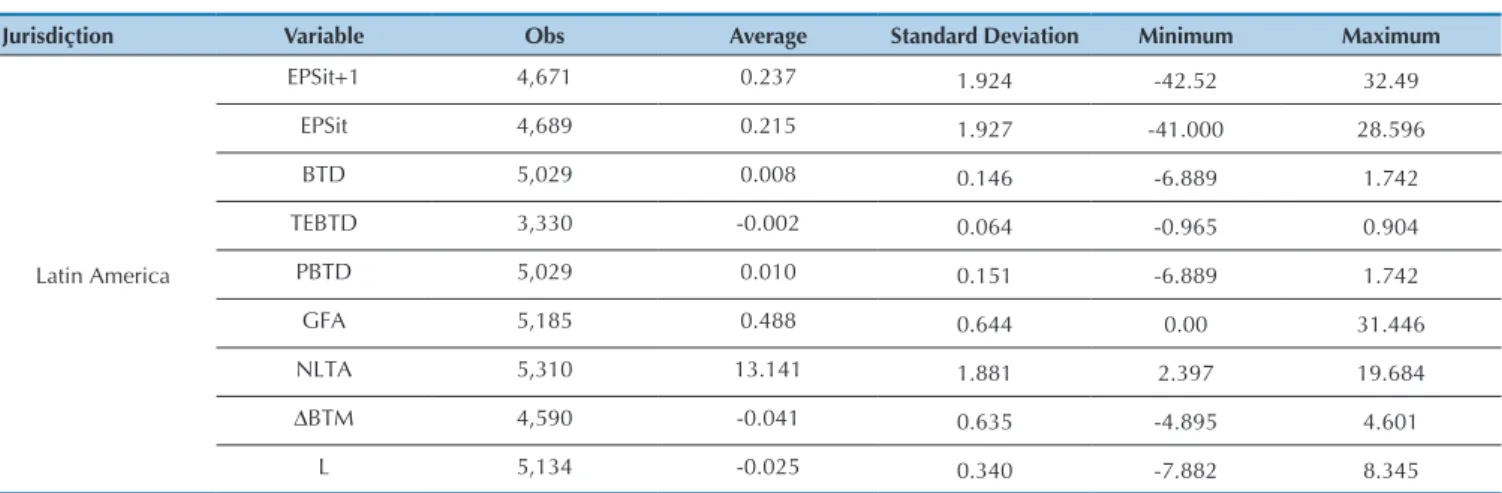
In Table 1 the descriptive statistics for the continuous variables from the future results forecast model for the five Latin American countries which compose the pro-posed selection are presented. The total sample for this
study is composed of 5,800 observations (NxT) and a sample without outliers (NxT=5,065). As the distribu-tion of future results in this study was very volatile, the sample without outliers was chosen to work with, accor-ding to standard deviation.
5
6
EPSit+1 = logarithm of net profit per share for company i in year t+1, scaled by the share price on April 30
th, after the end of financial year t-1; EPS
it = logarithm of net
profit per share for company i in year t, scaled by the share price on April 30th, after the end of financial year t-1; BTD = BTD calculated as the total difference between
accounting income and taxable income; TEBTD = temporary BTD; PBTD = permanent BTD; NLTA = natural logarithm of total assets of company i in year t; ΔBTMit
= Variation in BTM ratio of company i from year t-1 to year t. BTM = natural logarithm of the ratio between the accounting value of NE and the market value of the shares of company i in year t; L = Variation in leverage calculated as long term debt deflated by total assets of company i in year t-1.
Source: Prepared by the authors.
Table 1 Descriptive Statistic of Continuous Variables
Jurisdiçtion Variable Obs Average Standard Deviation Minimum Maximum
Latin America
EPSit+1 4,671 0.237 1.924 -42.52 32.49
EPSit 4,689 0.215 1.927 -41.000 28.596
BTD 5,029 0.008 0.146 -6.889 1.742
TEBTD 3,330 -0.002 0.064 -0.965 0.904
PBTD 5,029 0.010 0.151 -6.889 1.742
GFA 5,185 0.488 0.644 0.00 31.446
NLTA 5,310 13.141 1.881 2.397 19.684
ΔBTM 4,590 -0.041 0.635 -4.895 4.601
VNBTD = binary variable with value 1 for the variation from year t to year t+1 in the BTD in the lowest quintile and 0 for the rest; VPBTD = binary variable with value 1 for the variation from year t to year t+1 in the BTD in the highest quintile and 0 for the rest.
Source: Prepared by the authors.
*p<10%; ** p<5%; *** p<1%. Equation 1 = using the total BTD type; Equation 2 = using the temporary and permanent BTD type; Equation 3 = using the negative and positive BTD type.
Source: Prepared by the authors.
To exclude the outliers, calculations of the dfits sta-tistics for each standardized residual were used and the cut-off points suggested by Baum (2006), whose criteria involves excluding those observations with |difts| > 2.0 (k/N)1/5, were adopted, in which k = number of
parame-ters in the model, and N = number of observations. The averages and standard deviations for BTD, TEBTD and PBTD are close to zero, given that they were scaled by lagged total assets and represent a percentage of these assets. The values found for the average BTD (0.008) for Latin America are close to those found by Tang (2006) for the Chinese capital market (-0.010), as well as by Wilson (2009) and by Costa (2012) for Brazil (-0.02 and 0.007, respectively).
The values found for the average TEBTDs (-0.002) for Latin America were close to those shown by Hanlon (2005) for the US market (0.001) and by Costa (2012) for Brazil (-0.006). For the average PBTDs, values close (0.010) to those shown in previous literature were also
found. Comprix et al. (2011) showed an average of 0.02 and Costa (2012) found an average of 0.012 in the Brazi-lian capital market.
Table 1 exhibits the average for the dependent va-riable EPSit+1 (0.237) and for the independent variable EPSit (0.215); it is found that, on average, the future re-sults of publicly traded companies from the five Latin American countries are greater than the current results. In the Chinese stock market, on the other hand, cur-rent earnings have a higher average (0.038) than future earnings (0.029), as indicated by Tang (2006). As total assets represent company size (in this study, the log of total assets), it is verified in Table 1 that the average size of companies in Latin American countries is 13.141. The average for the ΔBTM variable in Latin America is -0.041, suggesting that the market value is greater than the accounting value of net equity for these companies.
In Table 2, the proportions of the binary variables of the models are presented.
Table 2 Proportion of binary variables
Table 3 Chow, Breusch-Pagan and Hausman Tests
Variable Description N. Obs % Obs
VNBTD
0 remaining Δ in BTD 4,109 81.67%
1 Δ in BTD in lowest quintile 922 18.33%
Total 5,031 100%
VPBTD
0 remaining Δ in BTD 4,753 94.51%
1 Δ in BTD in highest quintile 276 5.49%
Total 5,029 100%
Country Breusch-Pagan Hausman Chow Suitable
Specification
Chi2 Chi2 F
Equation 1 1.95* 226.61*** 1.43*** Fixed Effect
Equation 2 0.00 147.03*** 1.15** Fixed Effect
Equation 3 0.04 193.07*** 1.29*** Fixed Effect
According to Ayres et al. (2010), changes in the signs of the BTDs have an influence on the relevance of ac-counting numbers for external users. It is verified that 18.33% of the companies in the study sample exhibited a negative variation in the lowest quintile of BTDs and 5.49% exhibited positive variations in the highest quin-tile of BTDs. In both cases of variations of BTDs, they can be interpreted as a loss in the quality of earnings (Hanlon, 2005; Ayres et al., 2010).
4.2 Empirical Results for the Future Results
Forecasting Model
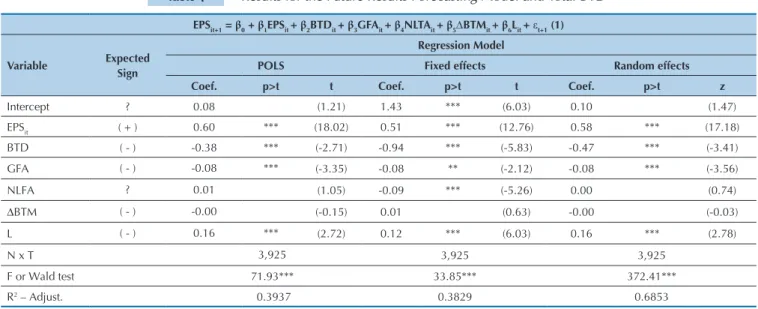
he results from the regression models based on total BTDs (Table 4) provide statistical evidence from the F test equal to 33.85, with a 1% degree of statistical signiicance,
suggesting that the average for all of the regressors toge-ther cannot be equal to zero. hus, the independent varia-bles seem to contribute to future results forecasts.
The findings for the model that looks for the con-nection between total BTDs and future results forecasts – for Latin American countries – shows that the EPSit va-riable exhibits a positive sign (as expected) and with sta-tistical significance (1%). In other words, current results for publicly traded companies from some Latin Ameri-can countries may influence investors in forecasting fu-ture results. These findings are similar to those of Tang (2006), in which current results are positively associated with future results in the context of the Chinese capital market. The BTD variable exhibits a negative sign and statistical significance (p<0.01), as expected for Hypo-thesis H1 in this study.
Thus, the BTDs of companies from Latin American countries suggest that the current profits of these com-panies are more transitory and less persistent in years with greater levels of BTDs (Tang, 2006) and, therefore, worse performance may be expected for years following greater levels of BTDs. Consequently, hypothesis H1 is accepted: the higher the level of total BTD, the lower the expectations regarding future results for publicly traded companies from Latin America.
In some jurisdictions, such as in China, information gathered in BTDs is more relevant than the result re-ported to investors itself (Tang, 2006). The results found – and mentioned in the previous paragraph – in the con-text of Latin America suggest that both current results as well as total BTDs are relevant for investors in forecas-ting upcoming company results.
Furthermore, in these Latin American countries in
which there is a history of greater financial and tax com-pliance (FTC), the components of accounting informa-tion – such as GFA, NLTA, and L – may be useful for forecasting future results, as shown in Table 4, conside-ring that the results for these variables present statistical significance. Therefore, the greater the amount of com-pany fixed assets, the lower the forecast for future inco-me, which may represent an interpretation by investors that the higher the level of investment in fixed assets, the greater depreciation expenses and, consequently, the lower company results.
Company size is negatively associated with the fore-casting of results (p < 0.01), that is, shareholders inter-pret that the bigger the company, the lower the forecast for future company results. These results are consistent with the claim of Cullinan (1999) that companies tend to make accounting choices motivated by size because they seek to reduce their political costs. The leverage varia-ble represents a positive (contrary to that expected) and statistically significant connection with current earnings forecasts, that is, the greater company leverage, the gre-ater the expectations regarding future company results.
The control variable ΔBTM exhibits a different sign to that expected (a positive sign), yet does not exhibit statistical significance. The positive and statistically sig-nificant coefficient for this variable indicates an increase in information asymmetry between investors and com-panies. In the context of these five Latin American coun-tries, no inferences can be made regarding the use of this information by investors.
* p < 10%; ** p < 5%; *** p < 1%. EPSit+1 = net profit per share for company i in year t+1, scaled by the share price on April 30
th, after the end of financial year t-1; EPS it
= net profit per share for company i in year t, scaled by the share price on April 30th, after the end of financial year t-1; BTD = book-tax differences calculated as the
total difference between accounting income and taxable income; GFA = gross fixed and intangible assets scaled by lagged total assets; NLTA = natural logarithm of total
assets of company i in year t; ΔBTM = Variation in BTM ratio of company i from year t-1 to year t. BTM = natural logarithm of the ratio between the accounting value
of NE and the market value of the shares of company i in year t; L = Company leverage calculated as long term debt deflated by total assets of company i in year t-1. Source: Prepared by the authors.
Table 4 Results for the Future Results Forecasting Model and Total BTD
EPSit+1 = β0 + β1EPSit + β2BTDit + β3GFAit + β4NLTAit + β5∆BTMit + β6Lit + εt+1 (1)
Variable Expected Sign
Regression Model
POLS Fixed effects Random effects
Coef. p>t t Coef. p>t t Coef. p>t z
Intercept ? 0.08 (1.21) 1.43 *** (6.03) 0.10 (1.47)
EPSit ( + ) 0.60 *** (18.02) 0.51 *** (12.76) 0.58 *** (17.18)
BTD ( - ) -0.38 *** (-2.71) -0.94 *** (-5.83) -0.47 *** (-3.41)
GFA ( - ) -0.08 *** (-3.35) -0.08 ** (-2.12) -0.08 *** (-3.56)
NLFA ? 0.01 (1.05) -0.09 *** (-5.26) 0.00 (0.74)
ΔBTM ( - ) -0.00 (-0.15) 0.01 (0.63) -0.00 (-0.03)
L ( - ) 0.16 *** (2.72) 0.12 *** (6.03) 0.16 *** (2.78)
N x T 3,925 3,925 3,925
F or Wald test 71.93*** 33.85*** 372.41***
he results shown in Table 4 partially conirm the in-dings of Yoon (2008), when he compared the relevance of accounting information between countries considered to have low FTC and those considered to have high FTC; in those with high FTC, variations in sales, depreciation expenses, and tax values are less relevant for users of i-nancial statements when compared with countries with low FTC (Yoon, 2008). Faced with the assumption that managers are more likely to make decisions, with the in-tention of trying to reduce their tax expenses, in contexts with high FTC, the biggest aim would be to reduce taxa-tion, and not the relevant information that relects in ex-pectations for future results (Yoon, 2008). In the ive Latin American countries that are the subject of this study, both tax information as well as accounting information is rele-vant for investors.
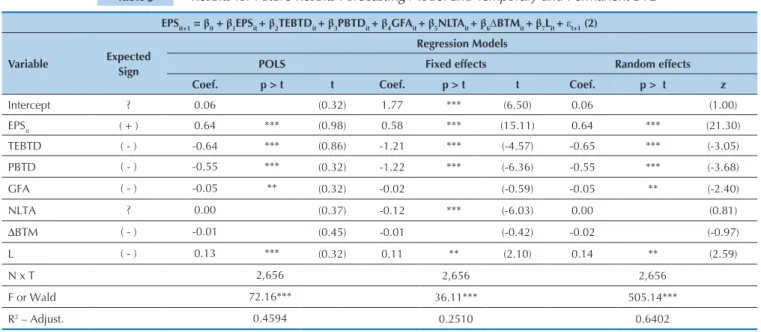
he results for the connection between the permanent and temporary types of BTD with future results forecasts – for the companies from Latin American countries – are presented in Table 5. For this regression model, it is also veriied that the independent variables are related to the dependent variable EPSt+1, given that the F test presents statistical signiicance (p-value < 0.01).
It is veriied in Table 5 that current earnings are po-sitively associated with the future results for companies from these Latin American countries, in accordance with Tang (2006). It is found that a statistically signiicant as-sociation exists between the temporary and permanent types of BTDs and forecasts for future company results, conirming within the context studied here the results found previously (Hanlon, 2005; Yoon, 2008; Blaylock et al., 2012).
Table 5 Results for Future Results Forecasting Model and Temporary and Permanent BTD
* p < 10%; ** p < 5%; *** p < 1%. EPSit+1 = net profit per share for company i in year t+1, scaled by the share price on April 30
th, after the end of financial
year t-1; EPSit = net profit per share for company i in year t, scaled by the share price on April 30
th, after the end of financial year t-1; TEBTD =
tem-porary BTD; PBTD = permanent BTD; GFA = gross fixed and intangible assets scaled by lagged total assets; NLTA = natural logarithm of total assets of
com-pany i in year t; ΔBTM = variation in BTM ratio of comcom-pany i from year t-1 to year t. BTM = natural logarithm of the ratio between the accounting value of NE
and the market value of the shares of company i in year t; L = company leverage calculated as long term debt deflated by total assets of company i in year t-1. Source: Prepared by the authors.
EPSit+1 = β0 + β1EPSit + β2TEBTDit + β3PBTDit + β4GFAit + β5NLTAit + β6∆BTMit + β7Lit + εt+1 (2)
Variable Expected Sign
Regression Models
POLS Fixed effects Random effects
Coef. p > t t Coef. p > t t Coef. p > t z
Intercept ? 0.06 (0.32) 1.77 *** (6.50) 0.06 (1.00)
EPSit ( + ) 0.64 *** (0.98) 0.58 *** (15.11) 0.64 *** (21.30)
TEBTD ( - ) -0.64 *** (0.86) -1.21 *** (-4.57) -0.65 *** (-3.05)
PBTD ( - ) -0.55 *** (0.32) -1.22 *** (-6.36) -0.55 *** (-3.68)
GFA ( - ) -0.05 ** (0.32) -0.02 (-0.59) -0.05 ** (-2.40)
NLTA ? 0.00 (0.37) -0.12 *** (-6.03) 0.00 (0.81)
ΔBTM ( - ) -0.01 (0.45) -0.01 (-0.42) -0.02 (-0.97)
L ( - ) 0.13 *** (0.32) 0.11 ** (2.10) 0.14 ** (2.59)
N x T 2,656 2,656 2,656
F or Wald 72.16*** 36.11*** 505.14***
R2 – Adjust. 0.4594 0.2510 0.6402
With regards to temporary BTDs, the results suggest that, the greater the level of this type of BTD, the less per-sistent these Latin American companies’ future results will be and, consequently, the greater the uncertainty re-garding future results. hese results ofer evidence that such diferences can originate from discretionary accru-als, since, according to Blaylock et al. (2012), and also to Hanlon (2005), they are less persistent and more likely to be reversed in subsequent periods, thus afecting com-pany results.
It is also important to highlight that as future results are less persistent in the context of these Latin American countries, (that is, the greater the TEBTDs, the lower the
Chile, before and after IFRS.
Given the results presented for the temporary BTDs, Hypothesis H2 of this study is accepted, which is: the greater the level of temporary BTDs, the lower expectations regarding future results for publicly tra-ded companies in Latin America. It is inferred that the greater the amount of temporary differences, the less persistent the future results of companies in Argentina, Brazil, Chile, Peru and Mexico.
With regards to permanent BTDs, the coefficient exhibits a negative (as expected) and statistically sig-nificant (p-value < 0.01) sign, which may be indicative that they have an impact on future company results. This uncertainty may be a reflection of the greater dis-cretion allowed for managers in these cases, conside-ring that they can incorporate non-taxable revenue and non-deductable expenses for income tax purposes into accounting results. Furthermore, cases of tax evasion increase the level of PBTDs (Wilson, 2009) and conse-quently, the risk of companies being penalized, which would compromise future company results.
However, a stronger connection for the permanent type of BTD when compared to temporary BTDs (both p-value < 0.01) with forecasts for future company re-sults was not identified, contradicting the prediction of Comprix et al. (2011). With the results presented, Hypothesis H3 is accepted, which claims that the higher the level of permanent BTDs, the lower the expecta-tions regarding future results for publicly traded
com-panies from Latin American countries.
For the control variables in the study, statistical sig-nificances were found in the context of publicly traded companies from Latin American countries only for size (NLTA) and leverage (Table 5). The greater the size of companies from these Latin American countries that compose the sample, the lower their future results will be, as indicated by Cullinan (1999) and also by Cos-ta, Silva and Laurencel (2013). The results for leverage show that higher company debt contributes to market uncertainty, in accordance with prior literature from Ayres et al. (2010).
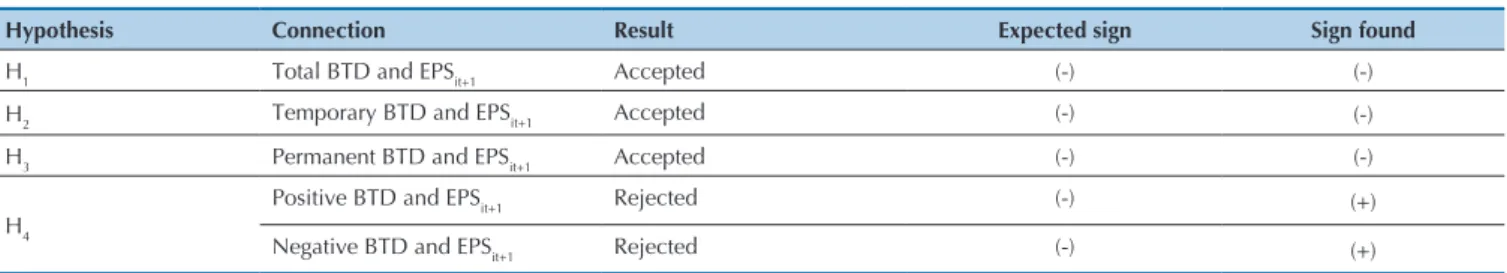
With analysis of the data from Table 6, it is veri-fied that the panel data technique is indicated for the regression with the positive and negative BTD varia-bles in the context of Latin America, since the F test and Wald Test exhibit strong statistical significance (p-value < 0.01). The variable coefficients, presented in Table 6, show that the variables from this study are associated with future results, except ΔBTM which did not exhibit statistical significance. These results are consistent with those of Yoon (2008), in concluding that the tax elements in financial statements are rele-vant in countries with higher FTC. Current earnings are positively associated with the future results of com-panies from some Latin American countries (p-value < 0.01), that is, the higher current results, the higher future company results, thus confirming the findings of Tang (2006).
Table 6 Results for Future Results Forecasting Model and Positive and Negative BTD
* p < 10%; ** p < 5%; *** p < 1%. EPSit+1 = net profit per share for company i in year t+1, scaled by the share price on April 30
th, after the end of financial year t-1;
EPSit = net profit per share for company i in year t, scaled by the share price on April 30
th, after the end of financial year t-1; VNBTD = binary variable with value 1 for
the variation from year t to year t+1 in the BTD in the lowest quintile and 0 for the rest; VPBTD = binary variable with value 1 for the variation from year t to year t+1 in the BTD in the highest quintile and 0 for the rest; GFA = gross fixed and intangible assets scaled by lagged total assets; NLTA = natural logarithm of total assets of
company i at the end of year t; ΔBTM = variation in BTM ratio of company i from year t-1 to year t; BTM = natural logarithm of the ratio between the accounting value
of NE and the market value of the shares of company i in year t; L = company leverage calculated as long term debt deflated by total assets of company i in year t-1 Source: Developed by the authors.
EPSit+1 = β0 + β1EPSit + β2VNBTDit + β3VPBTDit + β4GFAit + β5NLTAit + β6∆BTMit + β7Lit + εt+1 (3)
Variable Expected Sign
Regression Models
POLS Fixed effects Random effects
Coef. p > t t Coef. p > t t Coef. p > t z
Intercept ? 0.09 (6.10) 1.48 *** (6.10) 0.11 (1.06)
EPSit ( + ) 0.58 *** (11.52) 0.48 *** (11.52) 0.56 *** (0.74)
VNBTD ( - ) -0.01 (2.93) 0.07 *** (2.93) 0.00 (-0.95)
VPBTD ( - ) 0.12 *** (2.68) 0.09 *** (2.68) 0.12 *** (-1.06)
GFA ( - ) -0.07 *** (-2.01) -0.08 ** (-2.01) -0.08 *** (-1.03)
NLTA ? 0.00 (-5.45) -0.09 *** (-5.45) 0.00 (-1.06)
ΔBTM ( - ) -0.00 (0.73) 0.01 (0.73) 0.00 (1.03)
L ( - ) 0.17 *** (2.30) 0.14 ** (2.30) 0.17 *** (-0.13)
N x T 3,930 3,930 3,930
For Wald test 76.75*** 29.73*** 476.13***
R2 0.3899 0.2545 0.2458
he positive coeicient for the VPBTD variable, con-trary to expected, shows that the greater the positive va-riation in BTDs (that is, higher accounting income than
results, which may be evidence of lower conditional con-servatism in inancial statements, which is consistent with research carried out by Heltzer (2009); and contrary to the conjecture – proposed by Hanlon (2005), by Ayres et al. (2010), and by Tang and Firth (2012) – that large po-sitive variations in BTDs are related to lower upcoming earnings.
hus, since the results for VPBTD are inconsistent with Hypothesis H4 – that there is an inversely proportio-nal relationship between a positive sign for BTDs and the future results of publicly traded Latin American countries – this hypothesis is rejected.
he positive results exhibited for the VNBTD varia-ble coeicient suggest that in years with large negative variations in BTDs (that is, taxable income higher than accounting income), investors in Latin American compa-nies may overestimate company results. A positive sign for VNBTD may be a sign of a reduction in of balance sheet inancing (Ayres et al., 2010), seen as something that is positive for companies. hese discoveries constitute a surprise, given that Hanlon (2005) found contrary results when researching data from American companies. he greater the negative variation in BTDs, the lower the fore-cast for upcoming company results (Hanlon, 2005; Ayres et al., 2010).
he rest of the control variables also exhibit statisti-cal signiicance, except for ΔBTM, showing that in this regression model with positive and negative BTDs, they
should be used – by investors and analysts of Latin Ame-rican companies – for forecasting future results. he amount of ixed assets of publicly traded companies from some Latin American countries is negatively associated with future results (p-value < 0.01), conirming the pre-vious assumption that greater investment in ixed assets results in higher depreciation, depletion and amortization expenses; higher levels of expenses can result in lower company results.
Company size (NLTA) also exhibits the expected coe-icient (negative) p-value < 0.01; thus, it can be inferred that the bigger the publicly traded Latin American com-pany, which compose the study sample, the lower future results are. hese results show that the accounting choices of managers at the Latin American companies are mo-tivated by company size, in accordance with Jaafar and McLeay (2007).
he positive coeicient exhibited for the leverage va-riable (p-value < 0.05) suggests that the higher the level of debt of the companies in the sample, the higher future company results. Ayres et al. (2010) argue that, the more leveraged companies are, the greater economic agents’ mistrust with relation to the company.
It can be inferred that the total, permanent, tempora-ry, positive and negative BTD types are used by economic agents for forecasting the future results of publicly traded companies from ive Latin American countries, as shown in Table 7.
Source: Prepared by the authors.
Table 7 Overview of the relationship between hypotheses, variables, expected signs and signs found
Hypothesis Connection Result Expected sign Sign found
H1 Total BTD and EPSit+1 Accepted (-) (-)
H2 Temporary BTD and EPSit+1 Accepted (-) (-)
H3 Permanent BTD and EPSit+1 Accepted (-) (-)
H4
Positive BTD and EPSit+1 Rejected (-) (+)
Negative BTD and EPSit+1 Rejected (-) (+)
It is important to highlight that, in Latin American countries – even with a history of greater inancial and tax compliance, with accounting indirectly regulated by
the government, and the stock market exhibiting weak in-vestor protection – the information gathered in BTDs is relevant for forecasting future results.
5 CONCLUDING REMARKS
This study investigates the usefulness of different types of BTDs for forecasting the future results of com-panies from the stock markets of five Latin American countries (Argentina, Brazil, Chile, Mexico, and Peru). Previous literature suggests that the tax information con-tained in financial statements provides clues regarding the companies’ future earnings and cash flow. Yet, the results are contradictory, since there is no consensus as
to whether BTDs are used and which types of BTDs are used by economic agents in company evaluations.
these countries provide an environment which is favora-ble for testing the hypotheses of this study. Furthermore, as these countries have their own peculiar characteris-tics, they may present different results to previous stu-dies regarding BTDs.
The results found provide evidence that the total, temporary, and permanent types of BTDs and positive and negative variations in them may be relevant for in-vestors in publicly traded companies in these five Latin American countries for forecasting future results. The total, temporary, and permanent types of BTDs exhibit negative coefficients for the relationship with future re-sults forecasts, which is consistent with hypotheses H1, H2 e H3. Thus, it can be inferred that, the greater the le-vels of these types of BTDs, the lower the future results of the publicly traded companies analyzed.
There is evidence that the current profits of the pu-blicly traded companies from the five Latin American countries are more transitory and less persistent in ye-ars with higher BTDs; thus, weaker performance can be expected for years following periods with greater levels of BTDs. It is suggested that the temporary BTDs of the companies that are the subject of this study may origina-te from earnings management, given that the companies exhibit lower future results in years with greater tempo-rary BTDs arising from this management practice. As a higher level of permanent BTDs is an indicator of tax evasion activities, it is suggested that, in years with grea-ter amounts of permanent BTDs, they can be ingrea-terpreted as tax management activity and, consequently, deteriora-tion in the quality of the accounting numbers reported. The positive and negative variations in BTDs exhibit positive coefficients, contrary to expected. The positive coefficient for the positive variations in BTDs may be a sign of increased timeliness in results and less conditio-nal conservatism in the financial statements of publicly traded companies from Latin American countries. The positive coefficient for the negative variations in BTDs, in turn, may represent a reduction in off balance sheet fi-nancing at these institutions from Latin American coun-tries, which would be seen as positive information regar-ding company results. Thus, there is evidence that the greater the variations in BTDs, the higher the companies’ future results, and, therefore, hypothesis H4 is rejected.
It should still be noted that the available database pre-vents inference of the results for all Latin American coun-tries, given that of the 20 countries in this region, only five have public data available the Economatica® system. Another important question arises from the fact that the share prices on April 30th, after the end of the financial
year t-1, may not reflect the impact of BTDs, since they are affected by a multifaceted set of factors that were not predicted in the models estimated. Despite structured
panel data with models estimated for fixed effects, which control the variables that are constant with time (indi-vidual differences), being used, even still, the lack of an inclusion of capital structure and corporate governance factors (which can change with time), for example, may skew the results.
Another limitation of this study regards the estima-tion for the calculaestima-tion of BTDs, primarily the TI calcu-lation. TI was estimated via extrapolation of current in-come tax expense and the maximum tax rate; it is not the ideal measure, since it contains measurement errors, but it is the information available to economic agents. The TI information was searched for in the financial statements published by the publicly traded companies that were the subject of the study, however these companies did not disclose the value of TI. Financial statements from 2002 to 2013 were analyzed for the 130 randomly chosen pu-blicly traded companies.
The taxable income calculation using current income tax expense information may contain measurement er-rors for three main reasons, namely: (i) current income tax expenses may not represent companies’ real taxable liabilities; (ii) the value for TI obtained via the extrapo-lation of current income tax may result in an imprecise estimate in cases in which companies have tax credits – the effective tax used for the calculation of income tax is different to the maximum rate and in cases of companies with tax losses; and (iii) the reconciliations of the sour-ces of differensour-ces between TI and AI are not standardi-zed and, in most companies, are not disclosed (Hanlon, 2003).
Even though extrapolation of TI is not the ideal mea-sure, this proxy has been used in previous studies (Lev & Nissim, 2004; Hanlon, 2005; Frank et al., 2009; Comprix et al., 2012; Nakao, 2012; Costa, 2012). Moreover, the inclusion of more control variables, beyond those origi-nally proposed by Tang (2006) – as well as the existence of the lagged dependent variable in the models, which were estimated for fixed effects, which control effects that are constant over time – softens the potential spe-cification problem: omitted variables and measurement errors in the independent variables.
Atwood, T. J., Drake, M. S., & Myers, L. A. (2010). Book-Tax Conformity, Earnings Persistence and the Association Between Earnings and Future Cash Flows. Journal of Accounting and Economics, 50, 111-125.
Ayers, B. C., Laplante, S. K., & Mcguire, S. T. (2010). Credit Ratings and Taxes: The Effect of Book-Tax Differences on Ratings Changes. Contemporary Accounting Research, 27(2), 359–402. Barth, M. E., Beaver, W.H., & Landsman, W.R. (2001). The relevance
of the value-relevance literature for financial accounting standard setting. Journal of Accounting and Economics, 31(1–3), 77–104. Barth, M. E., Landsman, W. R., & Lang, M. H. (2008). International
accounting standards and accounting quality. Journal of Accounting Research, 46(3), 467-498.
Baum, C. (2006). An introduction to modern econometrics using Stata. Texas: Stata Press.
Blaylock, B., Shevlin, T., & Wilson, R. J. (2012) Tax avoidance, large positive temporary book-tax differences, and earnings persistence. The Accounting Review, 87(1), 91-120. Comprix, J., Graham Jr. R. C., & Moore, J. A. (2011). Empirical
evidence on the impact of book-tax differences on divergence of opinion among investors. Journal of the American Taxation Association, 33(1), 57-78.
Costa, P. S. (2012). Implicações da Adoção das IFRS Sobre a Conformidade Financeira e Fiscal das Companhias Abertas Brasileiras. Tese (Doutorado em Controladoria e Contabilidade: Contabilidade) - Faculdade de Economia, Administração e Contabilidade, Universidade de São Paulo, São Paulo. Costa, T. A., Silva, A. H. C., & Laurencel, L. C. (2013). Escolha
de práticas contábeis: um estudo sobre propriedades para investimento em empresas brasileiras não financeiras de capital aberto. Revista de Contabilidade e Organizações, 18, 25-36. Cullinan, C. P. (1999). International Trade and Accounting Policy
Choice: Theory and Canadian Evidence. The International Journal of Accounting, 34(4), 597-607.
Desai, M. A. (2005). The Degradation of Reported Corporate Profits. Journal of Economics Perspectives, 19(4), 171-192.
Frank, M. M., Lynch, L. J., & Rego, S. O. (2009). Tax Reporting Aggressive Ness and its Relation to Agressive Financial Reporting. The Accounting Review, 84(2), 467-496.
Guenther, D. A., & Young, D. (2000). The association between financial accounting measures and real economic activity: a multinational study. Journal of Accounting and Economics, 29, 53-72.
Hanlon, M. (2003). What Can We Infer About a Firm’s Taxable Income from its Financial Statements? National Tax Journal, 56(4), 831-863.
Hanlon, M. (2005). The Persistence and Pricing of Earnings, Accruals
and Cash Flows When Firms Have Large Book-Tax Differences. The Accounting Review, 80(1), 137-166.
Hanlon, M., & Slemrod, J. (2009). What does tax aggressiveness signal? Evidence from stock price reactions to news about tax shelter involvement. Journal of Public Economics, 93, 126-141. Heltzer, W. (2009). Conservatism and Book-Tax Differences. Journal
of Accounting, Auditing & Finance, 24(3), 469-504.
Jaafar, A., & McLeay S. (2007). Country Effects and Sector Effects on the Harmonization of the Accounting Policy Choice. Abacus, 43(2), 156-189.
La Porta, R., De-Silanes, F. L., & Shleifer (2008). A. The Economic Consequences of Legal Origins. Journal of Economic Literature, 46(2), 285-332.
Lev, B., & Nissim, D. (2004). Taxable income, future earnings, and equity values. The Accounting Review, 79(4), 1039-1074. Meyer, J. W., & Rowan, B. (1977). Institutionalized Organizations:
Formal Structure as Myth and Ceremony. American Journal of Sociology, 83(2), 340-363.
Nakao, S. H. (2012). A adoção de IFRS e o Legado da Conformidade Mandatória Contábil- Fiscal. Tese (de Livre Docência) – Faculdade de Economia, Administração e Contabilidade, Universidade de São Paulo, Ribeirão Preto.
Qiang, X. (2007). The effects of contracting, litigation, regulation, and tax costs on conditional and unconditional conservatism: cross-sectional evidence at the firm level. The Accounting Review, 82(3), 759-796.
Shackelford, D., Slemrod, J., & Sallee, J. (2011). Financial reporting tax, and real decisions: toward a unifying framework. International Tax and Public Finance, 18(4), 461-494.
Tang, T. (2006). The Value Relevance of Book-Tax Differences — An Empirical Study in China’s Capital Market. SSRN.
Tang, T., & Firth, M. (2012). Earnings Persistence and Stock Market Reactions to the Different Information in Book-Tax Differences: Evidence from China. The International Journal of Accounting, 47, 369-397.
Tang, T. (2014). Does Book-Tax Conformity Deter Opportunistic Book and Tax Reporting? An International Analysis. PAPER University of British Columbia Faculty of Management. Yoon, S. W. (2008). An International Study of the Relation Between
Book-Tax Conformity and the Value Relevance of Earnings Components. Journal of International Business Research, 7(2), 31-56.
Weber, D. P. (2009). Do Analysts and Investors Fully Appreciate the Implications of Book-Tax Differences for Future Earnings? Contemporary Accounting Research, 26, 1175–1206.
Wilson, R. J. (2009). An examination of corporate tax shelter participants. The Accounting Review, 84(3), 969–999.
References
Correspondence Address:
Alessandra Vieira Cunha Marques
Faculdade de Ciências Contábeis, Universidade Federal de Uberlândia Avenida João Naves de Ávila, 2121 – CEP: 38400-902