Trend of oral and pharyngeal cancer
mortality in Brazil in the period of
2002 to 2013
Lillia Magali Estrada PereaI, Marco Aurélio PeresII, Antonio Fernando BoingIII, José Leopoldo
Ferreira AntunesIV
I Universidade Federal de Santa Catarina. Programa de Pós-Graduação em Saúde Coletiva. Florianópolis, SC, Brasil II University of Adelaide. Adelaide Dental School. Australian Research Center for Population Oral Health. Adelaide,
Australia
III Universidade Federal de Santa Catarina. Departamento de Saúde Pública. Florianópolis, SC, Brasil
IV Universidade de São Paulo. Faculdade de Saúde Pública. Departamento de Epidemiologia. São Paulo, SP, Brasil
ABSTRACT
OBJECTIVE: To analyze the trend of oral and pharyngeal cancer mortality rates in the period of 2002 to 2013 in Brazil according to sex, anatomical site, and macroregion of the country.
METHODS: he mortality data were obtained from the Mortality Information System and the population data were obtained from the Brazilian Institute of Geography and Statistics. he trend of the rates standardized by sex and age was calculated using the Prais-Winsten estimation, and we obtained the annual percentage change and the respective 95% conidence intervals, analyzed according to sex, macroregion, and anatomical site.
RESULTS: he average coeicient of oral cancer mortality was 1.87 per 100,000 inhabitants and it remained stable during the study period. he coeicient of pharyngeal cancer mortality was 2.04 per 100,000 inhabitants and it presented an annual percentage change of -2.6%. Approximately eight in every 10 deaths occurred among men. here was an increase in the rates of oral cancer in the Northeast region (annual percentage change of 6.9%) and a decrease in the Southeast region (annual percentage change of -2.9%). Pharyngeal cancer mortality decreased in the Southeast and South regions with annual percentage change of -4.8% and -5.1% respectively. Cancer mortality for tonsil, other major salivary glands, hypopharynx, and other and unspeciied parts of mouth and pharynx showed a decreasing trend while the other sites presented stability.
CONCLUSIONS: Pharyngeal cancer mortality decreased in the period of 2002 to 2013. Oral cancer increased only in the Northeast region. Mortality for tonsil cancer, other major salivary glands, hypopharynx, and other and ill-deined sites in the lip, oral cavity, and pharynx decreased.
DESCRIPTORS: Mouth Neoplasms, mortality. Pharyngeal Neoplasms, mortality. Mortality, trends. Brazil.
Correspondence: Lillia Magali Estrada Perea Departamento de Saúde Pública – UFSC
Centro de Ciências da Saúde Campus Reitor João David Ferreira Lima
Rua Delfino Conti, s/n bloco H 88040-900 Florianópolis, SC, Brasil E-mail: [email protected]
Received: Jun 29, 2016 Approved: Jan 30, 2017
How to cite: Perea LME, Peres MA, Boing AF, Antunes JLF. Trend of oral and pharyngeal cancer mortality in Brazil in the period of 2002 to 2013. Rev Saude Publica. 2018;52:10.
Copyright: This is an open-access article distributed under the terms of the Creative Commons Attribution License, which permits unrestricted use, distribution, and reproduction in any medium, provided that the original author and source are credited.
INTRODUCTION
Oral and pharyngeal cancer is considered a global public health problem1. According to the
International Agency for Research on Cancera (IARC), 571,386 new cases of the disease were
diagnosed worldwide and 316,168 deaths were recorded in 2015. he literature estimates that these igures will increase in coming years, reaching 350,000 deaths in 2020, and resulting in a rate of 4.7 deaths per 100,000 inhabitants.
he mortality trend from this disease varies by region. In Europe, oral and pharyngeal cancer
mortality rates have been decreasing since the 1970s2, while in Oceania3 and in several Latin
American countries, these rates have been increasing since the 1980s4. Brazil is the country with
the highest mortality rates for both sites in Latin America5, showing an increase since the 1980s6.
here are several factors that may inluence the trend of mortality rates, such as changes in
the prevalence of exposure to the main risk factors of the disease7,8 and the availability and
access to diagnosis and early treatment. Signiicant variations have occurred in these factors in the Brazilian context since the last decades of the twentieth century.
According to data from the Observatory of the Brazilian Tobacco Control Policy (INCA)b,
there was a 46% decrease in the percentage of smokers between 1989 and 2013. On the other
hand, alcohol consumption, which was increasing since 1960, has stagnated since 20009.
Human papillomavirus (HPV) has also been associated with the carcinogenesis of this
disease, especially with oropharyngeal and tonsil cancer10. However, these changes have the
potential to modify or reduce rates only in the long term, since the efects of carcinogenic factors are cumulative and of long latency.
Another important factor that may inluence the trend of mortality is the early diagnosis of the disease and the provision of adequate therapy. Diagnosis in the late stages implies a
worse prognosis and a decrease in the survival rate11. Similarly, the advances in the techniques
used in the treatment can also inluence the quality of life of the patient and avoid possible
relapses that end in death12.
Boing et al.6 have analyzed the trends of oral and pharyngeal cancer mortality rates between 1979 and 2002 in Brazil and they have observed greater reduction in values for anatomical sites that are more accessible to clinical inspection, which suggests a possible connection between the visual facility for diagnostic examination and lower mortality rates. However, according to an electronic search conducted in the bibliographic databases SciELO, PubMed, Lilacs, and Scopus, we found no other trend studies since that last study that allow us to analyze the evolution of oral and pharyngeal cancer mortality rates according to speciic
anatomical site.
Brazil is in a process of demographic and epidemiological transition that has been directly afecting
the incidence and mortality of chronic non-communicable diseases1. his scenario demands
studies, follow-up, and analysis of these diseases, among them, oral and pharyngeal cancer.
he objective of this study was to analyze the trends of oral and pharyngeal cancer mortality
in Brazil according to anatomical site, sex, and macroregion of the country during the period of 2002 to 2013.
METHODS
In order to analyze the temporal trend of oral and pharyngeal cancer mortality in Brazil, we carried out an ecological study using data from the deaths in the country during the period of 2002 to 2013. he annual mortality data were obtained from the Mortality
Information System (SIM)c, available in the website of the Information System of the Brazilian
Uniied Health System (DATASUS). he number of inhabitants is provided by the Brazilian
Institute of Geography and Statistics (IBGE)d and originated from the 2010 Census and from
a International Agency for Research on Cancer. Globocan 2012: estimated cancer incidence, mortality and pevalence worlwide. Lyon: IARC; 2012 [cited 2017 Oct 29]. Available from: http:// globocan.iarc.fr
intercensorial estimates for the remaining years. he deaths with ignored sex and age were excluded from this analysis and amounted to 0.05% of the cases.
We analyzed the deaths from oral cancer (C00.0–C08.9) and pharyngeal cancer (C09–C14.8) according to the International Classiication of Diseases, Tenth Revision (ICD-10), and according to macroregion of residence (North, Northeast, Southeast, South, and Midwest), sex, and anatomical site. We also analyzed the temporal trend of mortality rates for each anatomical site, which were grouped according to common characteristics related to tissue location and histology. his procedure ensured a suicient number of cases and provided greater stability for the analyses.
We calculated the oral and pharyngeal cancer mortality rates per 100,000 inhabitants and adjusted them using the direct method by sex and age groups (with intervals of ive years). We considered as the standard the percentage distribution of the world population provided
by the World Health Organization13 (2001), applied to the total world population of 2015.
We carried out this procedure to guarantee the comparison of the results with previous
studies that use other populations for standardization.
To calculate the annual percentage variation (APC) of the rates, we used the Prais-Winsten regression, which predicts irst-order autocorrelation correction. he dependent variable was the logarithm of the rates, and the independent variable was the years of the historical series. he calculation of the annual percentage change of the rates was performed with the
following formulas, as suggested by Antunes and Waldman14.
–1+10b
= ∆ (1)
For the calculation of the conidence intervals:
∆95 Cl = –1+10(b±t*se)
(2)
Where “b” corresponds to the annual growth rate. he values of “b” and standard deviation (se)
were extracted from the regression analysis, and the value of “t” is supplied by the Student’s
distribution table t. he trend of increase, decrease, or stagnation was expressed as APC,
with the respective conidence intervals (95%), and we considered as stationary the trend whose regression coeicient was not diferent from zero (p > 0.05).
In order to facilitate the visualization of the trends, we reduced the white noise in the graphs of the historical series, using the technique of 3rd order centered moving averages. he trend analysis was performed in the Stata program, version 13.
RESULTS
Between 2002 and 2013, there were 74,342 deaths from oral cancer (n = 35,534) and pharyngeal cancer (n = 38,808) in Brazil, corresponding to 3.9% of the deaths from all neoplasms in the period studied. Approximately eight in every 10 deaths occurred among men.
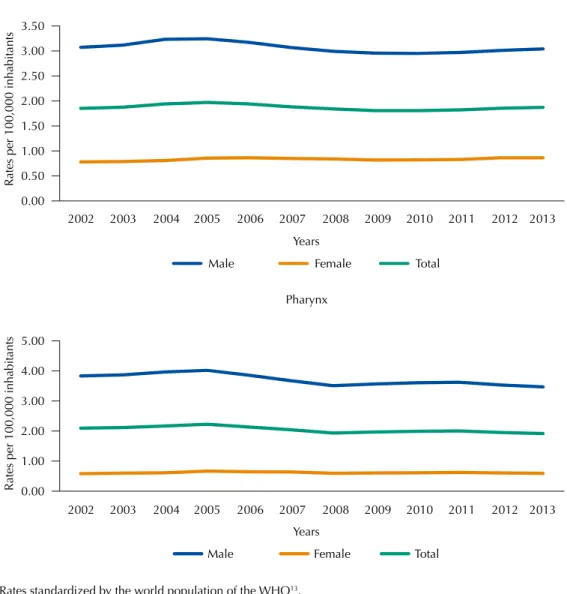
When analyzed together, the oral and pharyngeal cancer mortality rates presented stability in both men, with average coeicient of 6.74 per 100,000 inhabitants, and women, with average coeicient of 1.45 per 100,000 inhabitants. Although with a stable trend, men had an average coeicient that was 4.6 times higher than women. he ratio between the average male and female coeicient was 3.7:1 for oral cancer and 6:1 for pharyngeal cancer. his ratio decreased in 1.5% and 1.6% for oral and pharyngeal cancer mortality, respectively, when we compared the ratio of male and female coeicient of 2002 to that of 2013 (data not shown).
especially among men (APC of -2.7%). Figure 1 shows the behavior of the oral cancer and
pharyngeal cancer mortality rates according to sex.
Oral cancer and pharyngeal cancer presented marked diferences according to regions (Table 1). For oral cancer, the Northeast region presented one of the lowest average coeicients for the period (1.60 per 100,000 inhabitants), but it had an annual average increase in mortality of 6.9%. On the other hand the Southeast region presented the second highest average coeicient (2.04 per 100,000 inhabitants); however, it was the only region with a reduction in mortality rates (APC of -2.9%).
As for pharyngeal cancer, both the Southeast region and the South region presented a decrease in mortality rates, with APC of -4.8% and -5.1%, respectively (Table 1). he values were stable in the other regions. Figure 2 presents the historical series of oral and pharyngeal
cancer mortality rates according to regions.
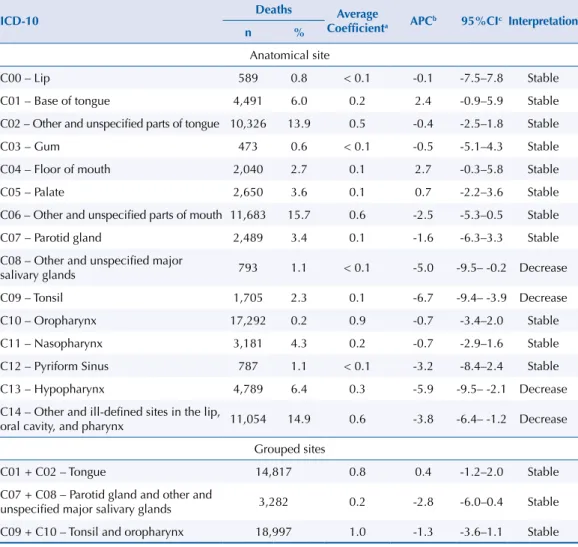
he anatomical site with the highest average coeicient in the period studied was the oropharynx (0.91 per 100,000 inhabitants), followed by other and unspeciied parts of mouth (0.62 per 100,000 inhabitants). We observed decreasing trends for cancer of tonsil (-6.6%), other major salivary glands (-4.9%), hypopharynx (-5.8%), and other and unspeciied sites of mouth and pharynx (-3.8%). he trends of mortality rates in the other sites were stable during the study period. Table 2 describes the number of deaths, the average coeicient, and the APC of the oral and pharyngeal cancer mortality rates according to anatomical site.
* Rates standardized by the world population of the WHO13.
Figure 1. Historical series of oral and pharyngeal cancer mortality rates* according to sex. Brazil, 2002–2013.
Pharynx 0.00
0.50 1.00 1.50 2.00 2.50 3.00 3.50
Rates per 100,000 inhabitants
Years
Male Female Total
0.00 1.00 2.00 3.00 4.00 5.00
Rates per 100,000 inhabitants
Years
Male Female Total
Mouth
2013 2012 2011 2010 2009 2008 2007 2006 2005 2004 2003 2002
Table 1. Number and percentage of deaths, mean coefficient per 100,000 inhabitants, and trend of oral and pharyngeal cancer mortality rates according to regions. Brazil, 2002–2013.
Region Deaths Average
Coefficienta APC
b 95%CIc Interpretation
n %
Mouth
North 1,170 3.3 1.2 5.0 -0.9–11.3 Stable
Northeast 8,012 22.5 1.6 6.9 1.5–12.6 Increase
Southeast 18,007 50.7 2.0 -3.0 -4.6– -1.4 Decrease
South 6,331 11.9 2.1 -2.8 -6.4–0.9 Stable
Midwest 2,014 5.7 1.8 -3.6 -8.7–1.8 Stable
Total 35,534 1.9 -0.6 -2.6–1.5 Stable
Pharynx
North 1,185 3.1 1.1 1.9 -1.8–5.8 Stable
Northeast 7,549 19.4 1.5 5.9 -0.4–12.5 Stable
Southeast 20,021 51.6 2.3 -4.9 -7.9– -1.8 Decrease
South 7,458 19.2 2.5 -5.1 -7.9– -2.3 Decrease
Midwest 2,595 6.7 2.2 -4.9 -9.7–0.3 Stable
Total 38,808 2.0 -2.7 -5.0– -0.3 Decrease
a Rates standardized by the world population, WHO13. b Annual percentage change.
c Confidence interval of the APC.
* Rates standardized by the world population of the WHO (2001)13.
Figure 2. Historical series of oral and pharyngeal cancer mortality rates* according to regions, Brazil, 2002–2013.
Mouth
Pharynx 0.5
1 1.5 2 2.5
Rates per 100,000 inhabitants
Years
North Northeast Southeast South Midwest
0.5 1 1.5 2 2.5 3
Rates per 100,000 inhabitants
Years
North Northeast Southeast South Midwest
2013 2012 2011 2010 2009 2008 2007 2006 2005 2004 2003 2002
DISCUSSION
he temporal trends of oral and pharyngeal cancer mortality rates in Brazil in the period of 2002 to 2013 showed diferent patterns according to sex, regions of the country, and anatomical sites of the disease. According to sex, although stable, the oral and pharyngeal cancer mortality rates were higher in males than in females throughout the study period. However, the ratio between the sexes presented a decrease throughout the historical series investigated, which may be related to the acquisition of habits associated to the masculine lifestyle by the women.
his discrepancy in the rates between sexes is observed both internationally14 and in
Brazil15 and it is possibly related to the exposure in the past to the main risk and protection factors, such as tobacco, whose prevalence of consumption in Brazil is higher in men than
in women16. Another possible explanation for this discrepancy between the sexes is the
frequency of regular dental appointment, which is usually higher in women than in men17,
and the socioeconomicdiferences between genders18.
In the analysis by anatomical site, we observed a decrease in cancer mortality for tonsil, other major salivary glands, hypopharynx, and unspeciied parts of mouth and pharynx in Brazil. We observed stability of the trends of the rates of the other anatomical sites, being some of them diicult to diagnose or of high incidence. Oropharynx, for example, previously
considered as an anatomical site with a growing trend19, presented stability in the period of
2002 to 2013. Nevertheless, it was the anatomical site with the highest average coeicient per 100,000 inhabitants in the studied period.
Table 2. Number and percentage of deaths, mean coefficient per 100,000 inhabitants, and trend of oral and pharyngeal cancer mortality rates according to anatomical site. Brazil, 2002–2013.
ICD-10 Deaths Average
Coefficienta APCb 95%CIc Interpretation
n %
Anatomical site
C00 – Lip 589 0.8 < 0.1 -0.1 -7.5–7.8 Stable
C01 – Base of tongue 4,491 6.0 0.2 2.4 -0.9–5.9 Stable
C02 – Other and unspecified parts of tongue 10,326 13.9 0.5 -0.4 -2.5–1.8 Stable
C03 – Gum 473 0.6 < 0.1 -0.5 -5.1–4.3 Stable
C04 – Floor of mouth 2,040 2.7 0.1 2.7 -0.3–5.8 Stable
C05 – Palate 2,650 3.6 0.1 0.7 -2.2–3.6 Stable
C06 – Other and unspecified parts of mouth 11,683 15.7 0.6 -2.5 -5.3–0.5 Stable
C07 – Parotid gland 2,489 3.4 0.1 -1.6 -6.3–3.3 Stable
C08 – Other and unspecified major
salivary glands 793 1.1 < 0.1 -5.0 -9.5– -0.2 Decrease
C09 – Tonsil 1,705 2.3 0.1 -6.7 -9.4– -3.9 Decrease
C10 – Oropharynx 17,292 0.2 0.9 -0.7 -3.4–2.0 Stable
C11 – Nasopharynx 3,181 4.3 0.2 -0.7 -2.9–1.6 Stable
C12 – Pyriform Sinus 787 1.1 < 0.1 -3.2 -8.4–2.4 Stable
C13 – Hypopharynx 4,789 6.4 0.3 -5.9 -9.5– -2.1 Decrease
C14 – Other and ill-defined sites in the lip,
oral cavity, and pharynx 11,054 14.9 0.6 -3.8 -6.4– -1.2 Decrease Grouped sites
C01 + C02 – Tongue 14,817 0.8 0.4 -1.2–2.0 Stable
C07 + C08 – Parotid gland and other and
unspecified major salivary glands 3,282 0.2 -2.8 -6.0–0.4 Stable C09 + C10 – Tonsil and oropharynx 18,997 1.0 -1.3 -3.6–1.1 Stable
a Rates standardized by the world population, WHO13. b Annual percentage change.
he stagnation or stability observed in these later parts, which are considered diicult to inspect on clinical examination, may be a consequence of improved access to health services
and more conservative and efective surgical techniques20.
In this study, we observed diferences between macroregions. he observed increase in the trend of oral cancer mortality in the Northeast region suggests that there was an improvement in the information systems in the study period, which could lead to a
higher number of death records for the calculation21. However, this increase may also be
related to changes in lifestyles, increasing exposure to risk factors. he improvement of the information system may have partially inluenced the observed increase in the rates; therefore, this result must be interpreted with caution. he other regions of the country presented stability in the rates investigated.
he diference in the trends of the rates between regions may also have been inluenced by access to health services, since the North and Northeast regions have the lowest rates of active health professionals and the highest percentage of persons who report having never
consulted a dentist22. Regular appointments with the health professional, which inluences the timely diagnosis of precancerous lesions, also presents great variations among regions, which may explain the diferent behavior of the oral and pharyngeal cancer mortality rates
in each one of them, as richer regions have a higher prevalence of dental appointments23.
As in the study on the trends of oral and pharyngeal cancer mortality in Brazil for the period of 1979 to 2002, the trend of oral cancer mortality in Brazil between 2002 and 2013 presented
stability for both sexes. However, Boing et al.6 have observed an increase in pharyngeal
cancer mortality, whereas this rate decreased in the period of 2002 to 2013. Similarly, cancer mortality for oropharynx, hypopharynx, and other undeined parts showed an increase in the period of 1979 to 2002, while we observed stability for these speciic anatomical sites in
the 12 years considered in our study.
he oral and pharyngeal cancer mortality rates were higher in the South and Southeast
regions of the country, both in the results observed by Boing et al.6 and in this study. We know
that tobacco is the main risk factor for oral and pharyngeal cancer. he South and Southeast
regions present a higher prevalence of tobacco consumption than the other regions24, which
may be afecting the mortality rates in these regions.
he study of trends in cancer mortality is complex and its analysis should consider that the potentially beneicial consequences of health interventions will only have an efect in the long term given the cumulative action of risk factors. Between 1989 and 2010, the drop in
the percentage of smokers in Brazil was 46%16. herefore, it is expected that its efects are
being relected in the reduction of mortality observed today, especially in the adult persons who, for years, have been afected by the efects of decreasing tobacco consumption.
As a possible consequence of public policies aimed at tobacco and alcohol control, the country has experienced changes in the consumption of these substances, which may relect in the diferent patterns of the trends of oral and pharyngeal cancer mortality. he decrease
observed in the country in smoking prevalence16 may inluence the long-term trend of oral
and pharyngeal cancer mortality rates in diferent anatomical sites.
It is important to note that, while the incidence of cancer can be controlled from primary prevention, mortality is susceptible to secondary prevention from timely diagnosis and tertiary prevention, which seeks to limit damage, control pain, prevent secondary
complications, and improve the quality of life during treatment25. As there is no scientiic
evidence that a visual examination as part of a population-based screening program reduces the oral and pharyngeal cancer mortality rate, authors have suggested that strategies focused on individuals exposed to major risk factors could result in a more
As any study with secondary information, the results shown here depend on the accuracy and completeness of information systems. he quality and coverage of the mortality data provided by the SIM have gradually increased since its decentralization in 1992, as well as the adequate
illing of the data, which is approximately 90%27. In Brazil, coverage has consistently increased
since 2000, reaching 96.1% in 2011. his coverage is close to 100% in the Southeast, South, and Midwest regions. In the North and Northeast regions, some federative units have coverage above 90% and others between 80% and 90%. he percentage of deaths with ill-deined basic causes has been declining over the years, and the South and Midwest regions have the lowest percentage of
deaths from ill-deined basic causes (4.5% and 4.4%, respectively)27. According to data from the
DATASUSe, in the period under study, there was a more than 80% decrease in the number of deaths
from ill-deined causes in the country, and this decrease was more visible in the Northeast region.
he trends regionally observed may be being inluenced by regional inequalities in the recording of mortality data and should be interpreted with caution, e.g. the reduced underreporting of records in regions characterized by poor quality of medical care may be inluencing the observed increase in trends. In this sense, the growth trend would rather relect an improvement in the quality of information than an increase in mortality.
An analogous efect can be observed in the decreasing trends in the rates of cancer of unspeciic parts of the mouth and pharynx. Cancer mortality for speciic sites that were not correctly diagnosed and recorded may actually be increasing the proportion of deaths from cancer of unspeciied sites in the death record set. In the period of 2002 to 2013, 30.6% of the cases of death were classiied as neoplasms of unspeciied sites of mouth and pharynx corresponding to codes C06 and C14 of the International Classiication of Diseases. he decreasing trend in this speciic group may also be inluenced by improvements in the deinition of the speciic site in the cause of death.
In addition to the quality of the data obtained in the information systems, the statistical results of a trend analysis are also inluenced by the number of years analyzed. In this study, we should proceed with caution in the interpretations of the trends given the relatively short
historical series.
An important aspect is the ability to compare the results of the rates obtained with previous studies that use other populations for standardization. However, the new standard used was adopted by the World Health Organization (WHO) to remove the efects of proportional distribution of diferent populations in the world, from historical events, wars, famine, etc. his translates this
new standard into a neutral population for international comparisons and analyses13.
Despite the limitations speciic to the study, our results show that the trends are either stable
or decreasing. Boing et al.6 have observed an increase in oropharyngeal and hypopharyngeal cancer mortality, which are anatomical sites that presented stability and decline in our study, respectively. In the aforementioned study, sites with a decreasing trend, such as lip, tongue, loor of mouth, and palate, began to show stability in the period of 2002 to 2013. he stabilization of the observed rate is the result of long-term changes and indicates improvements in the timely diagnosis of oral and pharyngeal cancer and less exposure to risk factors. he diferent behavior of the trends in each macroregion of the country relects socioeconomic diferences, access to health services, and improvement of information
systems that impact on the incidence, mortality, and lethality of this disease.
CONCLUSION
Pharyngeal cancer mortality presented a decrease, whereas oral cancer mortality presented stability in the period studied. Oral cancer presented an increasing trend in the Northeast region and a decreasing trend in the Southeast region, while pharyngeal cancer decreased in the Southeast, South, and Midwest regions. he cancer mortality rates for other and ill-deined sites in the lip, oral cavity, and pharynx showed a decline between 2002 and 2013. e Ministério da Saúde (BR),
Departamento de Informáica do
SUS - DATASUS. Informações de
Considering the observed increase in pharyngeal cancer mortality in Brazil, observed in the period of 1979 to 2002, we highlight the decrease observed in the period of 2002 to 2013 for cancer mortality in this anatomical site and the stability presented by the other sites.
REFERENCES
1. Schramm JMA, Oliveira AF, Leite ID, Valente JG, Gadelha AMJ, Portela MC, et al. Transição epidemiológica e o estudo de carga de doença no Brasil. Cienc Saude Coletiva.
2004;9(4):897-908. https://doi.org/10.1590/S1413-81232004000400011
2. Garavello W, Bertuccio P, Levi F, Lucchini F, Bosetti C, Malvezzi M, et al. The oral cancer epidemic in central and eastern Europe. Int J Cancer. 2010;127(1):160-71. https://doi.org/10.1002/ijc.25019
3. Ariyawardana A, Johnson NW. Trends of lip, oral cavity and oropharyngeal cancers in Australia 1982-2008: overall good news but with rising rates in the oropharynx. BMC Cancer. 2013;13:333. https://doi.org/10.1186/1471-2407-13-333
4. Riera-S P, Martínez-R B. Morbilidad y mortalidad por cáncer oral y faríngeo en Chile. Rev Med
Chile. 2005;133(5):555-63. https://doi.org/10.4067/S0034-98872005000500007
5. Wunsch Filho V. The epidemiology of oral and pharynx cancer in Brazil. Oral Oncol. 2002;38(8):737-46. https://doi.org/10.1016/S1368-8375(02)00066-0
6. Boing AF, Peres MA, Antunes JLF. Mortality from oral and pharyngeal cancer in Brazil: trends and regional patterns, 1979-2002. Rev Panam Salud Publica. 2006;20(1):1-8.
https://doi.org/10.1590/S1020-49892006000700001
7. Weitkunat R, Sanders E, Lee PN. Meta-analysis of the relation between European and American smokeless tobacco and oral cancer. BMC Public Health. 2007;7:334. https://doi.org/10.1186/1471-2458-7-334
8. Turati F, Garavello W, Tramacere I, Pelucchi C, Galeone C, Bagnardi V, et al. A meta-analysis of alcohol drinking and oral and pharyngeal cancers: results from subgroup analyses. Alcohol Alcohol. 2013;48(1):107-18. https://doi.org/10.1093/alcalc/ags100
9. World health Organization. Global status report on alcohol and health 2014. Geneva: WHO; 2014 [cited 2017 Sep 30]. Available from: http://apps.who.int/iris/ bitstream/10665/112736/1/9789240692763_eng.pdf
10. Herrero R, Castellsagué X, Pawlita M, Lissowska J, Kee F, Balaram P, et al. Human papillomavirus and oral cancer: the International Agency for Research on Cancer multicenter study. J Natl Cancer Inst. 2003;95(23):1772-83. https://doi.org/10.1093/jnci/djg107
11. Bonafante GMS, Machado CJ, Souza PEA, Andrade EIG, Acurcio FA, Cherchiglia ML. Sobrevida de cinco anos e fatores associados ao câncer de boca para pacientes em tratamento oncológico ambulatorial pelo Sistema Único de Saúde, Brasil. Cad Saude Publica. 2014;30(5):983-97. https://doi.org/10.1590/0102-311X00182712
12. Klug C, Neuburg J,Glaser C, Schwarz B, Kermer C, Millesi W. Quality of life 2-10 years after combined treatment for advanced oral and oropharyngeal cancer. Int J Oral Maxillofac.Surg.
2002;31(6):664-9. https://doi.org/10.1054/ijom.2002.0301
13. Ahmad OB, Boschi-Pinto C, Lopez AD, Murray CJL, Lozano R, Inoue M. Age standardization of rates: a new WHO Standard. Geneva: World Heahl Organization; 2001 [cited 2017 Sep 30]. (GPE Discussion Paper Series, 31). Available from: http://www.who.int/healthinfo/paper31.pdf 14. Antunes JLF, Waldman EA. Trends and spatial distribution of deaths of children aged 12-60
months in São Paulo. Bull World Health Organ. 2002 [cited 2017 Sep 30];80(5):391-8. Available from: https://www.ncbi.nlm.nih.gov/pmc/articles/PMC2567796/pdf/12077615.pdf
15. Yako-Suketomo H, Matsuda T. Comparison of time trends in lip, oral cavity and pharynx cancer mortality (1990-2006) between countries based on the WHO mortality database. Jpn J Clin Oncol. 2010;40(11):1118-9. https://doi.org/10.1093/jjco/hyq202
16. Biazevic MGH, Castellanos RA, Antunes JLF, Michel-Crosato E. Tendências de mortalidade por câncer de boca e orofaringe no Município de São Paulo, Brasil, 1980/2002. Cad Saude Publica. 2006;22(10):2105-14. https://doi.org/10.1590/S0102-311X2006001000016
18. Machado LP, Camargo MBJ, Jeronymo JCM, Bastos GAN. Uso regular de serviços odontológicos entre adultos e idosos em região vulnerável no sul do Brasil. Rev Saude Publica.
2012;46(3):526-33. https://doi.org/10.1590/S0034-89102012000300015
19. Antunes JLF, Toporcov TN, Biazevic MGH, Boing AF, Bastos JL. Gender and racial inequalities in trends of oral cancer mortality in Sao Paulo, Brazil. Rev Saude Publica. 2013;47(3):470-8.
https://doi.org/10.1590/S0034-8910.2013047003724
20. Oliveira JC, Curado MP, Martins E, Moreira MARM. Incidência , mortalidade e tendência do câncer de cavidade oral e orofaringe em Goiânia de 1988 a 2003. Rev Bras Cir Cabeça Pescoço.
2007 [cited 2017 Sep 30];36(2):70-4. Available from: http://www.sbccp.org.br/wp-content/ uploads/2014/11/2007_362-70-74. pdf
21. Secoli SR, Padilha KGP, Leite RCBO. Avanços tecnológicos em oncologia: reflexões para a prática de enfermagem. Rev Bras Cancerol. 2005 [cited 2017 Sep 30];51(4):331-7. Available from: http://www.inca.gov.br/rbc/n_51/v04/pdf/revisao4.pdf
22. Fajardo S, Aerts DRGC, Bassanesi SL. Acurácia da equipe do Sistema de Informações sobre Mortalidade na seleção da causa básica do óbito em capital no Sul do Brasil. Cad Saude
Publica. 2009;25(10):2218-28. https://doi.org/10.1590/S0102-311X2009001000012
23. Rede Interagencial de Informação para a Saúde. Indicadores básicos para a saúde no Brasil: conceitos e aplicações. 2. ed. Brasília (DF): Organização Pan-Americana da Saúde; 2008 [cited 2017 Sep 30]. Available from: http://tabnet.datasus.gov.br/tabdata/livroidb/2ed/indicadores.pdf 24. Miranda CDC, Peres MA. Determinantes da utilização de serviços odontológicos entre adultos:
um estudo de base populacional em Florianópolis, Santa Catarina. Cad Saude Publica. 2013;29(11):2319-32. https://doi.org/10.1590/0102-311X00139912
25. Instituto Brasileiro de Geografia e Estatística, Diretoria de Pesquisas, Coordenação de Trabalho e Rendimento. Pesquisa Nacional por Amostra de Domicílios: Tabagismo. Rio de Janeiro: IBGE; 2008 [cited 2017 Sep 30]. Available from: http://www1.inca.gov.br/inca/Arquivos/publicacoes/ tabagismo.pdf
26. Macpherson LMD, McCann MF, Gibson J, Binnie VI, Stephen KW. The role of primary healthcare professionals in oral cancer prevention and detection. Br Dent J. 2003;195(5):277-81.
https://doi.org/10.1038/sj.bdj.4810481
27. Antunes JLF, Toporcov TN, Wunsch-Filho V. Resolutividade da campanha de prevenção e diagnóstico precoce do câncer bucal em São Paulo, Brasil. Rev Panam Salud Publica.
2007;21(1):30-6. https://doi.org/10.1590/S1020-49892007000100004
28. Ministério da Saúde (BR), Secretaria de Vigilância em Saúde, Coordenação Geral de Informações e Análises Epidemiológicas. Sistema de Informações sobre Mortalidade – SIM: consolidação da base de dados de 2011. Brasília (DF); 2013 [cited 2017 Sep 30]. Available from: http://tabnet. datasus.gov.br/cgi/sim/Consolida_Sim_2011.pdf
Funding: Coordination for the Improvement of Higher Education Personnel (CAPES).
Authors’ Contribution: Design and planning of the study: LMEP, MAP, AFB, JLFA. Collection, analysis, and interpretation of the data: LMEP, MAP, AFB, JLFA. Preparation or review of the article: LMEP, MAP, AFB, JLFA. Approval of the inal version: LMEP, MAP, AFB, JLFA. Public responsibility for the content of the article: LMEP, MAP, AFB, JLFA.