Absenteeism of nursing staff: decisions
and actions of nurse managers*
Paulina Kurcgant1, Andrea Rodrigues Passos2, Juliana Macedo Lima de Oliveira3, Irene Mari Pereira4, Taiza Florêncio Costa5 Absenteísmo do pessoal de enfermagem: decisões e ações de enfermeiros gerentes
Absentismo del personal de enfermeira: decisiones y acciones de las enfermeiras gestoras
* Extracted from partial data of the project “Gerenciamento de recursos humanos em enfermagem no contexto assistencial, ético, político e inanceiro de hospitais gerais, públicos, de ensino do Município de São Paulo”, National Postdoctoral Program PNPD/CAPES/Graduate Program in Nursing Management, School of Nursing, University of São Paulo, 2014 1 Senior Professor, University of São Paulo, School of Nursing, Department of Professional Guidance, São Paulo, São Paulo, Brazil.
2 PhD in Sciences, University of São Paulo, School of Nursing, São Paulo, São Paulo, Brazil. 3 Degree in Nursing, University of São Paulo, School of Nursing, São Paulo, São Paulo, Brazil. 4 PhD student, University of São Paulo, School of Nursing, Nursing Management Graduate Studies Program, São Paulo, São Paulo, Brazil.
5 PhD in Sciences, University of São Paulo, School of Nursing, São Paulo, São Paulo, Brazil.
Received: 11/30/2014 Approved: 02/24/2015
ORIGINAL ARTICLE DOI: 10.1590/S0080-623420150000800005
ABSTRACT
Objective: Measure absenteeism among nurses and nursing technicians/aides in three hospitals and explore possible management decisions by nursing managers to deal with it. Method:Quantitative, qualitative study. In the qualitative stage, monthly rates, annual average and overall rates of absenteeism were measured among nurses and nursing technicians/aides from 12 service units in the hospitals, over 12 months, according to the equation proposed by the Support Center for Hospital Management (NAGEH – Núcleo de Apoio à Gestão Hospitalar). In the qualitative stage, 12 nursing managers from 12 units were interviewed. Results: he quantitative stage revealed important diferences in each institution and between institutions, with various monthly rates exceeding the monthly rate of 6.7% recommended by the Federal Council of Nursing (COFEN – Conselho Federal de Enfermagem). he qualitative stage examined positive impact decisions taken by these institutions, where relationships with managers, dialogue, and meeting the physical and emotional demands of professionals were considered important factors. Conclusion:Absenteeism was a reality in day-to-day nursing staf management. It varied according to the month of the year and in diferent service units, and it was possible to classify these units according to the degree of the problem. In addition, the results showed that employee illness, dissatisfaction with institutional conditions, and inadequate interpersonal relationships were key factors, enabling management decisions based on each hospital’s particular reality.
DESCRIPTORS
Absenteeism; Nursing Human Resources in Hospitals; Human Resource Management in Hospitals; Nursing Supervision; Management Indicators.
Correspondence Addressed to:
Paulina Kurcgant
Av. Dr. Enéas de Carvalho Aguiar, 419 - Cerqueira Cesar
CEP 05403-000 - São Paulo, SP, Brazil [email protected]
INTRODUCTION
Institutional assessment of performance in the pro-duction and service sectors uses indicators as a mea-suring tool. However, since health care is a sector that provides services, the essential elements required for the use of indicators to assess health care quality are conceptual consensus and covenantal understanding in the decision-making, strategic and operating realms of health institutions.
Indicators are generally represented by numeric vari-ables, and may be absolute numbers or ratios between two events, establishing a numerator and denominator. he nu-merator refers to the event to be measured. It must have a clear, objective and scientiically-based deinition and be easily applicable and relevant to the phenomenon that will be evaluated. he denominator is the population at risk, or being assessed for risk, for the same phenomenon consid-ered in the numerator(1-2).
Reliable information needs to be obtained; since these are quantitative data indicators, there is a risk of employ-ing reason to assess institutional performance, by prefer-ring some indicators that are more measurable than oth-ers. hus, indicators should be chosen that focus on the work processes being evaluated and, also, according to the perceptions of the actors engaged in the work process(3).
In the care context and with a focus on health human resources management, it is important to select indicators that can be analyzed and compared with standards from within and outside the institution(4).
he Support Center for Hospital Management (NAGEH), as a subgroup of the Commitment to Hospital Quality Program, develops activities aimed at improving hospital management as well as indicators applicable to nursing services(5).
In this regard, the nursing staf absenteeism indicator, which is included in the NAGEH proposal as a quality indicator of the nursing staf management process, assesses the quality of human resources management.
To provide input that would support the assertion that absenteeism is an indicator of the quality of human resources management, the objective of this study was to measure absenteeism among nursing professionals in three hospitals and explore possible decisions with a positive im-pact for dealing with it.
METHOD
his is a descriptive exploratory study, quantitative and qualitative in nature, which was conducted from August 2013 to July 2014 in two general public teaching hospitals and a university hospital, located in the city of São Paulo, referred to in this study as hospitals H1, H2 and H3.
he data was collected in 12 medical-surgical inpatient units (IU) recommended by the nursing directors of the three hospitals: 4 in Hospital H1, 2 in Hospital H2 and 6 in Hospital H3. In quantitative terms, the variable analyzed was the nursing staf absenteeism rates (nurses and nursing technicians/aides) calculated in these units during the
peri-od studied; the units are designated U1 to U12. In qualita-tive terms, the population consisted of the 12 nursing man-agers of these units, referred to in this study as E1 to E12.
Data on absenteeism rates was collected by consulting institution documents and the results were recorded on spreadsheets. he qualitative data was obtained from the nursing managers in individual semi-structured interviews, based on the following questions: “How do you view ab-senteeism among the nursing staf ?” and “What decisions or actions have you taken in this regard?”
To analyze the quantitative data, the equation pro-posed by NAGEH and the absenteeism monthly average rate of 6.7% recommended by Federal Council of Nursing (COFEN) Resolution No. 293/04, were adopted(6).
Calculating the absenteeism rates of nursing professionals
absenteeism rate = No. man - hours missed No. of man - hours worked ×100
he number of man-hours worked is the total number of hours worked by nursing professionals during the period under consideration.
he number of man-hours missed is the monthly num-ber of working hours missed by nursing professionals, re-gardless of the work regime adopted in the health institu-tion, divided by the number of hours worked.
he number of man-hours missed includes all absences, including justiied, all sick leaves, blood donations, voter and military enrollment, judicial summons and suspen-sions arising from the application of disciplinary measures. It does not include vacation and legal leaves of over 15 consecutive days.
To analyze the qualitative data collected in the inter-views, the meaning units contained in the dialogues of the nursing managers were obtained, which when grouped by similarity of meaning, constituting the empirical categories of the study(7).
As far as ethical and legal aspects, the project to which this study belongs was approved by the Research Eth-ics Committee of the School of Nursing of USP, Pro-cess Reference No. 1110/2011/CEP-EEUSP-SISNEP-CAAE:0132,0,196.198-11.
RESULTS
MEASUREMENTOFABSENTEEISMAMONGNURSING PROFESSIONALS
Table 1 and Figure 1 present nursing staf absenteeism rates, month-to-month and total for the year studied and in the diferent service units of each hospital.
In the two units from Hospital H2, the maximum monthly rates in the nurse category, in Internal Medicine U5 (8.2%) and Surgical U6 (12.2%), were considerably higher than the suggested average. he results for nursing technicians/aides in U5 (6.8%) are only slighter higher than the recommended rate, but in U6 the rate (8.8%) ex-ceeds the appropriate level.
In Hospital H3, for the nurse category, in the In-ternal Medicine units, the maximum monthly rate of U7 is 12.2%, U8 is 8% and U9 is 8.5%, all above the recommended limit. he Internal Medicine units had high maximum rates, varying from 19% in U10, 15.8%
Table 1 - Absenteeism rates of hospitals H1, H2 and H3 – São Paulo, August 2012 to July 2013.
Professional category H U 8/12 12/9 10/12 11/12 12/12 1/13 2/13 3/13 4/13 5/13 6/13 7/13 Year
Nurses
H1
U1/5DN 0.0 3.7 3.4 1.6 0.0 8.2 3.4 0.8 3.3 0.0 0.0 0.0 1.7
U2/5 DS 0.0 0.0 0.0 1.6 0.0 8.2 3.4 0.8 3.3 0.0 0.0 0.0 1.5
U3/6CM 2.6 7.5 3.5 6.4 4.0 0.4 1.9 6.2 1.1 5.6 3.3 0.4 3.6
U4/8 CP 2.0 0.0 0.0 13.8 0.0 3.2 1.4 12.8 2.2 3.3 1.2 1.1 3.5
H2 U5/5CM 5.3 3.9 0.8 0.7 1.0 1.5 0.0 0.0 3.1 0.8 0.0 5.6 2.0 U6/6CLC 8.7 12.2 3.9 2.0 7.8 5.2 0.4 2.4 0.8 0.4 6.7 0.4 4.4
H3
U7/17 N 7.1 0.4 6.2 10.4 12.2 2.6 9.0 2.6 0.5 1.4 0.0 1.1 4.5
U8/18S 0.6 0.5 0.9 2.5 3.0 1.8 0.8 2.5 8.0 4.8 1.9 2.9 2.4
U9/19S 2.6 2.2 8.3 8.5 1.3 1.4 4.5 1.1 2.0 2.9 3.8 2.2 3.3
U10/20S 8.9 6.3 13.8 19.0 13.5 7.6 5.0 3.3 2.8 1.5 0.5 3.1 7.4
U11/22N 9.5 10.1 0.0 0.7 3.3 15.8 15.1 3.5 8.6 7.3 6.3 3.9 6.8
U12/22S 2.0 1.3 8.5 7.1 3.2 2.0 2.8 6.6 0.2 1.3 1.7 4.7 3.3
Technicians and aides H1
U1/5DN 2.4 4.4 1.8 2.4 2.4 1.6 1.8 6.5 3.9 0.9 2.8 3.2 2.8
U2/5Ds 0.3 5.4 3.2 2.4 2.4 1.6 1.8 6.5 3.9 0.9 2.8 3.2 2.8
U3/6CLM 7.5 3.4 3.7 2.9 5.2 8.8 6.2 6.2 7.9 8.9 9.7 6.9 6.5
U4/8CP 0.9 3.5 2.5 7.4 3.4 3.9 4.5 2.4 4.7 5.4 1.9 2.5 3.5
H2 U5/5CM 3.1 4.1 5.0 6.7 6.8 2.6 3.1 2.5 1.4 4.8 1.3 1.5 3.6 U6/6CLC 5.8 7.0 2.3 6.2 8.8 1.1 2.5 2.6 3.5 1.0 3.1 4.3 3.9
H3
U7/17N 11.3 12.1 12.5 10.8 8.8 2.3 3.9 0.8 4.4 7.6 3.3 3.4 7.6
U8/18S 8.0 4.9 9.9 8.9 8.5 3.0 3.9 4.3 4.9 3.0 2.1 1.1 5.4
U9/19S 4.4 4.3 1.9 9.5 16.9 2.4 1.9 2.7 3.5 2.3 2.3 4.7 4.6
U10/20S 15.6 14.2 17.3 22.8 18.3 6.9 6.7 10.0 12.6 4.1 4.3 7.1 12.2
U11/22N 26.4 22.9 26.1 32.3 36.9 15.0 2.0 5.4 13.8 11.5 7.2 0.7 16.3
U12/22S 3.6 7.3 4.5 8.6 8.5 3.8 5.4 3.3 12.0 5.9 7.5 4.1 6.1 H: hospitals; U: units.
Source: records of printed shifts and/or electronic system of each unit of the hospitals.
in U11 and 8.5% in U12. With respect to nursing tech-nicians/aides, the highest monthly rates were as follows: U7 (12.5%), U8 (9.9%), U2 (16.9%), U10 (22.8%), U11 (36.9%) and U12 (12%). he high absenteeism rates in Hospital H3 are striking, especially the 36.9% absentee-ism rate of nursing technicians/aides which is 551% of the rate recommended by COFEN.
It can also be noted in Table 1 and Figure 1 that the lowest annual nurse absenteeism rate, in Hospital H1, was 1.5% in U2 and the highest was in U3 (3.6%); for nursing technicians/aides, the lowest annual rate was 2.8% in U1 and U2, and the highest was in U3 (6.5%). In Hospital H2, the lowest annual rate for nurses was 2% in U5 and the highest was 4.4% in U6; for nurs-ing technicians/aides, the annual rate was 3.6% in U5 and 3.9% in U6. In Hospital H3, for the nurse category, the lowest annual absenteeism rate was 2.4% in U8, and the highest was in U10 (7.4%); for nursing technicians/ aides, the annual rate ranged from 4.6% in U9 to 16.3% in U11. herefore, the highest annual rates of nursing staf absenteeism (4.5% and 8.1%) occurred in Hospital H3. Table 2 presents the overall absenteeism rates for nurses and nursing technicians/aides, by units (Internal Medicine and Surgical) and hospitals.
he nurses in Hospital H1 had a minimum overall absen-teeism rate of 0.3% and a maximum of 5.9%; in Hospital H2 the lowest overall absenteeism rate was 0.2% and the high-est was 8%; and in Hospital H3 the lowhigh-est overall rate was 2.2% and the highest was 9.4%. Nursing technicians/aides in Hospital H1 had a minimum overall absenteeism rate of 2.9%
Source: printed records of shifts and/or electronic system for each unit of the hospitals.
Figure 1 - Absenteeism rates of Hospitals H1, H2 and H3 – São Pau-lo, August 2012 to July 2013.
1.7 1.5
3.6 3.5
2.0
4.4 4.5
2.4 3.3
7.4 6.8
2.8 2.8
6.5
3.5 3.6 3.9
7.6
5.4 4.6
12.2 16.3
0 2 4 6 8 10 12 14 16 18
U1/5D
N
U2/5 DS U3/6CM U4/8 CP U5/5CM U6/6CL
C
U7/17 N U8/18S U9/19S U10/20
S
U11/22N
A B C
and a maximum of 5.6%; in Hospital H2 the lowest rate was 1.9% and the highest was 7.7% and in Hospital H3 the lowest overall rate was 3.7% and the highest was 14.4%. Hospital H3 had the highest overall nursing staf absenteeism rates com-pared to the rates from Hospital A and B.
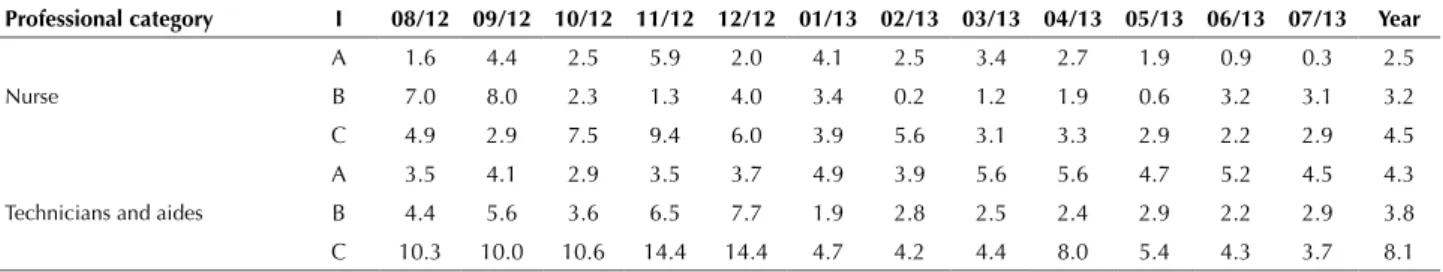
As far as the annual average of overall absenteeism rates, nurses from Hospital H1 had the lowest absenteeism rate (2.5%) when compared to the rates of Hospitals H2 (3.2%) and H3, which had the highest rate (4.5%).
In terms of nursing technicians/aides, the lowest rate was 3.8% in Hospital H2 and the highest was 8.1% in Hospital H3. Hospital H3 had the highest annual average rates of nursing technician/aides staf absenteeism, when compared to the annual rates in Hospital H1 and H2.
PERCEPTIONS, DECISIONSANDMANAGERIALACTIONSON THEPARTOFNURSES
In the qualitative aspect, the content analysis of the nursing managers’ responses in relation to absenteeism enabled formulation of empirical categories: “institutional factors,” “professional factors,” and “decisions/actions in re-lation to absenteeism.” he “institutional factors” category consisted of the meaning units: “perception of absenteeism” and “consequences of absenteeism.”
In terms of the meaning unit “perception of absentee-ism,” the nursing managers noted:
“What I see is that the person wants to change sectors ... wants the manager to notice they aren’t happy ... wants to change schedules (E3).” “Absenteeism may relect lack of motivation in relation to the work they perform (E7).”
he meaning unit “consequences of absenteeism” is il-lustrated in the following excerpts:
“Absences ultimately take a toll on care and the whole team (E5). “Absenteeism demonstrates quality of work and mainly how the staf member is perceived (E4).” “Absenteeism has an impact on nursing activities (E12).” “Absenteeism is negative for nursing (E9).”
he “professional factors” category includes the mining units: “causes of absenteeism” and “interpersonal relation-ships.” With regard to the meaning unit “causes of absen-teeism,” interviewees explain:
“Absenteeism is related to the employee’s health...it is unex-pected (E6).” “Medical leaves indicate health problems as the cause (of absenteeism) (E8).” “It is often noted that ab-senteeism is not due to a health problem, but it is a factor that predisposes you to a health problem (E2).”
In relation to the meaning unit “interpersonal relation-ships,” the interviewees revealed as causes of absenteeism:
“he staf member is not valued as a person and professional (E1).” “lack of communication between leaders and employees (E6).” “multi-professional re-lationship diiculties (E10).
With respect to the category “decisions/actions in rela-tion to absenteeism,” it is composed of the meaning units “decisions of nursing managers” and “actions with a posi-tive impact.”
In the meaning unit “decisions of nursing managers,” the interviewees commented:
“I look at the number of patients and the number of staf members (E7).” “I reorganize the team to cover the needs of the shift (E10).”I ask another coordinator for help to cover the shift (E6).” “I reassess the staf ’s activities on that day (when someone is absent) (E4).”
In terms of the meaning unit “actions with a positive impact,” the nursing managers shared the following:
“I examine the medical certiicates of the employees from my unit (E5).” “I switch people’s free days when they ask in advance, to switch a free day (E1).” “here is an internal system for redistribution to other units (E11).”
Also in terms of actions with a positive impact, the nursing managers noted:
“I talk, hold meetings, explain; people feel important and this improves absenteeism considerably (E2).” “identify the employee’s problem and monitor the si-tuation individually (E5).” “Valuing each employee as a person and professional and praising perfor-mance helps lower absenteeism (E9).” “One positive action is facilitating communication with managers (E4).” “It really works when you take care of em-ployees’ personal needs or requests, by switching their day of or listening to their personal problems (E12).”
DISCUSSION
In U1, U2 and U4 of Hospital H1, the lowest nurse ab-senteeism rate was in December, at 0%; for nursing techni-cians/aides, it was in August, with rates of 0.3% and 0.9% in U2 and U4, respectively. he highest nurse absenteeism rates in this institution occurred from September to November in U3 and U4, with 7.5% and 12.8%, respectively; and for nurs-ing technicians/aides, the highest rates occurred in March in U1 and U2, with a rate of 6.5% in both units. In this in-Table 2 - Overall absenteeism rates of Hospitals H1, H2 and H3 – São Paulo, August 2012 to July 2013.
Professional category I 08/12 09/12 10/12 11/12 12/12 01/13 02/13 03/13 04/13 05/13 06/13 07/13 Year
Nurse
A 1.6 4.4 2.5 5.9 2.0 4.1 2.5 3.4 2.7 1.9 0.9 0.3 2.5 B 7.0 8.0 2.3 1.3 4.0 3.4 0.2 1.2 1.9 0.6 3.2 3.1 3.2 C 4.9 2.9 7.5 9.4 6.0 3.9 5.6 3.1 3.3 2.9 2.2 2.9 4.5
Technicians and aides
A 3.5 4.1 2.9 3.5 3.7 4.9 3.9 5.6 5.6 4.7 5.2 4.5 4.3 B 4.4 5.6 3.6 6.5 7.7 1.9 2.8 2.5 2.4 2.9 2.2 2.9 3.8 C 10.3 10.0 10.6 14.4 14.4 4.7 4.2 4.4 8.0 5.4 4.3 3.7 8.1
I: Institutions.
stitution, in Internal Medicine U3 with 7.5% and Surgical U4 with 12.8%, the absenteeism rates exceeded the 6/7% monthly level recommended by CONEF.
In Hospital H2, the lowest nurse absenteeism rates were in February, at 0% and 0.4%, and for nursing tech-nicians/aides it was in May and June with rates of 1% and 1.3% in U5 and U6 respectively. he highest nurse absen-teeism rates in this institution occurred in the months of January and September (8.5% and 12.2%) and for nurs-ing technicians and aides it was in December, with rates of 6.5% in U5 and 8.8% in U6. herefore, the rates of Internal Medicine U5 and Surgical U6 exceeded the maximum lev-el recommended by Resolution 293/2004.
In Hospital H3, the lowest nurse absenteeism rates were in June, in U7 and U10, with rates of 0% and 0.5% respectively; and for nursing technicians/or aides it was in March, in U7, U10 and U12, with rates of 0.8%, 4.1% and 3.3% respectively. he highest nurse absenteeism rates in this institution occurred in November in U9 and U10, with rates of 8.5% and 19% respectively. For nursing tech-nicians/aides, it was in the month of December in U9 and U11, with rates of 16.9% and 36.9% respectively. In this institution, the rates in three Internal Medicine units were above the level set by Resolution 293/2004.
A study conducted in inpatient units of a public health institution mentioned that out of 414 nursing employees, 310 (74.9%) had some kind of unforeseen absence(8). An-other study found that Surgical Units registered the high-est rates of absenteeism, followed by Internal Medicine Units (14.7%), among others. his same study also showed that the highest absenteeism rates occurred among nursing technicians/aides in Internal Medicine units(9).
In another study conducted in a teaching hospital for education and research purposes, absenteeism rates in the nursing category ranged from 0% to 46.3%. For nursing technicians/aides, they varied from 0.5% to 11.6%(10). It should be noted that maternity leaves, occupational ac-cidents and sick leaves provided by the National Social Security Institute were considered as absences. In ad-dition, the study was performed using a diferent meth-odology from this study, for calculating nursing staf absenteeism percentages.
In terms of average annual rates of absenteeism among nurses, in Hospital H1, the lowest was 1.5% in U2 and the highest was 3.6% in U3; and for nursing technicians/aides, the lowest was 2.8% in U1 and U2, and the highest was 6.5% in U3. In Hospital H2, the lowest annual rate for nurses was 2% in U5 and the highest was 4.4% in U6; for nursing technicians/aides, the annual rate was 3.6% in U5 and 3.9% in U6. In Hospital H3, for the nurse category, the lowest annual absenteeism rate was 2.4% in U8, and the highest was 7.4% in U10; for nursing technicians/aides, the annual rate ranged from a low of 4.6% in U9 to 16.3% in U11.
In the distribution of absenteeism rates according to the care units where the nursing professionals worked, nine units had rates that met the COFEN standard. In three units, all belonging to the hospital, the absenteeism rate
exceeded the desired standard for nurses (two units), as well as for nursing technicians/aides (three units). Two of these were Internal Medicine units (U10 and U11) and one was a Surgical Unit (U7). Supporting this inding, another study found an absenteeism rate that exceeded the stan-dard among nursing technicians/aides in a Surgical Unit(9). In the qualitative aspect, the responses of the nursing managers took into account institutional factors, profes-sional factors and managerial decisions/actions as essential elements in relation to absenteeism. hese three categories revealed a not-always-harmonious relationship of the in-terests and intentions of the operative group in their formal and informal relationships with the health organizations.
he nursing managers identiied as predisposing condi-tions for absenteeism those related to the institution, in terms of physical environment, human resources and material re-sources. In this regard, the institutional factors that caused staf members to miss work were perceived by the nursing managers as factors that generated job dissatisfaction.
Work-related problems, combined with personal ones, produced a feeling of impotence and dissatisfaction(4).
Other studies have shown that the conditions provided for carrying out work, such as the physical and social en-vironment, are elements that cause dissatisfaction and are predictors of absenteeism(9,11).
On the other hand, the consequences of absenteeism are lower institutional performance and loss of quality and i-nancial resources, which also undermines the care provided. As far as the causes of absenteeism, the nursing man-agers considered employee illness, as well as predisposing factors for illness, as essential causes.
he literature regarding occupational health has shown that medical leaves were the cause of unforeseen absentee-ism(12). Of these, musculoskeletal system diseases were the most common among nursing professionals(8,13).
Also, with respect to predisposing factors for health problems, one study asserted that employees came to work mentally and physically willing, but left mentally and physically unwell(14).
Another factor deemed by nursing managers as con-tributing to absenteeism involved personal relationships.
According to a study on the theme, two important ele-ments are communication between managers and employees to clarify the reasons for absences and informal conversations that result in better personal and professional relationships(15).
As for decisions/actions in relation to absenteeism, nursing managers considered that quantitatively and qual-itatively adjusting human resources to meet the needs of patients was an action with a positive impact.
Other such positive actions used by nursing manag-ers involved pmanag-ersonal and professional relationships, with meetings focusing on professional appreciation; listening and helping to solve personal problems; and open channels of communication.
CONCLUSION
he quantitative and qualitative results of this study attest to the fact that absenteeism is a reality in day-to-day nursing staf management and requires, in addition to constant internal and external quantitative monitoring, the adoption of immediate and mediate managerial actions.
Although the quantitative results difered in the three institutions, they were manifested speciically and regularly in all of them. hus, the internal monitoring of absentee-ism in each institution during the study period revealed variations by month and in diferent service units, resulting in an average annual rate that made each situation distinct and provided input for management decisions tailored to each institution’s reality.
In turn, external monitoring, when the absenteeism rates in the three institutions were compared, yielded diferent percentages, which enabled the institutions to be ranked and classiied according to the degree of problems faced in this
regard and involved speciic managerial decisions for dealing with absenteeism in the diferent institutional contexts.
he qualitative results in the three institutions studied showed that the main causes of absenteeism were employee illness, dissatisfaction with institutional conditions and inad-equate interpersonal relationships. As for the actions and de-cisions taken by nursing managers in relation to absenteeism, these could be considered immediate, when they occurred when nursing managers discovered the employee was absent, and mediate, when they happened in the midst of work.
Mediate decisions, in this study, were found to be sim-ilar among the nursing managers from the three institu-tions, and focused on better institutional conditions and enhanced personal and professional relationships, as being more assertive decisions to reduce absenteeism.
A limitation of this study is that it was only carried out in three institutions, indicating the need for further studies to provide greater consistency in relation to management decisions involving health professionals and organizations and quality of care.
RESUMO
Objetivo: Mensurar o absenteísmo dos enfermeiros técnicos/auxiliares de enfermagem em três instituições hospitalares e conhecer possíveis decisões gerenciais de enfermeiros gerentes frente a este evento. Método:Quantiqualitativo, sendo que, na etapa quantitativa mediu as taxas mensais, média anual e taxa geral de absenteísmo dos enfermeiros e técnicos/auxiliares de enfermagem de 12 unidades de serviço dos hospitais, durante 12 meses, segundo a equação proposta pelo NAGEH. Na etapa qualitativa foram realizadas entrevistas com as 12 enfermeiras gerentes das 12 unidades. Resultados: A etapa quantitativa mostra diferenças importantes em cada instituição e entre instituições com diversas taxas mensais acima da taxa mensal máxima preconizada pelo COFEN de 6,7%. Na etapa qualitativa foram resgatadas as decisões de impacto positivo, por elas tomadas, considerando o relacionamento com cheia, o diálogo, e o atendimento das demandas de ordem física e emocional dos proissionais como fatores importantes. Conclusão:O absenteísmo mostrou-se como um evento presente no cotidiano do gerenciamento do pessoal de enfermagem, pois apresentou variações nos diferentes meses do ano e nas diferentes unidades de serviço sendo possível classiicá-las frente à maior ou menor problemática, além disso, mostrou o adoecimento do trabalhador, insatisfação com as condições institucionais e o relacionamento interpessoal inadequado, o que orienta para decisões gerenciais próprias a realidade.
DESCRITORES
Absenteísmo;Recursos Humanos de Enfermagem no Hospital;Administração de Recursos Humanos em Hospitais; Supervisão de Enfermagem; Indicadores de Gestão.
RESUMEN
Objetivo: Mensurar el absentismo de los enfermeros técnicos/asistentes de enfermería en tres instituciones hospitalarias y conocer las posibles decisiones de gestión de los enfermeros gestores frente a este evento. Método: Estudios cuantitativos y cualitativos, siendo que, en la fase cuantitativa mide las tasas mensuales, y promedio anual tasa general de absentismo del personal de enfermería y técnicos/asistentes de enfermería de 12 unidades de servicio de los hospitales durante 12 meses, de acuerdo con la ecuación propuesta por NAGEH. En la etapa cualitativa fueron realizadas entrevistas con as 12 enfermeras gestoras de las 12 unidades. Resultados: La etapa cuantitativa muestra diferencias importantes en cada institución y entre instituciones con distintas tasas mensuales por encima de la tasa máxima mensual abogada por el COFEN de 6,7%. En la etapa cualitativa fueron rescatadas las decisiones de impacto positivo, por ellas tomadas, considerando el relacionamiento con los superiores, el diálogo y el atendimiento de las demandas de orden física y emocional de los profesionales como factores importantes. Conclusión: el absentismo resultó como un evento presente en el cotidiano del gerenciamiento del personal de enfermería, pues presentó variaciones en los distintos meses del año y en las distintas unidades de servicio siendo posible clasiicar frente a la mayor o menor problemáticas, además, mostró la enfermedad del trabajador, insatisfacción con las condiciones institucionales y el relacionamiento interpersonal inadecuado, lo que orienta para decisiones gestoras propias a la realidad.
DESCRIPTORES
REFERENCES
1. Bittar OJN. Indicadores de qualidade e quantidade em saúde. RAS Rev Adm Saúde. 2004;6 (12):15-8.
2. Campbell SM, Braspenning J, Marshall M. Research methods used in developing and applying quality indicator in primary care. Qual Saf Health Care. 2002;11(4):358-64.
3. Kurcgant P, Tronchin DMR, Melleiro MM, Castilho V, Machado VB, Pinhel I, et al. Quality indicators and evaluation of human resources management in health. Rev Esc Enferm USP [Internet]. 2009 [cited 2014 Aug 17];43(n.spe 2):1168-73. Available from: http://www.scielo. br/pdf/reeusp/v43nspe2/en_a04v43s2.pdf
4. Kurcgant P, Melleiro MM, Tronchin DMR. Indicadores para avaliação da qualidade do gerenciamento de recursos humanos em enfermagem. Rev Bras de Enferm. 2008;61(5):539-544.
5. Núcleo de Apoio à Gestão Hospitalar (NAGEH). Programa de Qualidade Hospitalar (CQH). Manual de indicadores de enfermagem NAGEH. 2ª ed. São Paulo: APM/CREMESP; 2012.
6. Conselho Federal de Enfermagem. Resolução 293/2004, de 21 de setembro de 2004. Fixa e estabelece parâmetros para o Dimensionamento do Quadro de Profissionais de Enfermagem nas Unidades Assistenciais das Instituições de Saúde e Assemelhados [Internet]. Brasília: COFEN; 2004 [cited 2014 Aug. 17]. Available from: http://www.cofen.gov.br/resoluo-cofen-2932004_4329.html
7. Minayo MCS. Pesquisa social: teoria, método e criatividade. Petrópolis: Vozes; 2012.
8. Ferreira EV, Amorim MJDM, Lemos RMC, Ferreira NS, Silva FO, Laureano Filho JR. Absenteísmo dos trabalhadores de enfermagem em um Hospital Universitário do Estado de Pernambuco. Rev RENE. 2011;12(4):742-9.
9. Sancinetti TR, Soares AVN, Lima AFC, Santos NC, Melleiro MM, Fugulin FMT, et al. Nursing staff absenteeism rates as a personnel management indicator. Rev Esc Enferm USP [Internet]. 2011 [cited 2014 Aug 17];45(4):1007-12. Available from: http://www.scielo.br/ pdf/reeusp/v45n4/en_v45n4a31.pdf
10. Laus AM, Anselmi ML. Absenteeism of nursing workers in a school hospital. Rev Esc Enferm USP [Internet]. 2008 [cited 2014 Aug 17];42(4):681-9. Available from: http://www.scielo.br/pdf/reeusp/v42n4/en_v42n4a09.pdf
11. Abreu RMD. Estudo do absenteísmo na equipe de enfermagem de um Hospital de Ensino [dissertação]. Uberaba: Universidade Federal do Triângulo Mineiro; 2009.
12. Lemos MC, Rennó CO, Passos JP. Absenteísmo na equipe de enfermagem: uma revisão de literatura. Rev Pesq Cuid Fundam. 2012;Supl.1:13-6.
13. Costa FM, Vieira MAS, Sena RR. Absenteísmo relacionado à doenças entre membros da equipe de enfermagem de um hospital escola. Rev Bras Enferm. 2009;62(1):38-44.
14. Umann J, Guido L, Grazziano ES. Presenteeism in hospital nurses. Rev Latino Am Enfermagem. 2012;20(1):159-66.