Violence against metropolitan
bus drivers and fare collectors
in Brazil
Violência a motoristas e cobradores
de ônibus metropolitanos, Brasil
I Programa de Pós-Graduação em Saúde
Pública. Departamento de Medicina Preventiva e Social. Faculdade de Medicina. Universidade Federal de Minas Gerais. Belo Horizonte, MG, Brasil
II Programa de Pós-Graduação em Ciências
Fonoaudiológicas. Departamento de Fonoaudiologia. Faculdade de Medicina. Universidade Federal de Minas Gerais. Belo Horizonte, MG, Brasil
Correspondence: Ada Ávila Assunção
Av. Alfredo Balena, 190 sala 705 Santa Efigênia 30130-100 Belo Horizonte, MG, Brasil E-mail: [email protected] Received: 2/12/2014
Approved: 9/3/2014
Article available from: www.scielo.br/rsp
ABSTRACT
OBJECTIVE: To analyze the correlation between sociodemographic factors and working conditions of bus workers in a metropolitan area and violence against them.
METHODS: This cross-sectional study used a nonprobabilistic sample estimated according to the number of workers employed in bus companies located in three cities in the Belo Horizonte metropolitan region in 2012 (N = 17,470). Face-to-face interviews were conducted using a digital questionnaire. The factors associated with violence were analyzed in two stages using Poisson regression, according to each level. The magnitude of the association was evaluated using prevalence ratios with robust variance and a statistical signiicance of 5%, and 95% conidence intervals were obtained. RESULTS: The study sample comprised 782 drivers and 691 fare collectors; 45.0% participants reported at least one act of violence in the workplace in the last 12 months, with passengers being predominantly responsible. The age of the bus workers was inversely associated with violence. Chronic diseases, sickness absenteeism, and working conditions were also associated with violence.
CONCLUSIONS: The indings on the correlation between violence and working conditions are essential for implementing prevention strategies by transportation service managers.
DESCRIPTORS: Transportation Manpower. Violence. Working Conditions. Occupational Health. Metropolitan Zones.
Ada Ávila AssunçãoI
In the metropolitan transportation system, bus drivers, fare collectors, and passengers are exposed to noise and air pollution, trafic, pedestrian accidents, colli -sions with other vehicles, occupational accidents, user dissatisfaction with the quality of transportation services, and other situations that favor the development of conlicts.11,15,21 For this reason, social reforms and sectorial policies that address the inherent dangers in the metropolitan public transportation system have been discussed. In this scenario, the activity of bus workers is affected by events that relect different opportunities and socioeconomic conditions,2 and these events in turn
impact access to transportation services and the health statuses of people.8
Work-related violence constitutes any conduct consid-ered unreasonable that results in abuse, threats, or aggression in the workplace with explicit or implied damage to the safety, well-being, and health of profes-sionals,14 i.e., any event directly or indirectly related
to the labor activity of the victim. According to the
RESUMO
OBJETIVO: Analisar associação entre fatores sociodemográicos e de condições de trabalho e violência contra proissionais de ônibus de região metropolitana. MÉTODOS: Estudo transversal com amostra não probabilística, estimada segundo quotas do efetivo distribuído nas empresas de ônibus localizadas em três cidades da região metropolitana de Belo Horizonte, em 2012 (n = 17.470). Foram realizadas entrevistas face a face com questionário digital. A análise dos fatores associados à violência foi realizada em duas etapas, pela regressão de Poisson, de acordo com cada nível. A magnitude da associação foi aferida pelas razões de prevalência com variância robusta e signiicância estatística de 5%. Foram obtidos intervalos de coniança de 95%.
RESULTADOS: Participaram da pesquisa 782 motoristas e 691 cobradores. Quase metade (45,0%) dos participantes relatou pelo menos um episódio de violência no trabalho nos últimos 12 meses, predominantemente praticado pelos passageiros. A idade do trabalhador rodoviário foi inversamente associada à violência. Doenças crônicas, absenteísmo-doença e condições de trabalho foram associados à violência.
CONCLUSÕES: As informações trazidas sobre a associação da violência com as condições de trabalho são fundamentais para guiar estratégias de prevenção indicadas aos gestores da produção dos serviços de transporte.
DESCRITORES: Transportes, recursos humanos. Violência. Condições de Trabalho. Saúde do Trabalhador. Zonas Metropolitanas.
INTRODUCTION
work absenteeism data from Canada, 17.0% cases of victimization and violence occur in the workplace.3 In
Brazil, there is no consistent and detailed data about this phenomenon.
Several aspects of such violence should be considered when assessing the risk factors: nature (individual, cultural, organizational, or system-related), origin (internal or external to the institution), form (attack, abuse, aggression, slander, persecution, and harass-ment, among others), and type (according to the rela-tionship between the offender and the victim).12,14 The
debts, and others) with the target victim, who works in a certain business establishment.22
Work-related violence is the main occupational health problem worldwide, regardless of the country’s level of development. The most vulnerable groups are public transportation workers, health care workers, security oficers, military personnel, taxi drivers, judicial ofi -cers, educators, social workers, and staff in commer-cial establishments.17,22
As a sociological fact, scenes of urban violence can be interpreted in light of the associations between social and physical spaces.1 Municipal transportation users,
including bus users, are located within the physical space and express their social status in relation to other social groups, including bus workers. Considering the dynamics of the circulation of these social groups, social inequities become evident in different organi-zational layouts (suburbs, ghettos, neighborhood with both lower and higher socioeconomic strata, and down-town areas) and in the access to/characteristics of the transportation system (e.g., individual or collective, motorized or not, public or private) used by the distinct social groups.15
The spaces (public or private) in which the social groups are integrated are related to the distribution structure of the goods or services available.1 With regard to
metro-politan public transportation buses, passengers, pedes-trians, and bus workers converge into the geographic space of the transportation system that connects the downtown area to the suburbs, and consequently these groups share a motorized physical environment, i.e., the bus.
The objective of this study was to analyze the correla -tion between sociodemographic factors and working conditions of bus workers in the metropolitan area and violence against them.
METHODS
This cross-sectional study involved drivers and fare collectors in metropolitan public transportation companies in the cities of Belo Horizonte, Betim, and Contagem, MG, Southeastern Brazil. The sample universe of the three cities investigated represented 17,470 workers, as follows: Belo Horizonte, with approximately 6,500 drivers and 6,750 fare collectors; Betim, with 696 drivers and 524 fare collectors; and Contagem, with 1,800 drivers and 1,200 fare collectors.
A quota proportional to the total number of profes-sionals in each of the three cities was selected. Sample size was estimated considering a sampling error of 4.0%, a conidence interval of 95%, and prevalence of 50.0% as the range of outcomes of interest. On the basis of the data obtained in the workers’ trade
unions from each city, the percentage of drivers and fare collectors in the three locations was estimated as follows: 72.0% and 80.0% in Belo Horizonte, 8.0% and 6.0% in Betim, and 20.0% and 14.0% in Contagem, respectively. Considering this estimate and the criteria presented, we estimated a sample represented by 1126 professionals, composed of 565 drivers and 561 fare collectors. In addition, 1,607 bus workers participated in the study, of which 853 were drivers (565 in Belo Horizonte, 164 in Betim, and 124 in Contagem) and 754 were fare collectors (549 in Belo Horizonte, 107 in Betim, and 98 in Contagem).
Data were collected between April and June 2012, during morning and afternoon shifts, using direct inter-views with the aid of netbook computers. A software was created exclusively for the study, considering the objectives involving completion of a digital question -naire (by the interviewer) and online data processing.
Data from the literature and previous interviews with union representatives and workers guided the prepa-ration of the questions related to the urban transpor-tation system. The questionnaire included data on the sociodemographic proile, work conditions, lifestyle and quality of life, health status, and violence/victim-ization. The collection procedures were tested in a pilot study involving 30 participants. Speciic work -shops were conducted by the study coordinators to train 22 interviewers.
The reliability of the interviews was measured by reappli-cation of some questions selected from the original ques-tionnaire to the same respondents (12.0% participants). The interviews were conducted in four of the ive bus-subway stations in Belo Horizonte, and in 35 of the 244 resting stations in the three cities evaluated. On average, 80.0% passengers who use the metropolitan transporta -tion services in Belo Horizonte pass through these four bus-subway stations. The resting stations selected were those that concentrated most of the buses, itineraries, and registered workers.
The study results were disclosed by the Radio Favela radio station in Belo Horizonte in its Saturday program for urban public transportation workers. Before the team initiated the study, posters and brochures were distributed to the companies and unions.
The independent variables were grouped to organize a hierarchical model of analysis (Figure).
Suspicion of alcohol abuse was assessed using four questions that comprise the Cut down, Annoyed by criticism, Guilty and Eye-opener (CAGE) scale, vali-dated for Brazil.13
Analysis of the factors associated with violence was performed in two stages, using Poisson regression according to each level (Figure). The magnitude of the association was measured using prevalence ratios with robust variance intervals, and a statistical signiicance of 5% and 95% conidence intervals were obtained. In the irst stage, bivariate Poisson regression analysis was performed considering the explanatory variables of each level (Figure). Workers who experienced at least one act of aggression or threat were compared with workers who reported not having experienced such violence. In the second step, intermediate models were created. All variables associated with acts of violence
with p ≤ 0.20 in the bivariate analysis were included in the multivariable models, considering only the vari-ables belonging to the same level (Figure). Sequential deletion of the variables was used in the intermediate models, and only the variables associated with the experience of violence (p < 0.05) were included in the model. For the statistical analysis, SPSS 17.0 and Stata 11.0 software was used.
The study was approved by the Research Ethics Committee of the Universidade Federal de Minas Gerais (registered under CAAE ‒ 02705012.4.0000.5149). All participants signed a free and informed consent form.
RESULTS
A total of 1,473 valid questionnaires (91.0%) were obtained; 45.0% of the respondents reported having experienced at least one episode of aggression or threat in the workplace in the last 12 months. Of these, 33.0% reported that the episodes occurred more than once (frequently or sometimes). Passengers were respon-sible for 87.0% of the acts of violence whereas 13.0% episodes were committed by pedestrians, coworkers, or superiors.
The study sample consisted primarily of men (87.0%) with a mean age of 36 years (18-75 years), and 67.0% were aged ≤ 40 years. Most workers (73.0%) were self-declared as being of mixed or black ethnicity; 82.0% had ≥ 8 years of schooling, 60.0% were married, and 84.0% had a family income > 2 minimum wages. Of the respondents, 52.0% did not practice any phys -ical activity on a weekly basis, 14.0% probably used alcohol in an abusive manner. Furthermore, 70.0% had a medical diagnosis of one or more diseases, 35.0% were on sick leave in the last 12 months for health reasons, and 80.0% rated their health as very good or good. Most workers (53.0%) were drivers or driver/conduc -tors and reported having a formal employment contract (84.0%) and < 5 years in their current position (56.0%). Approximately 70.0% professionals worked overtime (28.0% sometimes and 45.0% always or usually) and did not take breaks during the working period (40.0% sometimes and 30.0% always or almost always). In addition, 48.0% of the respondents never or rarely worked on the same bus.
The majority of respondents reported that they perceived the trafic as bad or very bad (85.0%) and considered the conditions inside the bus as adequate: tolerable or slightly uncomfortable temperature (55.0%), good lighting (67.0%), no exposure to whole-body vibration (40.0%), good equipment and technical resources (43.0%), negligible or moderate noise level inside (49.0%) and outside the bus (62.0%).
Figure. Hierarchical model of analysis. Belo Horizonte, MG, Southeastern Brazil, 2012.
1st level (sociodemographic indicators)
Sex, ethnicity, age, marital status, veducation, family income
Event
Experienced violent act in the workplace
2nd level (lifestyle and health status)
Physical activity, suspected alcohol abuse, health status, health-related absenteeism in the last 12 months, self-rated health condition, number of chronic diseases
diagnosed by a physician
3rd level (functional activity)
Current employment, work position occupied, length of employment in current position, double shifts
and overtime, always work in the same bus, lack of breaks during the working period
4th level (workplace)
Perception about the quality of the traffic and noise outside the bus, perceptions of conditions inside the bus
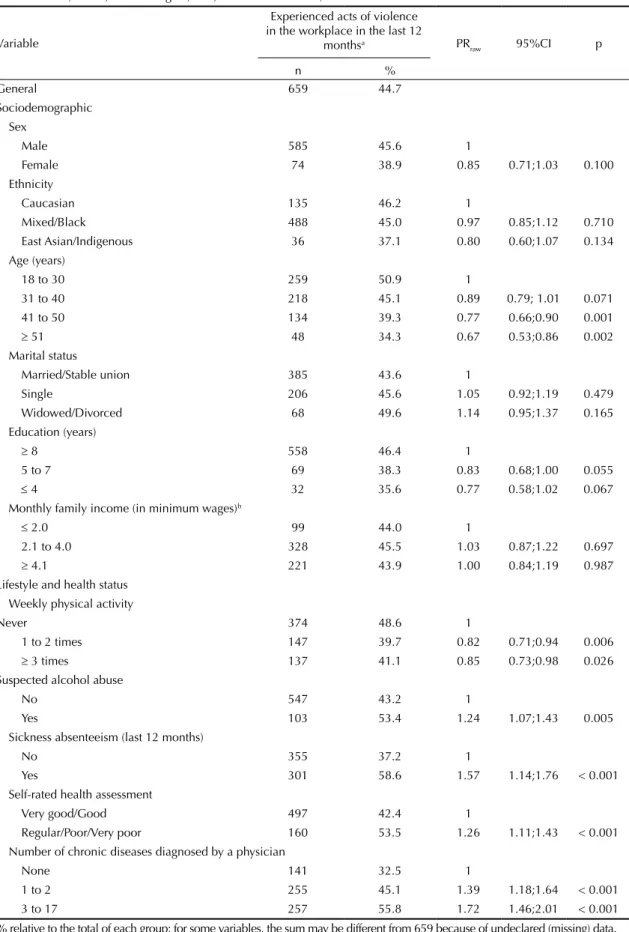
Among the sociodemographic characteristics related to lifestyle and health, age > 40 years and performance of physical activity on a weekly basis were nega-tively correlated with the event in the bivariate anal-ysis (p < 0.05). The proportions of cases of violence in the workplace were positively associated (p < 0.05) with alcohol abuse, sickness absenteeism, worse self-assessed health (fair, poor, and very poor), and at least one chronic disease diagnosed by a physician (Table 1).
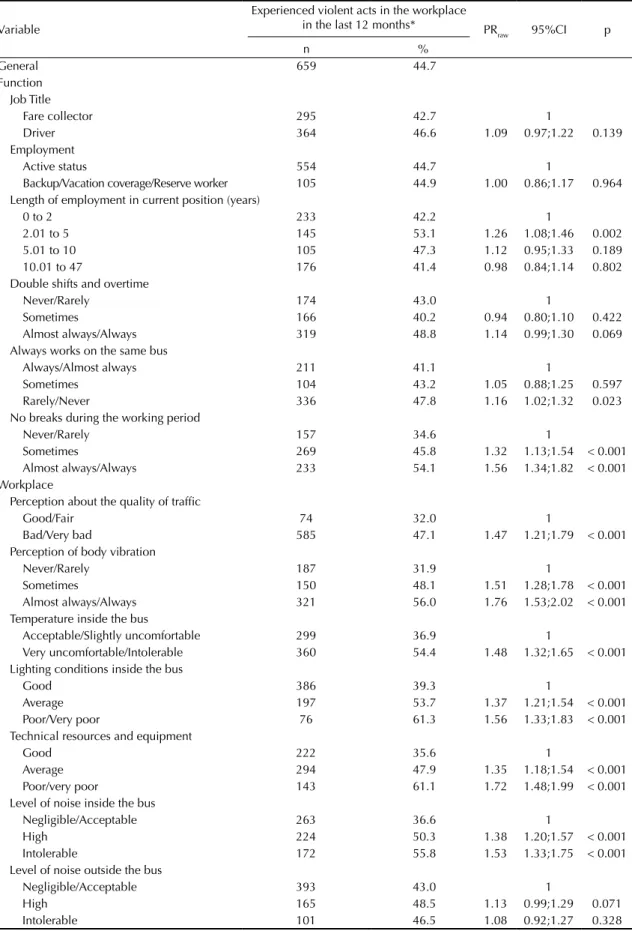
The work-related variables which were signiicantly correlated with the event in the bivariate analysis were as follows: 2-5 years in the current position, rarely or never working on the same bus, frequent deprivation of breaks during the working period, and assessment of workplace conditions as inadequate (trafic, body vibration, temperature, lighting, technical resources, equipment, and noise level inside the bus) (Table 2).
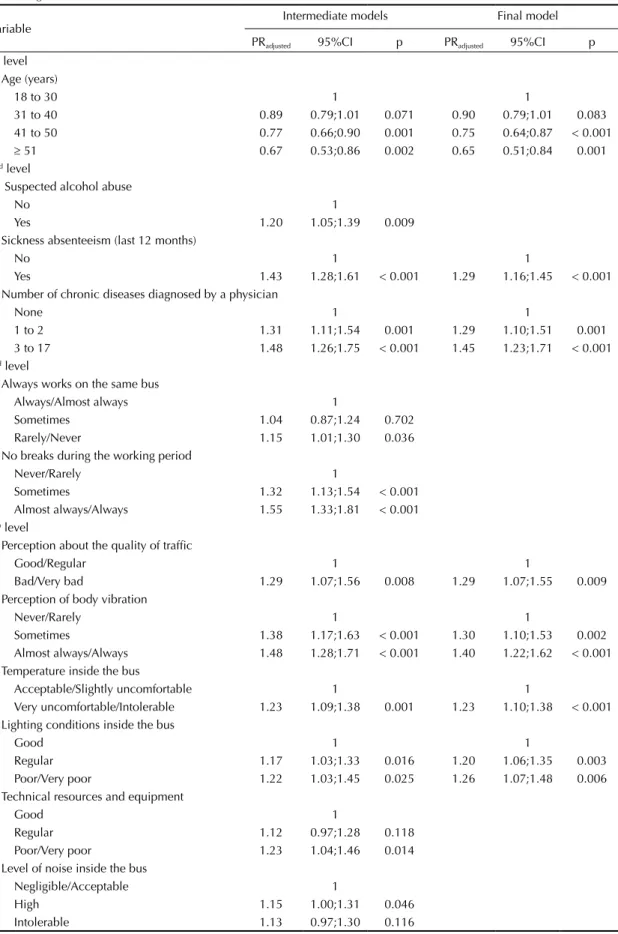
Table 3 presents the variables according to their degree of statistically signiicant correlation with the event in the multivariate analysis (intermediate models) and in the inal model.
In the inal model, the prevalence of acts of violence in the workplace was inversely correlated with age > 40 years. The variables that were positively corre-lated with acts of violence in the workplace were: being on sick leave, at least one chronic disease diag-nosed by a physician, poor or very poor trafic condi -tions, frequent exposure to whole-body vibration, very uncomfortable or intolerable temperature inside the bus, and inadequate lighting (fair, poor, or very poor). The other variables, i.e., alcohol abuse, working on the same bus, lack of breaks during the working period, insuf-icient technical resources and equipment, and noise level inside the bus, lost their effect after adjustment of the hierarchical model (Table 3).
DISCUSSION
We observed that 45.0% participants reported having experienced acts of violence in the Belo Horizonte metropolitan area (BHMA) in the 12 months prior to the study, and these experiences were correlated with age, health status, sickness absenteeism, working condi-tions, and trafic conditions.
Although worrying, the percentage of reports of acts of violence identiied in this study was lower than that found in a similar study conducted in Maputo, Mozambique4 (70.8%), particularly with regard to
type II violence (passenger-related). Despite the absence of a national panorama, a study conducted in Salvador, Bahia, Brazil, showed the vulnerabilities of bus workers: 20,572 assaults on buses, with an estimate that each bus worker experienced one or two assault incidents in the workplace between 1990 and 1998.16
The negative association between acts of violence and age may be a result of skills developed during the professional career, and these skills help more expe-rienced workers face stressful situations and events.20
With regard to the respondent’s health status, a posi -tive correlation was found between the event, sick-ness absenteeism, and the number of chronic diseases diagnosed by a physician. Considering the entirety of the situation (environment, labor relations, and secu-rity), this result was expected, considering that expo-sure contributes to worsened health status, which in turn affects the personal willingness to confront situa-tions or occupational stressors that culminate in violent acts.8,23 In Canada, the duration of work absenteeism
after acts of violence was 50.0%, which was 68.0% longer compared with the duration of absenteeism from other causes.3
With regard to the correlation between the event and chronic diseases diagnosed by a physician, previous studies have shown that intimidation suffered by workers while performing their duties is associated with increased fatigue and stress, depression, suicidal tendencies, anxiety, and psychosomatic complaints.6,7
In Denmark, men involved in occupations susceptible to exposure to violence were at 50.0% higher risk of developing stress-related diseases.23 In Sweden,
work-load (in hours) was associated with arterial hyperten-sion and musculoskeletal disorders in metropolitan bus drivers.8 In addition, organizational aspects (long
work periods, restricted breaks, poor social support) and uncomfortable eating conditions were associated with harmful habits (e.g., unbalanced diet), which in turn were correlated with the development of chronic diseases.8
The relationship between fleet/available bus lines and number of passengers as well as the leet’s state of conservation can affect not only drivers and fare collectors but also the passengers who suffer the effects of such conditions. Moreover, lack of transpor-tation coverage in certain metropolitan areas, delays, overcrowded buses, long lines, and discomfort during the trip are common.2 In short, the many risks8 that
drivers and fare collectors encounter are associated with increased susceptibility to illnesses among these professionals and the decline in the quality of services provided. The experience of poor and very poor trafic conditions and exposure to whole-body vibration and temperature and inadequate lighting conditions inside the bus were statistically correlated with violence in the workplace. These results are unprecedented and reinforce the occurrence of various physical and psychosocial risks to which these professionals are exposed.8 Considering the complexity of this
environ-ment, Zannin24 suggested a decrease in the workload
Table 1. Descriptive analysis of the event and bivariate association between experiencing acts of violence in the workplace and sociodemographic characteristics, lifestyle, and health status among urban public transportation drivers and fare collectors in Belo Horizonte, Betim, and Contagem, MG, Southeastern Brazil, 2012.
Variable
Experienced acts of violence in the workplace in the last 12
monthsa PR
raw 95%CI p
n %
General 659 44.7
Sociodemographic Sex
Male 585 45.6 1
Female 74 38.9 0.85 0.71;1.03 0.100
Ethnicity
Caucasian 135 46.2 1
Mixed/Black 488 45.0 0.97 0.85;1.12 0.710
East Asian/Indigenous 36 37.1 0.80 0.60;1.07 0.134
Age (years)
18 to 30 259 50.9 1
31 to 40 218 45.1 0.89 0.79; 1.01 0.071
41 to 50 134 39.3 0.77 0.66;0.90 0.001
≥ 51 48 34.3 0.67 0.53;0.86 0.002
Marital status
Married/Stable union 385 43.6 1
Single 206 45.6 1.05 0.92;1.19 0.479
Widowed/Divorced 68 49.6 1.14 0.95;1.37 0.165
Education (years)
≥ 8 558 46.4 1
5 to 7 69 38.3 0.83 0.68;1.00 0.055
≤ 4 32 35.6 0.77 0.58;1.02 0.067
Monthly family income (in minimum wages)b
≤ 2.0 99 44.0 1
2.1 to 4.0 328 45.5 1.03 0.87;1.22 0.697
≥ 4.1 221 43.9 1.00 0.84;1.19 0.987
Lifestyle and health status Weekly physical activity
Never 374 48.6 1
1 to 2 times 147 39.7 0.82 0.71;0.94 0.006
≥ 3 times 137 41.1 0.85 0.73;0.98 0.026
Suspected alcohol abuse
No 547 43.2 1
Yes 103 53.4 1.24 1.07;1.43 0.005
Sickness absenteeism (last 12 months)
No 355 37.2 1
Yes 301 58.6 1.57 1.14;1.76 < 0.001
Self-rated health assessment
Very good/Good 497 42.4 1
Regular/Poor/Very poor 160 53.5 1.26 1.11;1.43 < 0.001
Number of chronic diseases diagnosed by a physician
None 141 32.5 1
1 to 2 255 45.1 1.39 1.18;1.64 < 0.001
3 to 17 257 55.8 1.72 1.46;2.01 < 0.001
Table 2. Descriptive analysis of the event and bivariate association between experiencing acts of violence in the workplace and aspects of functional activity and working conditions among urban public transportation drivers and fare collectors in Belo Horizonte, Betim, and Contagem, MG, Southeastern Brazil, 2012.
Variable
Experienced violent acts in the workplace in the last 12 months* PR
raw 95%CI p
n %
General 659 44.7
Function Job Title
Fare collector 295 42.7 1
Driver 364 46.6 1.09 0.97;1.22 0.139
Employment
Active status 554 44.7 1
Backup/Vacation coverage/Reserve worker 105 44.9 1.00 0.86;1.17 0.964
Length of employment in current position (years)
0 to 2 233 42.2 1
2.01 to 5 145 53.1 1.26 1.08;1.46 0.002
5.01 to 10 105 47.3 1.12 0.95;1.33 0.189
10.01 to 47 176 41.4 0.98 0.84;1.14 0.802
Double shifts and overtime
Never/Rarely 174 43.0 1
Sometimes 166 40.2 0.94 0.80;1.10 0.422
Almost always/Always 319 48.8 1.14 0.99;1.30 0.069
Always works on the same bus
Always/Almost always 211 41.1 1
Sometimes 104 43.2 1.05 0.88;1.25 0.597
Rarely/Never 336 47.8 1.16 1.02;1.32 0.023
No breaks during the working period
Never/Rarely 157 34.6 1
Sometimes 269 45.8 1.32 1.13;1.54 < 0.001
Almost always/Always 233 54.1 1.56 1.34;1.82 < 0.001
Workplace
Perception about the quality of traffic
Good/Fair 74 32.0 1
Bad/Very bad 585 47.1 1.47 1.21;1.79 < 0.001
Perception of body vibration
Never/Rarely 187 31.9 1
Sometimes 150 48.1 1.51 1.28;1.78 < 0.001
Almost always/Always 321 56.0 1.76 1.53;2.02 < 0.001
Temperature inside the bus
Acceptable/Slightly uncomfortable 299 36.9 1
Very uncomfortable/Intolerable 360 54.4 1.48 1.32;1.65 < 0.001
Lighting conditions inside the bus
Good 386 39.3 1
Average 197 53.7 1.37 1.21;1.54 < 0.001
Poor/Very poor 76 61.3 1.56 1.33;1.83 < 0.001
Technical resources and equipment
Good 222 35.6 1
Average 294 47.9 1.35 1.18;1.54 < 0.001
Poor/very poor 143 61.1 1.72 1.48;1.99 < 0.001
Level of noise inside the bus
Negligible/Acceptable 263 36.6 1
High 224 50.3 1.38 1.20;1.57 < 0.001
Intolerable 172 55.8 1.53 1.33;1.75 < 0.001
Level of noise outside the bus
Negligible/Acceptable 393 43.0 1
High 165 48.5 1.13 0.99;1.29 0.071
Intolerable 101 46.5 1.08 0.92;1.27 0.328
Table 3. Prevalence ratios* for violence/victimization according to sociodemographic characteristics, lifestyle and health status, functional activity, and working conditions of urban public transportation drivers and fare collectors in Belo Horizonte, Betim, and Contagem, MG, Southeastern Brazil, in 2012.
Variable Intermediate models Final model
PRadjusted 95%CI p PRadjusted 95%CI p
1st level Age (years)
18 to 30 1 1
31 to 40 0.89 0.79;1.01 0.071 0.90 0.79;1.01 0.083
41 to 50 0.77 0.66;0.90 0.001 0.75 0.64;0.87 < 0.001
≥ 51 0.67 0.53;0.86 0.002 0.65 0.51;0.84 0.001
2nd level
Suspected alcohol abuse
No 1
Yes 1.20 1.05;1.39 0.009
Sickness absenteeism (last 12 months)
No 1 1
Yes 1.43 1.28;1.61 < 0.001 1.29 1.16;1.45 < 0.001
Number of chronic diseases diagnosed by a physician
None 1 1
1 to 2 1.31 1.11;1.54 0.001 1.29 1.10;1.51 0.001
3 to 17 1.48 1.26;1.75 < 0.001 1.45 1.23;1.71 < 0.001
3rd level
Always works on the same bus
Always/Almost always 1
Sometimes 1.04 0.87;1.24 0.702
Rarely/Never 1.15 1.01;1.30 0.036
No breaks during the working period
Never/Rarely 1
Sometimes 1.32 1.13;1.54 < 0.001
Almost always/Always 1.55 1.33;1.81 < 0.001
4th level
Perception about the quality of traffic
Good/Regular 1 1
Bad/Very bad 1.29 1.07;1.56 0.008 1.29 1.07;1.55 0.009
Perception of body vibration
Never/Rarely 1 1
Sometimes 1.38 1.17;1.63 < 0.001 1.30 1.10;1.53 0.002
Almost always/Always 1.48 1.28;1.71 < 0.001 1.40 1.22;1.62 < 0.001
Temperature inside the bus
Acceptable/Slightly uncomfortable 1 1
Very uncomfortable/Intolerable 1.23 1.09;1.38 0.001 1.23 1.10;1.38 < 0.001 Lighting conditions inside the bus
Good 1 1
Regular 1.17 1.03;1.33 0.016 1.20 1.06;1.35 0.003
Poor/Very poor 1.22 1.03;1.45 0.025 1.26 1.07;1.48 0.006
Technical resources and equipment
Good 1
Regular 1.12 0.97;1.28 0.118
Poor/Very poor 1.23 1.04;1.46 0.014
Level of noise inside the bus
Negligible/Acceptable 1
High 1.15 1.00;1.31 0.046
Intolerable 1.13 0.97;1.30 0.116
highlights the importance of wage increases to prevent the use of overtime, which results in more exposure and less recovery time.
Violent acts are more common in areas with a high social vulnerability index, where the transportation network and bus leet are commonly in poor condition. Vehicles circulating in degraded transportation routes suffer damages (e.g., vehicle misalignments) that can affect the professionals (e.g., whole-body vibration).16
The poor state of conservation of the transportation grid is one of the factors responsible for high mortality in trafic, primarily affecting drivers and fare collectors.21
Governmental regulation of the services provided by private companies creates tensions between the proit objectives of these companies and decreased transpor -tation fare prices that passengers demand.2 In this
situ-ation, wages and working conditions are sacriiced, and both of these factors can negatively affect the quality of services provided19 and the health of workers.8
Additional studies addressing labor relations in the context of the creation of public-private services are needed, as in the case of urban transport in the BHMA. With limited proit margins due to governmental regu -lations that control the fare prices, the companies strive to control costs related to workers’ pay, the scale of supply, and the rate of leet renovation, all of which impact leet conditions. A previous study found that, in parallel with wage stability, the prices for the other inputs needed to maintain the bus leet increased above inlation levels.19
This same study is one of the few that addresses the violence experienced by public bus workers in the BHMA. It reported a high mortality rate due to violence (17.3 deaths per 100,000 inhabitants)18 and a positive
correlation with working conditions, a dimension which has not been analyzed in most studies. The technical and organizational environment and context of urban transport services were examined and indicated that acts of violence in the workplace were hidden and had no social visibility, a situation also observed in other occupational categories.10 Therefore, it is plausible to
hypothesize that the consequences of violence in the workplace decrease the eficiency and effectiveness of the services.2
In short, traversing the urban transportation network can lead to exposure to multiple harmful factors because, in addition to the effects of the working conditions, this exposure overlaps with the exposure to general condi-tions of the roads and the external environment,11,15,21 increasing dissatisfaction among professionals and users, and the latter group may express discontent with the former through aggressive behavior.
Among the limitations of this study, the non-proba-bilistic nature of the sample and the volunteer effect7
are potential selection biases. The sample did not include subjects who were on leave from work or those who, because of deteriorating health condi-tions, were unable to remain active (healthy worker effect).5,9 The response variable depended on the respondent’s recollection of the acts of violence during the 12-month period, causing a potential information bias. In addition, self-reporting can lead to overestimation or underestimation of expo-sure. In cross-sectional designs, overcoming such biases is unlikely. However, less healthy individ-uals and those who are more vulnerable to unhealthy life styles were probably inclined to respond to the questionnaire and report their assessment of health status and work conditions; however, their percep -tion would tend to be more positive than that of the excluded participants. On the other hand, this situ -ation would counterbalance the over-represent-ation of healthy individuals, leading to greater proximity of the study group to the sample universe.
1. Bourdieu P. A miséria do mundo. Petrópolis: Vozes; 2003. Efeitos de lugar; p.159-75.
2. Brunoro CM, Sznelwar LI, Bolis I, Abrahão J. Contributions of ergonomics to the construction of bus drivers health and excellence in public transport and at work. Work.2012;41(Suppl 1):30-5. DOI:10.3233/WOR-2012-0131-30
3. Campolieti M, Goldenberg J, Hyatt D. Workplace violence and the duration of workers’ compensation claims. Ind Relat. 2008;63(1):57-84.
4. Couto MT, Lawoko S, Svanstrom L. Violence against drivers and conductors in the road passenger transport sector in Maputo, Mozambique. Afr Saf Promot J. 2009;7(2):17-36.
5. Froom P, Melamed S, Kristal-Boneh E, Benbassat J, Ribak J. Healthy volunteer effect in industrial workers. J Clin Epidemiol.1999;52(8):731-5. DOI:10.1016/S0895-4356(99)00070-0 6. Hansen AM, Hogh A, Persson R, Karlson
B, Garde AH, Ørbaek P. Bullying at work, health outcomes, and physiological stress response. J Psychosom Res. 2006;60(1):63-72. DOI:10.1016/j.jpsychores.2005.06.078 7. Hogh A, Borg V, Mikkelsen KL. Work-related
violence as a predictor of fatigue: a 5-year follow-up of the Danish Work Environment Cohort Study. Work Stress. 2003;17(2):182-94. DOI:10.1080/0267837031000156876
8. Johansson G, Evans GW, Cederström C, Rydstedt LW, Fuller-Rowell T, Ong AD. The effects of urban bus driving on blood pressure and musculoskeletal problems: a quasi-experimental study. Psychosom Med. 2012;74(1):89-92. DOI:10.1097/PSY.0b013e31823ba88f
9. Ki M, Sacker A, Kelly Y, Nazroo J. Health selection operating between classes and across employment statuses. J Epidemiol Community Health.
2011;65(12):1132-9. DOI:10.1136/jech.2009.107995 10. Lancman S, Sznelwar LI, Uchida S, Tuacek TA.
O trabalho na rua e a exposição à violência no trabalho: um estudo com agentes de trânsito.
Interface Comun Saude Educ. 2007;11(21):79-92.
DOI:10.1590/S1414-32832007000100008 11. Litman T. Transportation and public health.
Annu Rev Public Health. 2013;34:217-33.
DOI:10.1146/annurev-publhealth-031912-114502 12. Martinko MJ, Douglas SC, Harvey P.
Understanding and managing workplace aggression. Organ Dyn.2006;35(2):117-30. DOI:10.1016/j.orgdyn.2006.03.002
13. Masur J, Monteiro MG. Validation of the “CAGE” alcoholism screening test in a Brazilian psychiatric inpatient hospital setting. Braz J Med Biol Res. 1983;16(3):215-8.
14. Mayhew C, Chappell D. Workplace violence: an overview of patterns of risk and the emotional/ stress consequences on targets. Int J LawPsychiatry. 2007;30(4-5):327-39. DOI:10.1016/j.ijlp.2007.06.006 15. Organización Panamericana de la Salud. Informe
sobre el estado de la seguridad vial en la Región de las Américas. Washington (DC); 2009.
16. Paes-Machado E, Levenstein C. Assaltantes a bordo: violência, insegurança e saúde no trabalho em transporte coletivo de Salvador, Bahia, Brasil. Cad Saude Publica. 2002;18(5):1215-27. DOI:10.1590/S0102-311X2002000500014 17. Piquero NL, Piquero AR, Craig JM, Clipper SJ.
Assessing research on workplace violence 2000-2012.
Aggression Violent Beh. 2013;18(3):383-94.
18. Souza ER, Lima MLC. Panorama da violência urbana no Brasil e suas capitais. Cienc
Saude Coletiva. 2007;11(Supl):1211-22.
DOI:10.1590/S1413-81232006000500011 19. Assunção AA, Silva LS. Condições de trabalho
nos ônibus e os transtornos mentais comuns em motoristas e cobradores: Região Metropolitana de Belo Horizonte, Minas Gerais, Brasil, 2012.
Cad Saude Publica. 2013;29(12):2473-86.
DOI:10.1590/0102-311X00181412
20. Volkoff S, Buisset C, Mardon C. Does intense time pressure at work make older employees more vulnerable? A statistical analysis based on a French survey “SVP50”. Appl Ergon. 2010;41(6):754-62. DOI:10.1016/j.apergo.2009.12.014
21. Waldvogel BC. A população trabalhadora paulista e os acidentes do trabalho fatais.
Sao Paulo Perspec. 2003;17(2):42-53.
DOI:10.1590/S0102-88392003000200006 22. Wassell JT. Workplace violence intervention
effectiveness: a systematic literature review. Saf Sci. 2009;47(8):1049-55. DOI:10.1016/j.ssci.2008.12.001
23. Wieclaw J, Agerbo E, Mortensen PB, Burr H, Tüchsen F, Bonde JP. Work related violence and threats and the risk of depression and stress disorders. J
Epidemiol Community Health. 2006;60(9):771-5.
DOI:10.1136/jech.2005.042986
24. Zannin PHT. Occupational noise in urban buses.
Int Journal Ind Ergonom. 2006;36(10):901-5.
DOI10.1016/j.ergon.2006.06.010
REFERENCES